
M.O. Aremu
Department of Chemistry, Nasarawa State University, PMB 1022, Keffi, Nigeria
LiveDNA: 234.1611
ORCID: 0000-0003-1115-7874
B.G. Osinfade
Department of Science Laboratory Technology, Federal Polytechnic, Ilaro, Ogun State, Nigeria
S.K. Basu
Department of Biological Sciences, University of Lethbridge, Lethbridge, Alberta, TIK 3M4, Canada
B.E. Ablaku
Department of Chemistry, Nasarawa State University, PMB 1022, Keffi, Nigeria
American Journal of Food Technology
Year: 2011 | Volume: 6 | Issue: 12 | Page No.: 1021-1033


ABSTRACT
Ogi is a maize product and a popular starchy porridge in the west coasts of Africa. Although consumed by adults as a breakfast cereal, its main use is as weaning food for infants. In this study, the nutritional quality of ogi from a composite mixture of maize (Zea mays L.) and kersting’s groundnut (Kerstingiella geocarpa L.) flours was evaluated using standard processing techniques. Maize flour was substituted with kersting’s groundnut seed flour at ratios of 90:10, 80:20, 70:30 and 60:40 maize: kersting’s groundnut; with 100% maize ogi flour as control. The results showed that protein and fat contents increased with increased kersting’s groundnut seed flour substitution, reaching 61.14 and 14.63% dry weight, respectively at 60:40 ratios. All the macro-minerals (Ca, P, Mg, K and Na) analyzed for also recorded increased concentrations in the ogi flours with increased kersting’s groundnut seed substitutions. Harmful heavy metals such as lead and cadmium were not detected. The Total Essential Amino Acids (TEAA) ranged from 26.4-32.6 g/100 g crude protein or from 47.9-48.4% of The Total Amino Acid (TAA) while the Limiting Amino Acid (LAA) for all the samples was Met+Cys based on the provisional FAO/WHO standards. Generally, the present study indicates that at = 30% Kerstingiella geocarpa seed substitution ogi can be maintained, with higher nutrient content.
PDF Abstract XML References Citation
Received: August 03, 2011;
Accepted: November 03, 2011;
Published: December 12, 2011
How to cite this article
M.O. Aremu, B.G. Osinfade, S.K. Basu and B.E. Ablaku, 2011. Development and Nutritional Quality Evaluation of Kersting’s Groundnut-Ogi for African Weaning Diet. American Journal of Food Technology, 6: 1021-1033.
DOI: 10.3923/ajft.2011.1021.1033
URL: https://scialert.net/abstract/?doi=ajft.2011.1021.1033
DOI: 10.3923/ajft.2011.1021.1033
URL: https://scialert.net/abstract/?doi=ajft.2011.1021.1033
INTRODUCTION
Children in most developing countries particularly those in low-income classes are weaned on cheap, readily available starchy foods. This can be attributed to several factors including poor nutritional education, decline in household incomes and the unavailability of nutritious commercial formulae (Adeyemi et al., 1987). This has led to the continued research foods and their incorporation into traditional staples. Efforts are also made to ferment the local starchy staples in order to raise their nutritional status (Enujiugha, 2003).
Fermented maize product, ogi, is a popular weaning and breakfast cereal in sub-Saharan African (Banigo and Muller, 1972). Ogi is traditionally prepared by natural fermentation (steeping maize grains in water for 2-4 days at room temperature), followed by wet milling, sieving and souring slurry (2-3 days rest at room temperature). The periods of fermentation and souring determine the degree of sourness (measured by titratable acidity) acid, to a large extent, the nutrient status of ogi (Adeyemi and Beckkley, 1986). Although previous investigators produced ogi with acceptable sensory characteristics without a steeping stage (Adeniji and Potter, 1978; Sokari et al., 1991), it is during the steeping stage that the desirable microorganism for fermenting the ogi slurry comes into prominence by outgrowing other microorganism (Aremu et al., 2011).
Attempts are currently made in the developing world where maize is a major staple, to supplement it with certain unconventional legumes and oilseeds that contain adequate amounts of the limiting amino acids. One such legume source is kersting’s groundnut (Kerstingiella geocarpa L.) seed. Kerstingiella geocarpa seed, like some other legumes and oilseeds, is known to contain essential minerals (Aremu et al., 2008), nutritionally useful quantities of essential amino acids (Aremu et al., 2006a), phytate and tannins (Aremu et al., 2009) but these anti-nutritional factors are usually removed or greatly reduced during hydrothermal treatment, soaking and fermentation which the seeds are subjected to during processing (Audu and Aremu, 2011). However, it remains to be known how much of the treated seed is needed by a weaning-age child without negative nutritional effects. The present study examines the effect of supplementing maize product, ogi, with defatted hydrothermal treated Kerstingiella geocarpa seeds on the nutritional status of the product.
MATERIALS AND METHODS
Sample collection and preparation: The white maize grains (Zea mays L.) and kersting’s groundnut seeds (Kerstingiella geocarpa L.) used for the study were purchased from Nasarawa market in Nasarawa State, Nigeria. The ogi and Kerstingiella geocarpa seed flours were produced in the laboratory as outlined in Fig. 1. Wet milling was done using laboratory Kenwood blender (Mini-Processor Model A90LD, Thom Emi Kenwood Small Appliance Ltd., Hampshire, UK) while milling of the flours was done using Hammer Mill, to pass through a 0.25 mm screen. The dehulled Kerstingiella geocarpa seed flour was added to maize flour at substitution levels of 10, 20, 30 and 40%, respectively; 100% maize flour served as control. The blended flours were then packaged in moisture-proof, air-tight polyethylene containers and kept at 4°C prior to analyses.
Proximate analyses: The moisture, ash, ether extract, crude fibre, crude protein (N x 6.25) and carbohydrate (by difference) were determined in accordance with AOAC (1995) methods. All proximate analyses of the sample flours were carried out in triplicate and reported in percentage. All chemicals were of analar grade.
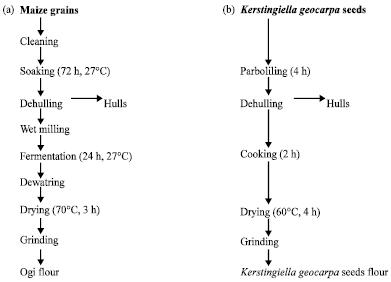 |
| Fig. 1(a-b): | Processing methods adapted for the production of (a) ogi and (b) Kerstingiella geocarpa seed flours |
Mineral analysis: The minerals were analyzed by dry-ashing the samples at 500°C to constant weight and dissolving the ash in volumetric flask using distilled, deionised water with a few drops of concentrated hydrochloric acid. Sodium and potassium were determined by using a flame photometer (Model 405, Corning, UK) using NaCl and KCl to prepare the standards. All other metals were determined by atomic absorption spectrophotometer (Perkin-Elmer Model 403, Norwalk, CT, USA).
Amino acid analysis: Amino acid analysis was by Ion Exchange Chromatography (IEC) (FAO/WHO, 1991) using the Technicon Sequential Multisample (TSM) Amino Acid Analyzer (Technicon Instruments Corporation, New York). The period of analysis was 76 min for each sample. The gas flow rate was 0.50 mL min-1 at 60°C with reproducibility consistent within ±3%. The net height of each peak produced by the chart recorder of the TSM (each representing an amino acid) was measured and calculated. The amino acid values reported were the averages of two determinations. Norleucine was the internal standard. Tryptophan was not determined.
Determination of quality parameters
Determination of isoelectric point (pI): The predicted isoelectric point was evaluated (Olaofe and Akintayo, 2000):
where, pIm is the isoelectric point of the mixture of amino acids, pIø is the isoelectric point of the øth amino acids in the mixture and Xø is the mass or mole fraction of the amino acids in the mixture.
Determination of amino acid scores: Determination of the amino acid scores was first based on whole hen’s egg (Paul et al., 1976). In this method, both essential and non-essential amino acids were scored. Secondly, amino acid score was calculated using the following formula (FAO/WHO, 1973):
In this method, Met+Cys and Phe+Tyr were each taken as a unit. Also, only essential amino acids determined were scored. Amino acid score was also calculated based on the composition of the amino acids obtained in the samples compared with the suggested pattern of requirements for pre-school children (2-5 years). Here, Met+Cys and Phe+Tyr were each taken as a unit. Also, only essential amino acids with (His) were scored.
Determination of the essential amino acid index: The Essential Amino Acid Index (EAAI) was calculated by using the ratio of test protein to the reference protein for each of the eight essential amino acid plus histidine in the equation that follow (Steinke et al., 1980; Adeyeye, 2010).
Methionine and cystine are counted as a single amino acid value in the equation, as are Phe+Tyr.
Determination of the predicted protein efficiency ratio: The predicted protein efficiency ration (P-PER) was determined using the following equation (Nieman et al., 1992):
P-PER = 0.468+0.454 (Leu)-0.105 (Tyr) |
Calculations and statistical analyses: Sodium/potassium (Na/K), calcium/phosphorus (Ca/P) and Leu/Ile ratios were calculated for the samples (Nieman et al., 1992; Adeyeye and Aremu, 2010). The fatty acid values were obtained by multiplying crude fat value of each sample with a factor of 0.8 (i.e., crude fatx0.8 = corresponding to fatty acids value (Paul and Southgate, 1978). The energy values were calculated by adding up the carbohydratex17 kJ, crude proteinx17 kJ and crude fatx37 kJ for each of the samples (Kilgore, 1987). Standard deviations were calculated using MS Excel spread sheet from the three determinations done on each sample for the proximate composition and was used as the measure of dispersion.
RESULTS AND DISCUSSION
Increased Kerstingiella geocarpa seed substitution gave progressively higher protein and oil content of the product, with lower carbohydrate content (Table 1). It has been reported (Enujiugha, 2006; Aremu, 1993) that the traditional method of ogi processing is usually accompanied by severe nutrient losses which aggravates the poor nutritional quality of normal dent corn. There was progressive decrease in moisture content of the fortification product; this could mean a reduction in pre-disposition to shelf spoilage (Aremu et al., 2006a). Though, there was progressive decrease in the calculated metabolizable energy values of Kerstingiella geocarpa seed-substituted maize-ogi flours but difference in each product not significant (p>0.05). Kerstingiella geocarpa is known to have containing energy concentration favourably compare to cereal (Aremu et al., 2011).
| Table 1: | Mean proximate composition (%) of maize ogi fortified with Kerstingiella geocarpa seed flour |
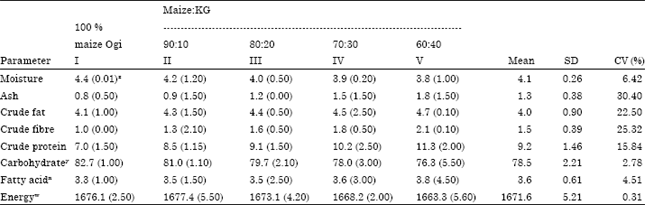 | |
zNo. in parentheses are standard deviations of triplicate determinations, yCarbohydrate percent calculated as the (100-total of other components), xCalculated fatty acids (0.8 x crude fat), wCalcualted metabolisable energy kJ 100 g-1) (protein x 17+fat x 37+carbohydrate x 17), KG: Kerstingiella geocarpa | |
Despite the effect of fortification processes the coefficient of variation (CV%) levels were relatively close with hot spot at 30.40 in ash content whereas others ranged from 0.31 in energy to 25.32 in crude fibre (Table 1). Differences in the mean proximate composition between maize-ogi and different fortification products are presented in Table 2. All the proximate composition parameters were progressively increased with different fortification products except moisture and carbohydrate contents. The most affected by Kerstingiella geocarpa seed-substituted maize-ogi flours was crude protein which was increased between 21.0-61.1% with CV% of 38.49. Range of reduction of moisture and carbohydrate were 6.3-14.4 and 2.1-7.7%, respectively. The CV% was variously varied with a range of 27.27-72.23 (Table 2).
All the macro-minerals analyzed for (Ca, P, Mg, K and Na) recorded increased concentrations in the ogi flour with increased Kerstingiella geocarpa seed substitutions (Table 3). Calcium in conjunction with phosphorus, magnesium, vitamin A, C and D, chlorine and protein are all involved in bone formation (Fleck, 1976). Calcium is also important in blood clotting, muscle contraction and in certain enzymes in metabolic processes (Adeyeye and Fagbohun, 2005).
| Table 2: | Differences in the mean proximate composition between maize ogi and different fortified products |
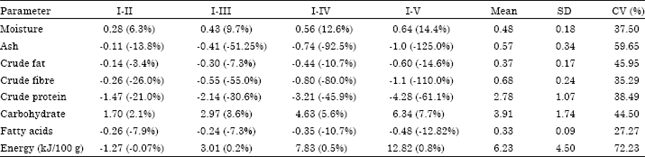 | |
I: 100% maize ogi; II: 90 Maize ogi: 10 KG; III: 80 maize ogi: 20 KG; IV: 70 maize ogi: 30 KG; V: 60 maize ogi: 40 KG, KG: Kerstingiella geocarpa | |
| Table 3: | Mean mineral composition (mg 100 g-1) of maize ogi fortified with Kerstingiella geocarpa seed flour |
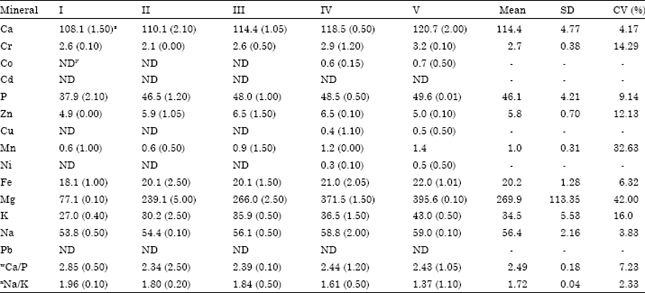 | |
zNumbers in parentheses are standard deviations of triplicate determinations, yND: Not detected; xNa: K: Sodium to potassium ratio; wCa: P: Calcium to phosphorus ratio, I: 100% maize ogi; II: 90 Maize ogi:10 KG; III: 80 maize ogi:20 KG; IV: 70 maize ogi:30 KG; V: 60 maize ogi :40 KG, KG: Kerstingiella geocarpa | |
Magnesium is an activator of many enzyme systems and maintains the electrical potential in nerves (Shills, 1973). Phosphorus assists calcium in many body reactions although it also has independent functions. Modern diets which are rich in animal proteins and phosphorus may promote the loss of calcium in the urine (Shills and Young, 1992). Among the micro-minerals, only Cr decreased with increased substitution at 90:10 ratio while others (Zn, Mn, Co, Cu, Ni and Fe) increased in concentration. It is interesting to note that harmful minerals such as lead and cadmium were not detected in the 100% maize ogi or fortification products The CV% levels of all the minerals were also relatively close with the highest found in Mg (42.00) (Table 3). Differences in the mean mineral composition between maize ogi and different Kerstingiella geocarpa substitutions showed that CV% ranged from 10.84 in P to 75.00 in Mn (Table 4). Overall, it could be concluded that the substitution of maize with Kerstingiella geocarpa seed in the production of ogi yielded products with improved mineral content. This is also substantiated by the increased ash content at all substitution levels (Table 1). Some workers (Adeyemi and Soluade, 1993; Enujiugha, 2006) also observed significant increase in ash and mineral contents in pawpaw-ogi and African oil bean-ogi, respectively. The Kerstingiella geocarpa seed is known to contain appreciable amounts of important minerals (Aremu et al., 2006b) and this is expected to reflect in any legume-based or supplemented food product. Food is considered good if Ca/P ratio is above one and poor if the ratio is less than 0.5 while Ca/P ratio above two helps to increase the absorption of calcium in the small intestine. The results of Ca/P ratios in ogi sample and fortified products (Table 3) were not only good but also gave an indication that they would help to increase the absorption of calcium in the small intestine.
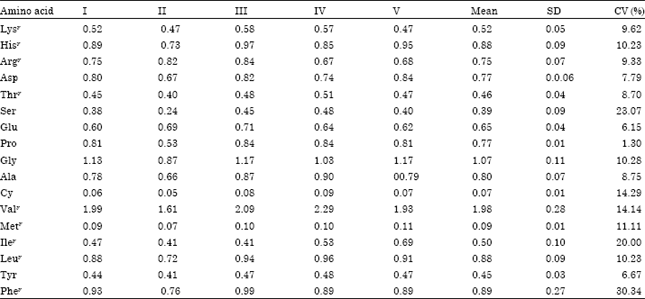
Aspartic acid and glutamic acid had the highest concentrations among the group of Amino Acids (AA) in the maize ogi and fortified products (Table 5), as is expected in legumes (Olaofe et al., 1994; Aremu et al., 2010). Leucine constituted the highest single Essential Amino Acid (EAA) in all the samples. The pattern of concentration of Leu was 70:30>80:30>60:40>100%>90:10 of maize ogi to Kerstingiella geocarpa substitution ratios. Tryptophan concentrations could not be determined.
| Table 4: | Differences in the mean mineral composition between maize ogi and different fortified products |
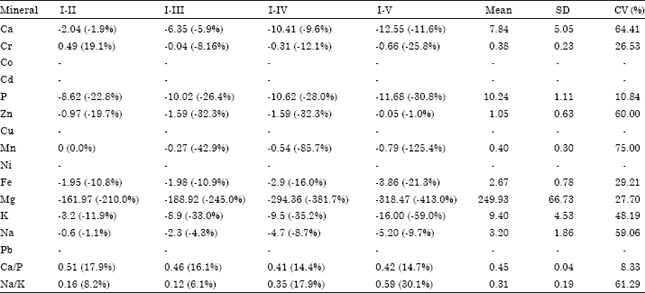 | |
I: 100% maize ogi; II: 90 Maize ogi:10 KG; III: 80 maize ogi:20 KG; IV: 70 maize ogi:30 KG; V: 60 maize ogi :40 KG, KG: Kerstingiella geocarpa | |
| Table 5: | Amino acid profiles of maize ogi fortified with Kerstingiella geocarpa seed flour (g/100 g-1 crude protein) |
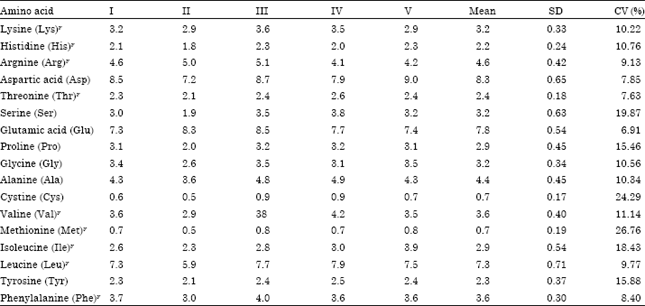 | |
yEssential amino acids, I: 100% maize ogi; II: 90 Maize ogi :10KG; III: 80 maize ogi :20KG; IV: 70 maize ogi :30KG; V: 60 maize ogi: 40 KG, KG: Kerstingiella geocarpa | |
CV% levels ranged from 6.91 in Glu to 26.76 in Met. Differences in the amino acid profiles between 100% maize ogi and 90:10, between 100% maize ogi and 80:20, between 100% maize ogi and 70:30 and between 100% maize ogi and 60:40 ratio substitution revealed that there was progressive increase of all the AA from 80:20 to 60:40 substitutions except His, Arg and Asp which had decrease of 4.2, 11.3 and 6.9%, respectively at 70:30 substitution ratio (Table 6). At 90:10 Kerstingiella geocarpa seed-substituted maize ogi flours all the AA concentration levels were reduced with the exception of Arg and Glu which had increase of 9.1 and 13.9%, respectively. The CV% was variously varied with a range of 10.64 in Arg to 134.38 in Pro. Highlights of the increases recorded in EAA were (in %): Lys (9.3-11.8), His (4.2-8.9), Arg (9.1-11.3), Thr (3.9-19.1), Val (3.1-15.3), Met (4.3-18.6), Ile (6.8-47.3), Leu (3.7-9.1) and Phe (4.0-6.7) (Table 6).
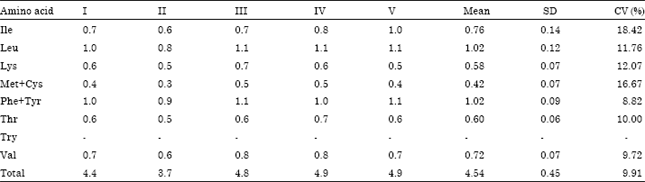
The concentrations of total AA (TAA), total non-essential AA (TNAA), total essential AA (TEAA) with His, essential aphatic AA (EAAA), essential aromatic AA (EArAA) and total sulphur AA (TSAA) of 100% maize ogi were 62.53, 32.37, 30.16, 16.49, 3.73 and 1.30 g 100 g-1 crude protein (cp), respectively (Table 7). Fortified samples had progressive increase in the concentration levels of TAA, TNEAA, TEAA, EAAA, EArAA and TSAA. The contents of TEAA of 30.16, 26.39, 32.56, 31.60 and 31.37 g 100 g-1 cp without tryptophan were close to the value for egg reference protein (56.6g 100 g-1 cp) (Paul et al., 1976); for soya bean, it is 44.4 g 100-1 cp (Adeyeye, 2010). The TAA here (54.56-68.01 g 100 g-1 cp) were close to the TAA in the bambara groundnut (70.8 g 100 g-1 cp) (Aremu et al., 2006a) and dehulled African yam beans (70.3-91.8 g 100 g-1) (Adeyeye, 1997). The contents of TSAA (0.96-1.66 g 100 g-1 cp) were lower than the 5.8 g 100 g-1 cp recommended for infants (FAO, WHO and UNU, 1985). The EArAA range suggested for ideal infant protein (6.8-11.8 g 100 g-1 cp) (FAO, WHO and UNU, 1985) has current values close to the minimum, i.e., 3.04-3.97 g 100 g-1 cp). The EArAA are precursors of epinephrine and thyroxin (Robinson, 1987). The percentage ratios of TEAA to TAA in the samples ranged from 47.88 to 48.37% which were well above the 39% considered to be adequate for ideal protein food for infants, 26% for children and 11% for adults (FAO, WHO and UNU, 1985).
| Table 6: | Differences in the mean amino acid composition between maize ogi and different fortified products |
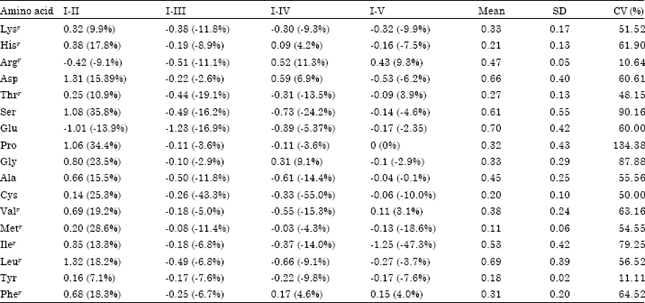 | |
yEssential amino acid, I: 100% maize ogi; II: 90 Maize ogi :10KG; III: 80 maize ogi :20KG; IV: 70 maize ogi :30 KG; V: 60 maize ogi: 40 KG, KG: Kerstingiella geocarpa | |
| Table 7: | Concentrations of essential, non-essential, acidic, neutral, sulphur, aromatic, etc. (g 100 g-1 crude protein) of maize ogi fortified with Kerstingiella geocarpa seed flour |
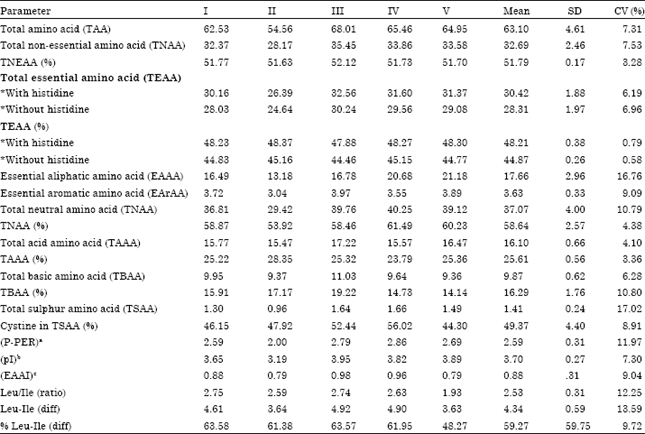 | |
a(P-PER): Calculated predicted protein efficiency ratio; b(pI): Calculated isoelectric point; c(EAAI): Essential amino acid index, I: 100% maize ogi; II: 90 Maize ogi: 10 KG; III: 80 maize ogi:20 KG; IV: 70 maize ogi:30 KG; V: 60 maize ogi:40 KG, KG: Kerstingiella geocarpa | |
The TEAA/TAA percentage contents were strongly comparable to that of egg (50%) (FAO/WHO, 1991) and 43.6% reported for pigeon pea flour (Oshodi et al., 1993), 43.8-44.4% reported for beach pea protein isolate (Chavan et al., 2001) and 40.6% reported for cashew nut (Aremu et al., 2006c). The P-PER values (Table 7) were higher than pigeon pea (1.82) and cowpea (1.21) (Oyarekua and Eleyinmi, 2004); sorghum ogi (0.27) and millet ogi (1.62) (Fennema, 1985). The presence of D-isomers also reduces the digestibility of the protein, because peptide bonds involving D residues are less easily hydrolysed in vivo than those containing only L residues. Moreover, certain D amino acids excert a toxic action, in proportion to the amount absorbed through the intestinal wall (Fennema, 1985). This elucidates a word of caution on the excessive consumption of maize ogi or its fortified products. A common feature of sorghum and maize is that the proteins of these grains contain a relatively high proportion of leucine. It was therefore suggested that an amino acid imbalance from excess leucine might be a factor in the development of pellagra (FAO, 1995). Clinical, biochemical and pathological observations in experiments conducted in humans and laboratory animals showed that high leucine in the diet impairs the metabolism of tryptophan and niacin and is responsible for niacin deficiency in sorghum eaters (Ghafoorunissa and Narasinga Rao, 1973). High leucine is also a factor contributing to the pellagragenic properties of maize (Belavady and Gopalan, 1969). These studies suggested that the leucine/isoleucine balance is more important than dietary excess of leucine alone in regulating the metabolism of tryptophan and niacin and hence the disease process. The present Leu/Ile ratios were low in values (1.93-2.75). The pI value range was 3.19-3.95. The pI of any organic matter is important when the protein isolate is to be prepared (Olaofe and Akintayo, 2000; Aremu and Ekunode, 2008). The essential AA index (EAAI) ranged from 0.79-0.98. EAAI is useful as a rapid tool to evaluate food formulations for protein quality, although it does not account for differences in protein quality due to various substitution levels or certain chemical reactions (Adeyeye, 2010). The EAAI for soy flour is 1.26 (Nielson, 2002) which is better than the current result.
The AA scores (AAS) of the samples based on white hen’s egg profile (Paul and Southgate, 1978) are shown in Table 8. The scores had values greater than 1.0 in Gly for all the samples except 90:10 substitution ratio and Val for all the samples.
| Table 8: | Amino acid scores of maize ogi fortified with Kerstingiella geocarpa seed flour based on white hen’s egg amino acid |
 | |
yEssential amino acid, I: 100% maize ogi; II: 90 Maize ogi:10 KG; III: 80 maize ogi:20 KG; IV: 70 maize ogi:30 KG; V: 60 maize ogi: 40 KG, KG: Kerstingiella geocarpa | |
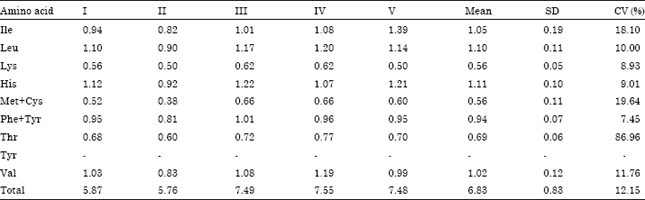
The CV% between AA levels for all the samples ranged between 1.30 in Pro to 30.34 in Phe (Table 8.). For the essential AA scores (EAAS) based on the provisional amino acid scoring pattern (FAO/WHO, 1973) the EAAS greater than 1.0 were Leu and Phe+Try for all the samples except 90:10 ratio. The limiting AA (LAA) for all the samples was Met+Cys. The FAO, WHO and UNU (1985) standards for pre-school children (2-5 years) were (g 100 g-1 protein): Leu (6.6), Phe+Tyr (6.3), Thr (3.4), Try (1.1), Val (3.5), Ile (2.8), Lys (5.8), Met+Cys (2.5), His (1.9) and total (33.9 with His) and 32.0 (no His). CV% between AA levels for all the samples ranged between 8.82 in Phe+Tyr to 18.42 in Ile (Table 9).
The EAAS based on these requirements showed that His had the highest score of 1.22 at 80:20 ratio (Table 10). Histidine is a semi-essential AA particularly useful for children growth. It is the precursor of histidine present in small quantities in cells. When allergens enter the tissues it is liberated in larger quantities and is responsible for nettle rash (Bingham, 1977). Ile is an EAA for both old and young. Maple Syrup Urine Disease is an Inborn Error of metabolism in which brain damage and early death can be avoided by a diet low in Ile and two other EAA, Leu and Val. Ile, Leu and Val had high scores in some samples in the current report.
| Table 9: | Amino acid scores of maize ogi fortified with Kerstingiella geocarpa seed flour based on FAO/WHO standards [13] |
 | |
I: 100% maize ogi; II: 90 Maize ogi:10 KG; III: 80 maize ogi:20 KG; IV: 70 maize ogi:30 KG; V: 60 maize ogi:40 KG, KG: Kerstingiella geocarpa | |
| Table 10: | Amino acid scores of maize ogi fortified with Kerstingiella geocarpa seed flour based on requirements of pre-school child (2-5 years) |
 | |
I: 100% maize ogi; II: 90 Maize ogi:10 KG; III: 80 maize ogi:20 KG; IV: 70 maize ogi:30 KG; V: 60 maize ogi:40 KG, KG: Kerstingiella geocarpa | |
REFERENCES
- Adeniji, A.O. and N.N. Potter, 1978. Properties of ogi powder made from normal fortified and opaque 2 corn. J. Food Sci., 43: 1571-1574.
CrossRef - Adeyemi, I.A. and E.O. Soluade, 1993. Development and quality evaluation of pawpaw-ogi. Plant Foods Human Nutr., 44: 213-220.
PubMedDirect Link - Adeyemi, I.A. and O. Beckkley, 1986. Effect of period of maize fermentation and souring on chemical properties and amylograph pasting viscosity of Ogi. J. Cereal Sci., 4: 353-360.
CrossRefDirect Link - Adeyemi, I.A., A.T. Osunsami and M.A.B. Fakorede, 1987. Effect of corn varieties on ogi quality. J. Food Sci., 52: 322-324.
CrossRef - Adeyeye, E.I., 2010. Effect of cooking and roasting on the amino acid composition of raw groundnut (Arachis hypogea) seeds. Acta Sci. Pol. Technol. Aliment, 9: 201-216.
Direct Link - Adeyeye, E.I. and E.D. Fagbohun, 2005. Proximate, mineral and phytate profiles of some selected spices found in Nigeria. Pak. J. Sci. Ind. Res., 48: 14-22.
Direct Link - Adeyeye, E.I. and M.O. Aremu, 2010. Comparative evaluation of the amino acid profile of the brain and eyes of guinea fowl (Numida meleagris) hen. Open Nutraceuticals J., 3: 220-226.
Direct Link - AOAC., 1995. Official Methods of Analysis. 16th Edn., Association of Official Analytical Chemists, Washington, DC., USA.
Direct Link - Aremu, C.Y., 1993. Nutrient composition of corn ogi prepared by a slightly modified traditional technique. Food Chem., 46: 231-233.
Direct Link - Aremu, M.O. and O.E. Ekunode, 2008. Nutritional evaluation and functional properties of Clarias lazera (African Catfish) from River Tammah in Nasarawa State, Nigeria. Am. J. Food Technol., 3: 264-274.
CrossRefDirect Link - Aremu, M.O., A. Olonisakin, D.A. Bako and P.C. Madu, 2006. Compositional studies and physicochemical characteristics of cashew nut (Anarcadium occidentale) flour. Pak. J. Nutr., 5: 328-333.
CrossRefDirect Link - Aremu, M.O., O. Olaofe and C.A. Orjioke, 2008. Proximate and amino acid composition of bambara groundnut (Vigna subterranean), kersting's groundnut (Kerstingiella geocarpa) and scarlet runner bean (Phaseolus coccineus) protein concentrates. La Rivista Italiana Delle Sostanze Grasse, 85: 128-134.
Direct Link - Aremu, M.O., O. Olaofe and T.E. Akintayo, 2006. A Comparative study on the chemical and amino acid composition of some Nigerian Under-utilized legume flours. Pak. J. Nutr., 5: 34-38.
CrossRefDirect Link - Aremu, M.O., O. Olafe, S.K. Basu, G. Abdulaeez and S.N. Acharya, 2010. Compositional study of differently processed cranberry bean (Phaseolus coccineus L.) seed flour. Can. J. Plant Sci., 90: 719-728.
Direct Link - Aremu, M.O., O. Olaofe, S.S. Audu and D.M. Ijalana, 2011. Biochemical evaluation of fermented white maize (Zea mays L.) blended with scarlet runner bean. The Open Nutraceuticals J., 46: 163-171.
Direct Link - Audu, S.S. and M.O. Aremu, 2011. Nutritional composition of raw and processed pinto bean (Phaseolus vulgaris L.). J. Food Agric. Environ., 9: 72-80.
Direct Link - Belavady, B. and C. Gopalan, 1969. The role of leucine in the pathogenesis of canine black tongue and pellagra. Lancet, 2: 956-957.
CrossRefDirect Link - Chavan, U.D., D.B. Mckenzie and F. Shahidi, 2001. Functional properties of protein isolates from beach pea (Lathyrus maritimus L.). Food Chem., 74: 177-187.
CrossRefDirect Link - Enujiugha, V.N., 2003. Nutrient changes during the fermentation of African oilbean (Pentaclethra macrophylla Benth) seeds. Pak. J. Nutr., 2: 320-323.
CrossRefDirect Link - Enujiugha, V.N., 2006. Supplementation of ogi, a maize based infant weaning food, with African oil bean (Pentaclethra macrophylla Benth) seed. J. Food, Agric and Environment, 42: 34-38.
Direct Link - FAO, 1995. Sorghum and Millets in Human Nutrition. Ser. No. 2, David Lubin Memorial Library Cataloguing in Publication Data, Rome, ISBN: 92-5-103381-1.
Direct Link - Fleck, H., 1976. Introduction to Nutrition. 3rd Edn., Macmillian Publishing Co. Inc., New York, ISBN: 9780023384301, Pages: 552.
Direct Link - Ghafoorunissa and B.S. Narasinga Rao, 1973. Effect of leucine on enzymes of the tryptophan niacin metabolic pathway in rat liver and kidney. Biochem. J., 134: 425-430.
Direct Link - Olaofe, O., F.O. Adeyemi and G.O. Adediran, 1994. Amino acid and mineral compositions and functional properties of some oil seeds. J. Agric. Food Chem., 42: 878-881.
Direct Link - Oshodi, A.A., O. Olaofe and G.M. Hall, 1993. Amino acid, fatty acid and mineral composition of pigeon pea (Cajanus cajan). Int. J. Food Sci. Nutr., 43: 187-191.
CrossRefDirect Link - Oyarekua, M.A. and A.F. Eleyinmi, 2004. Comparative evaluation of the nutritional quality of corn, sorghum and millet ogi prepared by modified traditional technique. J. Food Agric. Environ., 2: 94-99.
Direct Link - Steinke, F.H., E.E. Prescher and D.T. Hopkins, 1980. Nutritional evaluation (PER) of isolated soybean protein and combinations of food proteins. J. Food Sci., 45: 323-327.
CrossRefDirect Link
Adazebra Gloria Reply
it is an interesting piece of information, but i will like to know the other nutrients that can be found in kersting groundnut.
Matthew Olaleke AREMU
Fatty acid composition of kersting groundnut seed oils was determined. Essential fatty acids(oleic and linoleic) were found to be adequate.