
M.H. Tamzil
Faculty of Animal Science, University of Mataram, Jalan Majapahit No. 62 Mataram, Lombok 83125, Indonesia
LiveDNA: 62.18907
B. Indarsih
Faculty of Animal Science, University of Mataram, Jalan Majapahit No. 62 Mataram, Lombok 83125, Indonesia
N.K.D. Haryani
Faculty of Animal Science, University of Mataram, Jalan Majapahit No. 62 Mataram, Lombok 83125, Indonesia
M. Muhsinin
Faculty of Animal Science, University of Mataram, Jalan Majapahit No. 62 Mataram, Lombok 83125, Indonesia
International Journal of Poultry Science
Year: 2021 | Volume: 20 | Issue: 3 | Page No.: 123-128


ABSTRACT
Background and Objective: Pituitary-specific Transcription Factor polymorphism gene of livestock can be used as a basis for selection programs. A study was conducted to categorize 6 Pituitary-Specific Transcription Factor (Pit-1|TasI) polymorphism genes and their associations with body weight of Super kampung chicken. Materials and Methods: Day-old 112 Super Kampung chickens were used in this study. Chicks were kept in an open house with slat floor until the age of 13 weeks. Feed and drinking water were provided ad libitum. Blood sample was collected with a syringe (3 mL) from the brachial vein and Polymerase Chain Reaction-Restriction Fragment Length Polymorphism (PCR-RFLP) was used for analysis. Results: The results showed that the Pit-1 genes were polymorphic in Super Kampung chickens. There were two alleles, namely C and T, each with a rate of 0.746 and 0.254, respectively and three genotypes, namely CC, CT and TT, each with a frequency of 0.598, 0.295 and 0.107, respectively. The Pit-1 gene in the Super kampung chicken population was not in equilibrium. There were correlations between the genotype of fragment genes Pit-1|TasI exon 6 and the body weight of the Super Kampung chickens at 13 weeks of age. The highest body weight was found in the CC genotype. Conclusion: The CC genotype of the Pit-1 gene can be used as a growth marker in Super Kampung chickens.
PDF Abstract XML References Citation
Copyright: © 2021. This is an open access article distributed under the terms of the creative commons attribution License, which permits unrestricted use, distribution and reproduction in any medium, provided the original author and source are credited.
How to cite this article
M.H. Tamzil, B. Indarsih, N.K.D. Haryani and M. Muhsinin, 2021. Pituitary-Specific Transcription Factor Gene Polymorphism and its Associations with Body Weight of Super Kampung Chickens Aged Thirteen Weeks. International Journal of Poultry Science, 20: 123-128.
DOI: 10.3923/ijps.2021.123.128
URL: https://scialert.net/abstract/?doi=ijps.2021.123.128
DOI: 10.3923/ijps.2021.123.128
URL: https://scialert.net/abstract/?doi=ijps.2021.123.128
INTRODUCTION
Super Kampung chickens are a cross-breeds between male Bangkok chicken (local Indonesian chicken) and female layer chicken of Isa Brown strain. These crossbred chickens have been widely bred to meet the demand of raw material for a traditional cuisine. The crossbred chickens have a high phenotypic polymorphism (feather color, skin color, shank color, physical shape and body weight) and are predicted to have high genetic polymorphism as well1. The high polymorphism provides opportunities for selection of poultry.
The Pituitary Specific Transcription Factor-1 (Pit-1) gene is one of the common markers used for selection of poultries2-4. Its functions are to bind and reactivate growth hormone (GH), prolactin (Prl) and thyroid-β-stimulating hormone (TSH-β) promoters5,6. The Pit-1 gene is responsible for the development of the anterior hypophysis of the pituitary gland7, induces differentiation of liver progenitor cells for the production of prolactin (Prl)8, as well as delaying adrenarche in humans9.
Previous scientific experiments found that the Pit-1 polymorphism gene is related to growth, carcass and fatty characters in pigs10-13, cattle10,14 and broilers4,15. The Pit-1 of the AA genotype of rs80904061 on intron 4 had lower feed intake than those of the AA genotype in pigs13. The Pit-I of the GG genotype of rs13687126 showed higher body weight gain compared to the AG genotype at 49 days. Whilst, at 70 days, birds with the TT genotype of rs13687128 gain more weight with lower feed conversion ratio compared to the CT and CC genotypes.
On the other hand, at 70 days, the Pit-1 of the AA genotype of rs13905622 is able to grow faster and utilize feed more efficiently compared to the AT and TT genotypes. Therefore, it is observed that the Pit-1 gene polymorphism could be used as a foundation in chicken breeding programs4. This research was conducted to obtain the Pit-1 gene genotype which can be practiced as growth markers in Super Kampung chickens.
MATERIALS AND METHODS
Animals and treatments: A total of 112 a day old Super Kampung chickens were used in this study. The chickens were kept in an open cage with a slat floor at the Teaching Farm of Animal Science Faculty, Mataram University, Lingsar, West Lombok, Indonesia. The birds have free access to feed and drinking water. Body weight and feed intake were recorded weekly.
Data collection: Blood sample (400 μL) was collected from the brachial vein using a 3 mL syringe. The blood sampling area was cleaned using 70% alcohol with cotton. The blood sample was put into the Eppendorf tubes that had been filled with 1.5-2.2 mg mL–1 of EDTA (Ethylene Diamine Tetra-acetic Acid) as an anticoagulant. The sample was stored at 4°C.
DNA extraction: DNA was extracted using the Genomic DNA Mini Kit produced by Geneaid. Three hundred microliters (300 μL) of blood sample were put into a 1.5 mL tube. RBC Lysis Buffer was then added into the tube with 3× volume of the samples using inversion method. The mixture was then incubated for 10 min at room temperature. The samples were centrifuged for 5 min at 3000 rpm and then the supernatant was removed. One hundred microliters (100 μL) of RBC Lysis Buffer were then added. The next step was Cell lysis (stage-1) process and conducted by adding 200 GB of buffer, followed by shaking and incubation at 60°C for 10 min to clarify the appearance of the sample. During incubation, the tube was turned over every 3 min. Then, 200 μL of buffer/sample was prepared for step 4. In stage 2 (DNA Binding), 200 μL of absolute ethanol was added and shaken for 10 sec and LD column was placed in a 2 mL collection tube. In the next step, the sample mixture was transferred to GD column and centrifuged at 14000-16000 rpm for 5 min. After that, 2 mL collection tube was removed and then GD column was placed in a new 2 mL collection tube. In stage 3 (washing), 400 μL of W1 Buffer was added into the GD column and centrifuged at 14000-16000 rpm for 30-60 sec. Next, the GD column was put back into the 2 mL collection tube. Subsequently, 600 μL of wash buffer was added into the GD column. The column was then centrifuged at 14000-16000 rpm for 30-60 sec. LD column was put back into the 2 mL collection tube. Next, the tube was centrifuged at 14000-16000 rpm for 3 min. At stage 4 (DNA elution), the GD column was transferred to a 1.5 mL tube. One hundred microliters (100 μL) of the heated elusion buffer was added and then centrifuged at 14000-16000 rpm for 30 seconds. DNA samples were stored at -20°C for further use.
PCR amplification: DNA samples obtained from each chicken were used as templates to amplify gene loci using PCR with primer of Forward 5'TGGGAAGAACAGTTTATGGC3' and Reverse 5'CTGGAGTCGTTGAAGTAAGCG3' (483bp)15. Amplification of DNA was carried out using a total volume of 15 μL, comprising of 1 μL of DNA, 7 μL of 5× MyTaq Red Reaction Buffer, 0.3 μL of primer, 1 μL of MyTaq HS Red DNA Polymerase and 5.7 μL of ddH2O. The mixture of reactant was put into a 1.5 μL tube to be standardized and then allocated to each tube having DNA samples. The tubes were then put into a PCR machine. Amplification of DNA was done using PCR machine of Applied Biosystem at 95°C for 5 min, 35 rotation for denaturation at 95°C for 10 seconds, annealing at 60°C for 20 sec and elongation at 72°C for 30 sec, then continued with the final elongation stage at 72°C for 5 min in one cycle. PCR products were electrophoresed using 1.5% agarose gel.
RFLP analysis: Product of amplification of the Pit-1 gene in exon 6 was cut using the TasI restriction enzyme. Five μl of PCR products was allocated into a 0.5 mL tube filled with 0.9 μL of DW, 0.4 μL of restriction enzymes and buffered 0.7 μL. The mixture was incubated at 37°C for approximately 16 h.
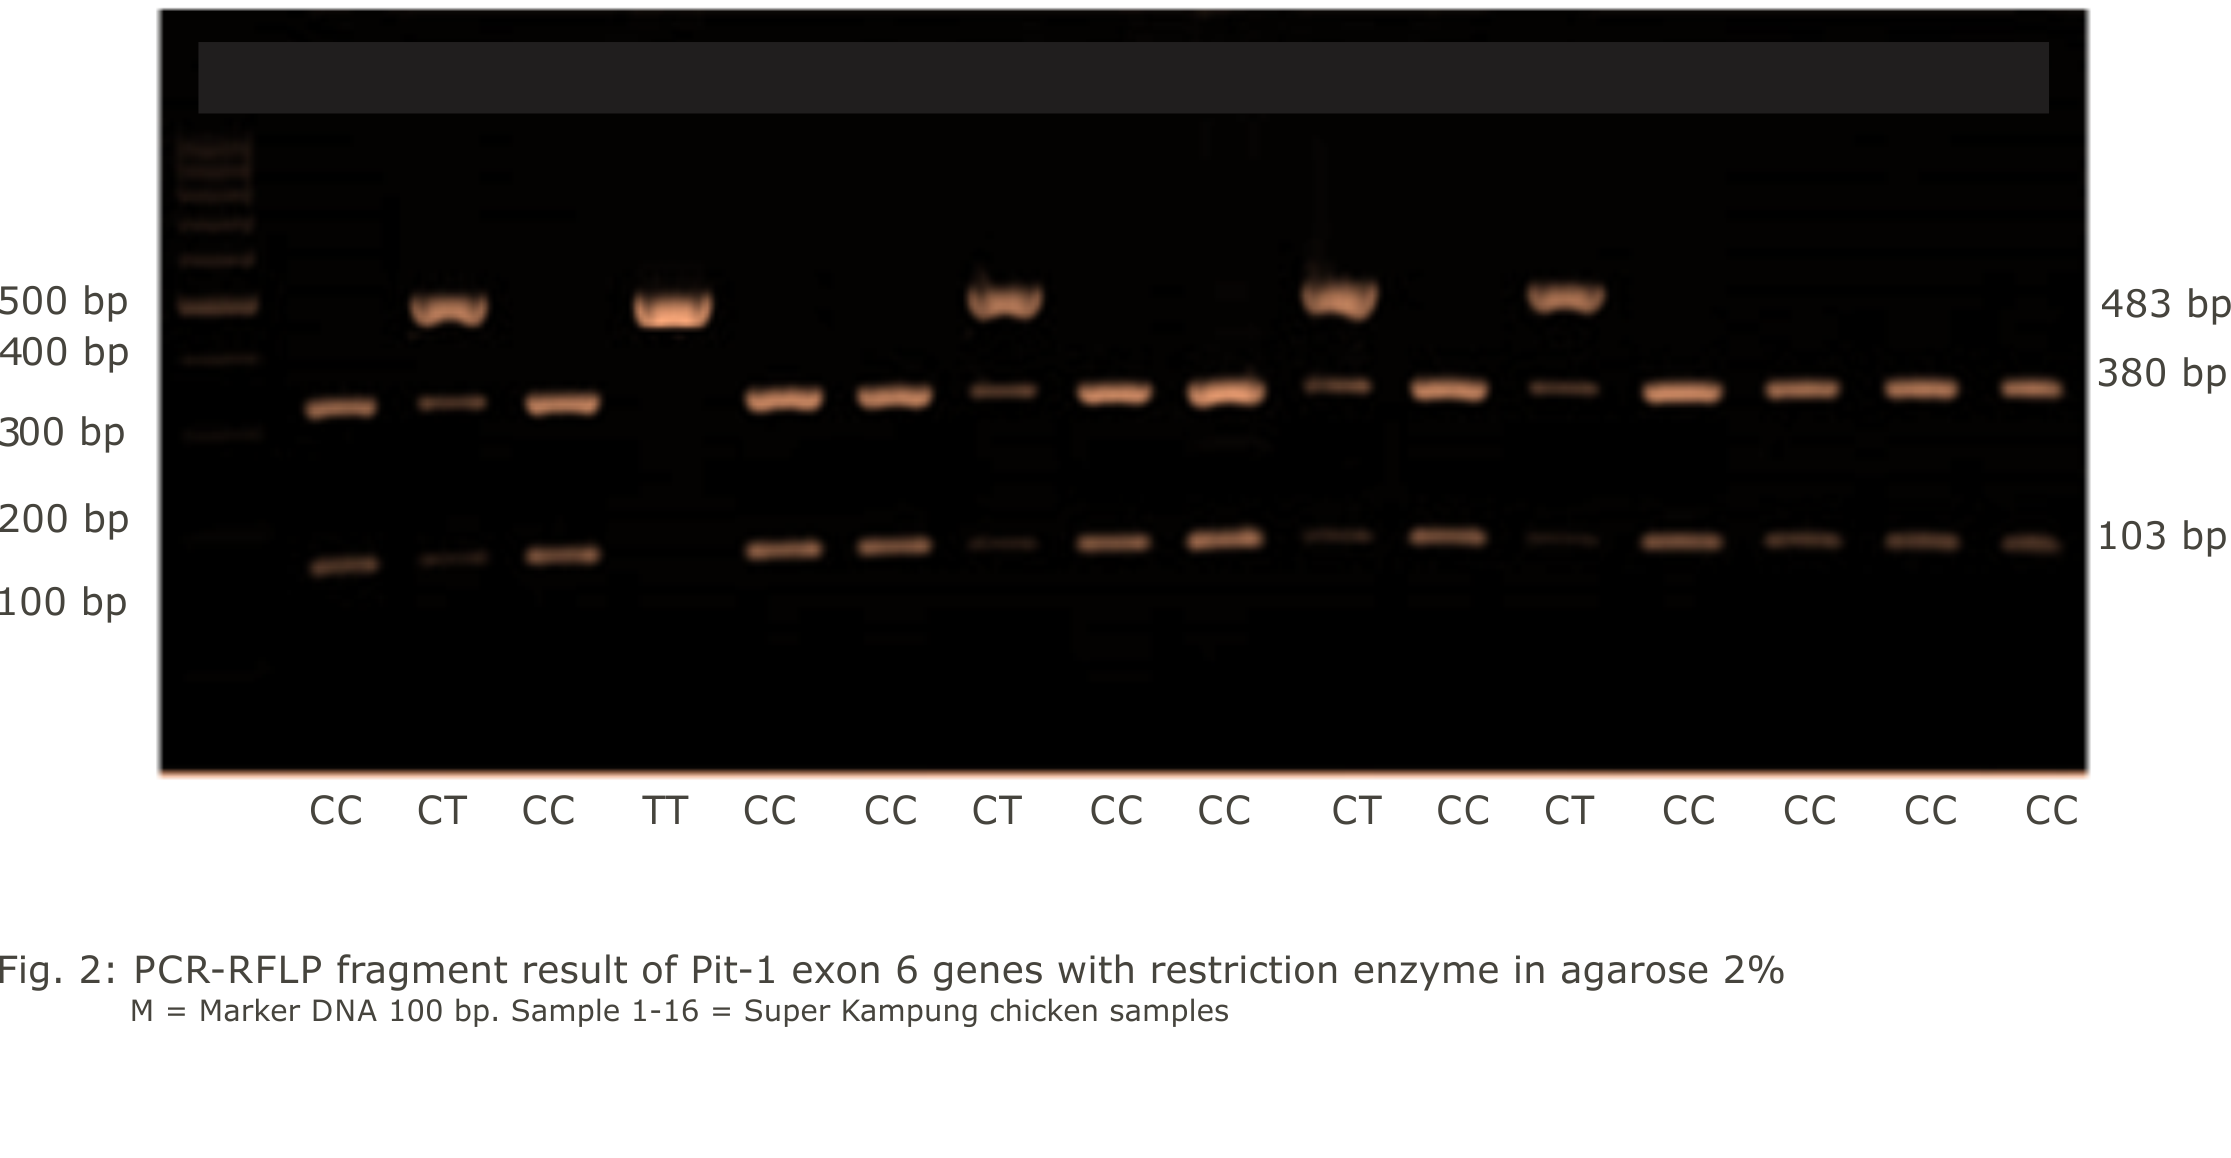
Electrophoresis of PCR-RFLP products: Electrophoresis of the PCR-RFLP gene product Pit-1 was conducted using 2% agarose gel. Five microliters (5 μL) of PCR-RFLP products were put into gel wells. Five microliters (5 μL) of marker DNA 100 bp was used as a marker. The gel was electrified at 100 V for 30 min. After finishing electrophoresis, agarose gel was visualized using ultraviolet light in the UV Transilluminator machine.
Determination of the Pit-1 genotype: The exon 6 Pit-1 gene fragment genotype was C allele, which had no cutting site indicated by one fragment whose length is the same as the length of PCR product of 483 bp. On the other hand, T allele has the TasI restricted enzyme site (|AATT) and was shown by two fragments of 380 bp and 103 bp respectively (Fig. 1).
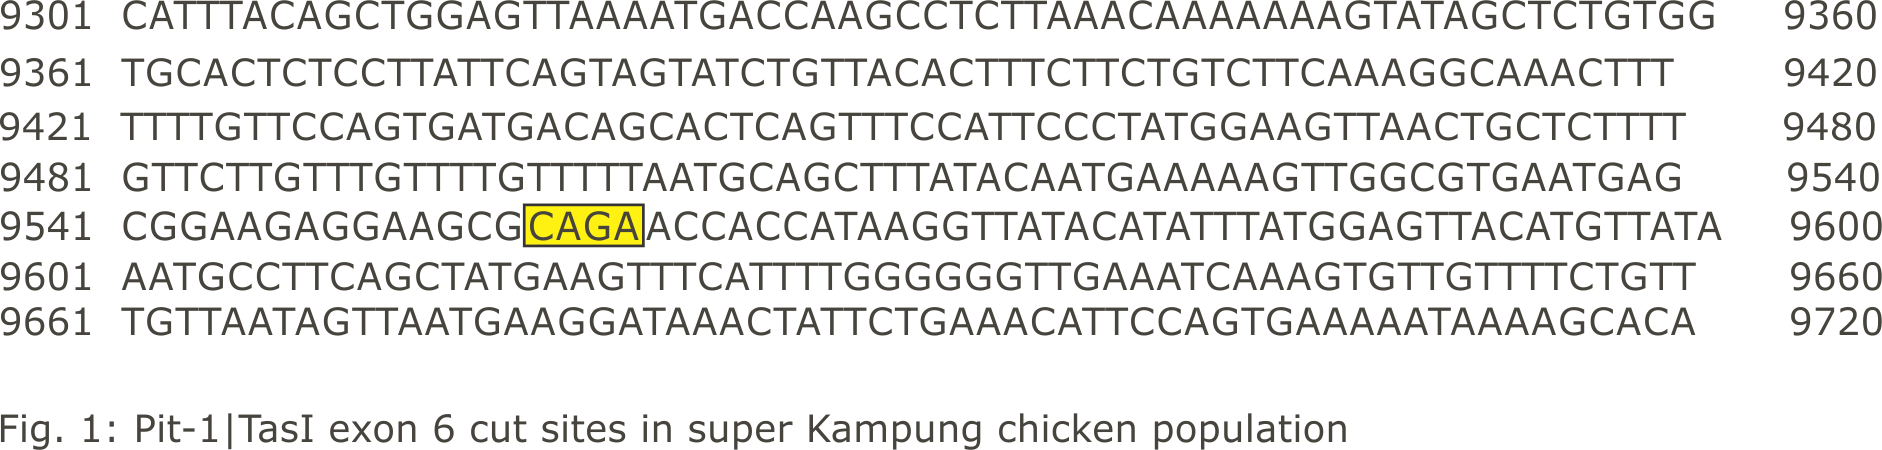 |
Data analysis: Allele frequencies and genotypes were calculated using Nei and Kumar16 formula. Estimated frequency of heterozygosity observations (Ho) was calculated using Weir17 formula, while the expected heterozygosity values (He) were calculated using the Nei and Kumar16 formula. Hardy-Weinberg equilibrium was calculated using Chi-Square18, while the free degree of Hardy-Weinberg equilibrium test was conducted using the method as described by Allendorf et al.19. The associations between the Pit-1 genotype and body weight were calculated with the help of the GLM procedure of SAS version 9.120.
RESULTS AND DISCUSSION
Restriction Fragment Length Polymorphism (RFLP) analysis using the TasI restriction enzyme against the fragment of Pit-1 exon 6 gene obtained three kinds of fragments (Fig. 2). Fragments that were not truncated by the TasI enzyme (483 bp) were TT genotypes, while the truncated fragments (380 and 103 bp) were CC genotypes and combined fragments (heterozygous) (483, 380 and 103 bp) were CT genotypes.
Based on genotype identification, C and T alleles were detected in the Pit-1 gene fragment in exon 6 with frequencies of 0.746 and 0.254, respectively. Homozygous (CC or TT) genotype means that both parents contribute the same gene (allele) and indicated that the chickens received different gene combinations from both parents.
The analysis of the genotype frequency of Pit-1|TasI exon 6 genes for Super Kampung chickens are presented in Fig. 3. The genotype proportion of Pit-1 exon 11 genes in all of the studied Super Kampung chicken populations showed that the frequency of CC genotype is the highest compared to those of CT and TT genotypes. This is attributed to the high frequency of C alleles in the entire Super Kampung chicken population. A similar result was obtained for White Recessive Rock and Chinese Xinghua chickens which showed the high CC genotype frequency of Pit-1 genes and low TT genotype frequency16.
Moreover, the fragments of Pit-1|TasI exon 6 gene in Super Kampung chickens were polymorphic and three types of genotype were found in each gene fragment and the allele frequency was more than 0.0116,19. The high frequency of allele C gene Pit-1|TasI exon 6 in the Super Kampung chicken population was due to the fact that the chickens were the cross-breed of Bangkok chicken (males-Indonesian local chickens) and exotic chickens (laying hen of Isa Brown strains)21.
Analysis of the observed heterozygosity values (Ho), expected heterozygosity values (He) and the chi-square test (χ2) of Pit-1|TasI exon 6 genes for Super Kampung chickens are presented in Table 1. Heterozygosity values were the average percentage of heterozygous loci per individual or the average percentage of heterozygous individuals in the population16. Genetic polymorphism of a population can be quantitated by using heterozygosity values and can be used to assist selection programs22.
High heterozygosity values indicate high genetic polymorphism within a population and vice versa. In the locus of Pit-1|TasI exon 6 of Super Kampung chicken, it was found that the value of Ho was higher than the value of He. A great dissimilarity between Ho and He values can be implemented as an indicator of genotype difference in the analyzed Super Kampung chicken population23.
Chi-square test (χ2) indicate that the genotype frequency of the fragment Pit-1|TasI exon 6 gene of Super Kampung chickens deviates from the Hardy-Weinberg balance. A balanced population is characterized by combining gametes randomly in a great population, leading constant frequencies of genotype and allele from generation to generation19. In a great population, alteration from one generation to the next generation do not occur when selection, migration, mutation and genetic drift are not found20.
The association analysis between the genotype of the fragment Pit-1|TasI exon 6 gene and the body weight of Super Kampung chickens at 13 weeks of age are presented in Table 2.
Body weight of Super Kampung chickens having CC genotype was heavier than those of having CT and TT genotypes (p>0.05) (Table 2). This means that there is an association between the polymorphism of the Pit-1 gene and body weight of Super Kampung chickens. The results of this study enrich the existing knowledge regarding the association between the Pit-1 gene of several livestock and their body weights. Results of the present study are in consonance with Hoseinzadeh et al.14 who worked on Holstein cattle, pigs13 and chickens15 and reported that the Pit-1 gene was polymorphic and strongly associated with body weight. Similar result was also reported by Jin et al.4, who found that the Single-Nucleotide Polymorphism rs13687126 Pit-1 gene is strongly associated with the increased rate of body weight and feed consumption at 70 days. It was further found that individuals with major genotype (GG) at rs13687126 and rs13687128 produced higher body weight compared to heterozygote (GT) and minor genotype (TT) genotypes.
CONCLUSION
The Pit-1 gene in Super Kampung chicken population was polymorphic with C and T alleles and CC, CT and TT genotypes. The highest allele frequency was for C, while the highest genotype frequency was for CC. The Pit-1 gene in Super Kampung chicken populations was not in equilibrium. The Pit-1 gene was strongly associated with the body weight of the Super Kampung chickens. The CC genotype has the highest body weight. Therefore, the CC genotype can be an effective marker for the growth of Super Kampung chickens.
ACKNOWLEDGMENTS
The authors would like to thank and appreciate Research and Community Service Center of Mataram University for the financial support for the completion of this study as outlined in the contract No. 2838H/UN18.L1/PP/2019.
REFERENCES
- Lapihu, Y.L., F.M.S. Telupere and H. Sutedjo, 2019. Kajian fenotip dan genetik performa pertumbuhan dari persilangan ayam lokal dengan ayam ras petelur isa brown. J. Sain Peternakan Indonesia, 14: 298-305.
CrossRefDirect Link - Zhang, D.X., Z.Q. Xu, J. He, C.L. Ji, Y. Zhang and X.Q. Zhang, 2015. Polymorphisms in the 5'-flanking regions of the GH, PRL, and Pit-1 genes with Muscovy duck egg production. J. Anim. Sci., 93: 28-34.
CrossRefDirect Link - Chang, M.T., Y.S. Cheng and M.C. Huang, 2012. The SNP genotypes of growth hormone gene associated with reproductive traits in Tsaiya ducks. Reprod. Domestic Anim., 47: 568-573.
CrossRefDirect Link - Jin, S., T. He, L. Yang, Y. Tong, X. Chen and Z. Geng, 2018. Association of polymorphisms in Pit-1 gene with growth and feed efficiency in meat-type chickens. Asian-Australas. J. Anim. Sci., 31: 1685-1690.
CrossRefDirect Link - Cohen, L.E., F.E. Wondisford and S. Radovick, 1997. Role of Pit-1 in the gene expression of growth hormone, prolactin, and thyrotropin. Endocrinol. Metab. Clin. N. Am., 25: 523-540.
CrossRefDirect Link - Miyai, S., S. Yoshimura, Y. Iwasaki, S. Takekoshi, R.V. Lloyd and R.Y. Osamura, 2005. Induction of GH, PRL, and TSHβ mRNA by transfection of Pit-1 in a human pituitary adenoma-derived cell line. Cell Tissue Res., 322: 269-277.
CrossRefPubMedDirect Link - Li, S., E.B. Crenshaw III, E.J. Rawson, D.M. Simmons, L.W. Swanson and M.G. Rosenfeld, 1990. Dwarf locus mutants lacking three pituitary cell types results from mutations in the POU-domain gene Pit-1. Nature, 347: 528-533.
CrossRefDirect Link - Lee, E.J., T. Russell, L. Hurley and J.L. Jameson, 2005. Pituitary transcription factor-1 induces transient differentiation of adult hepatic stem cells into prolactin-producing cells in vivo. Mol. Endocrinol., 19: 964-971.
CrossRefDirect Link - Taha, D., P.E. Mullis, L. Ibanez and F. De Zegher, 2005. Absent or delayed adrenarche in Pit-1/POU1F1 deficiency. Hormone Res. Paediatrics, 64: 175-179.
CrossRefDirect Link - Zhao, Q., M.E. Davis and H.C. Hines, 2004. Associations of polymorphisms in the Pit-1 gene with growth and carcass traits in Angus beef cattle. J. Anim. Sci., 82: 2229-2233.
CrossRefDirect Link - Song, C., B. Gao, Y. Teng, X. Wang and Z. Wang et al., 2005. MspI polymorphisms in the 3rd intron of the swine POU1F1 gene and their associations with growth performance. J. Applied Genet., 46: 285-289.
PubMedDirect Link - Franco, M.M., R.C. Antunes, H.D. Silva and L.R. Goulart, 2005. Association of PIT1, GH and GHRH polymorphisms with performance and carcass traits in Landrace pigs. J. Applied Genet., 46: 195-200.
PubMedDirect Link - Piórkowska, K., K. Ropka-Molik, M. Oczkowicz, M. Różycki and K. Żukowski, 2013. Association study of PIT1 and GHRH SNPs with economically important traits in pigs of three breeds reared in Poland. Anim. Sci. Pap. Rep., 31: 303-314.
Direct Link - Hoseinzadeh, Z.E., M.R. Mohammadabadi, A.K. Esmailizadeh and A. Khezri, 2015. Association of PIT1 gene and milk protein percentage in Holstein cattle. J. Livestock Sci. Technol., 3: 40-49.
CrossRefDirect Link - Nie, Q.H., M.X. Fang, L. Xie, M. Zhou and Z. Liang et al., 2008. The PIT1 gene polymorphisms were associated with chicken growth traits. BMC Genet., Vol. 9.
CrossRef - Nei, M. and S. Kumar, 2000. Molecular Evolution and Phylogenetics. Oxford University Press, United Kingdom, ISBN-13: 9780195350517, Pages: 352.
Direct Link - Weir, B.S., 1996. Genetic Data Analysis II: Methods for Discrete Population Genetic Data. 2nd Edn., Sinauer Association, Sunderland, Massachusetts, USA Pages: 431.
CrossRefDirect Link - Hartl, D.L. and A.G. Clark, 1997. Principles of Population Genetics. 4th Edn., Sinauer Associates, Inc., Sunderland, Massachusetts, Pages: 628.
Direct Link - Allendorf, F.W., G. Luikart and S.N. Aitken, 2013. Conservation and the Genetics of Populations. 2nd Edn., Wiley-Blackwell Publishing, UK., ISBN-13: 978-0470671450, Pages: 624.
Direct Link - Marson, E.P., J.B. Ferraz, F.V. Meirelles, J.C. Balieiro, J.P. Eler, L.G. Figueiredo and G.B. Mourão, 2005. Genetic characterization of European-Zebu composite bovine using RFLP markers. Genet. Mol. Res., 4: 496-505.
Direct Link - Tambasco, D.D., C.C.P. Paz, M.D. Tambasco-Studart, A.P. Pereira and M.M. Alencar et al., 2003. Candidate genes for growth traits in beef cattle crosses Bos taurus × Bos indicus. J. Anim. Breed. Genet., 120: 51-56.
CrossRefDirect Link