
M.M. Mahadzir
School of Mechanical Engineering, Universiti Sains Malaysia Eng. Campus, Pulau Pinang, Malaysia
Z.A. Zainal
School of Mechanical Engineering, Universiti Sains Malaysia Eng. Campus, Pulau Pinang, Malaysia
M. Iqbal
School of Mechanical Engineering, Universiti Sains Malaysia Eng. Campus, Pulau Pinang, Malaysia
S.N. Soid
School of Mechanical Engineering, Universiti Sains Malaysia Eng. Campus, Pulau Pinang, Malaysia
Journal of Applied Sciences
Year: 2010 | Volume: 10 | Issue: 9 | Page No.: 745-751


ABSTRACT
The interest in biomass technology has got a lot of attention due to the increase in fuel prices and issues like global warming. Producer gas as a alternative fuel, produced from biomass gasification process can be used to generate power and electricity. However, in air blown gasification, the producer gas produced has Low Calorific Value (LCV) about 4-6 MJ Nm-3 with CO2 content around 10-20% by volume. To increase the LCV, the used of calcium oxide, CaO as sorbent to absorb CO2 in the producer gas can make biomass technology more viable. In the present study, the aim is to study the fluidization of the bed in terms of the bed expansion and the pressure drop of the 1000 μm CaO-sand mixtures at different percentages, the air volume flow rate and pressurize air intake in the cold model experiment. The behaviors of 1000 μm CaO-sand mixtures have been conducted in a Small Bubbling Fluidized Bed (SBFB). The results show that the decrease of the CaO percentages from 70, 60, 50 to 40, will increase the pressure drop (ΔP) in the SBFB under constant pressure of 2, 3, 4, 5 and 6 bars. The bed expansion height also increased under all air pressures except at the low superficial flow velocity less than 0.06 m sec-1 at 2, 3, 4, 5 bars (70, 60% CaO mixture), when the air volume flow rate increased (in term of superficial flow velocities 0.020 to 0.215 m sec-1). The conclusion has been determined where the CaO percentages of 50 and 40 were found to have a good fluidization in the range of 15-55 L min-1 for all pressurize air compressors supply (2, 3, 4, 5 and 6 bars) when tested in a SBFB.
PDF Abstract XML References Citation
How to cite this article
M.M. Mahadzir, Z.A. Zainal, M. Iqbal and S.N. Soid, 2010. Characteristics on Fluidization Behaviors of 1000 μm Cao-Sand Mixture by Varying the Percentage of CaO, Air Flow Rate and Pressure. Journal of Applied Sciences, 10: 745-751.
DOI: 10.3923/jas.2010.745.751
URL: https://scialert.net/abstract/?doi=jas.2010.745.751
DOI: 10.3923/jas.2010.745.751
URL: https://scialert.net/abstract/?doi=jas.2010.745.751
INTRODUCTION
Energy is the most important subject in our life. Currently, the interest in biomass technology has got a lot of attention due to the increase in fuel prices and issues like global warming. Biomass is known as a renewable and carbon neutral energy resource that includes energy crops, agricultural wastes, animal wastes, municipal solid wastes and forestry wastes (McKendry, 2002a). Biomass gasification is technology to produce low to medium gaseous fuel gases. It is defined as the thermal decomposition of biomass in the present of limited oxygen to produce a gas known as producer gas. The producer gas consists of Carbon monoxide (CO), Hydrogen (H2), Methane (CH4), Carbon dioxide (CO2) and Nitrogen (N2) (McKendry, 2002c). It can be utilized in internal combustion engines or coupled to turbines to generate power.
The producer gas has Low Calorific Value (LCV) of about 4-6 MJ Nm-3 (Graham and Huffman, 1981; Jorapur and Rajvanshi, 1995; McKendry, 2002b; Rezaiyan and Nichol, 2005) because CO2 is diluents as non reactive produce about 10-20% by volume (Hollingdale et al., 1988; Walawender et al., 1985; Munoz et al., 2000; Sridhar et al., 2001; Zainal et al., 2002; Dogru et al., 2002; Uma et al., 2004). The LCV of the producer gas is depend on the particles size distribution of the biomass material, biomass fuel composition, moisture content, volatile matter, ash content and heating value (Yusof et al., 2008; Miskam et al., 2009). Nowadays, the used of the mineral called calcium oxide, CaO as calcium based sorbent to absorb CO2 in the producer gas can enhance the quality of the producer gas. Therefore in the last five years, the numbers of CO2 sorbents have been intensively investigated in the biomass technology fields (Guoxin and Hao, 2009; Florin and Harris, 2008; Mahishi and Goswami, 2007; Hanaoka et al., 2005) because of their low cost, abundance and availability.
The CaCO3 must first undergo a calcination process to release the CO2 at a temperature of 800-900°C converting into CaO and than an absorption process to absorb CO2 at reaction temperature around 600-700°C to reform to CaCO3. The concept is based on the carbonation/calcination loop using the reversible reaction used by Shimizu et al. (1999) and Stefan et al. (2009):
| (1) |
Although, the researches on the CO2 absorption have been widely studied in the last few decades, however the focused is only the use of calcium based sorbents either in term of CaCO3 or CaO in a reactor (Abanades et al., 2005; Grasa and Abanades, 2007; Grasa et al., 2008; Chen et al., 2007; Abanedes, 2002; Salvador et al., 2003). The study done by the researchers so far none have used the CaO-sand mixture as a bed material for the carbonation-calcinations process to absorb and release the CO2. In the present study, the behaviors of 1000 μm CaO-sand mixtures in the cold model experiment have been conducted. The purpose of this work is to study the fluidization of the bed in terms of the bed expansion and the pressure drop of the 1000 μm CaO-sand mixtures at different percentages in the cold model experiment. The use of sand is due to its good fluidization characteristics compared to the calcium based sorbents alone. In order to gain more information about the behaviors of CaO-sand mixtures, the effect of the air volume flow rate and pressurize air intake were investigated experimentally.
MATERIALS AND METHODS
Cold model experiments in a Small Bubbling Fluidized Bed (SBFB) were conducted using compressed air.
Figure 1 and 2 show the cold model experimental setup. The SBFB consists of a nozzle distributor plate and was supported on a stand. The main bed was made from transparent perspex. The overall height of the SBFB is 877.5 mm. The main bed has an inner diameter of 74 and 600 mm height. The nozzle distributor plate has five small nozzles that protrude up from the surface of the plate. Each nozzle has four holes of 1.6 mm diameter to allow gas to flow. The distributor plate was made from stainless steel. Figure 3 shows the 3-D diagram of the nozzle distributor plate.
The SBFB is connected to a 2.5 hp air compressor model HD47C to provide a compressed air flow and a bag filter to capture any of the bed material leaving the reactor.
 | |
| Fig. 1: | Schematic diagram of the experimental setup |
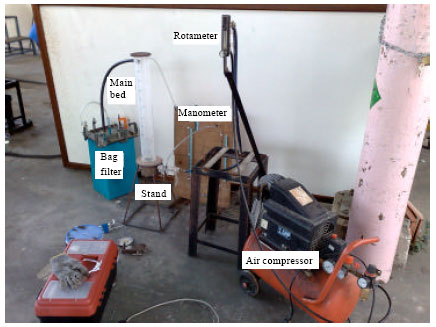 | |
| Fig. 2: | Photograph of the cold model experimental setup |
A simple U-tube manometer was used to determine the pressure drop of the material. Figure 4 shows the 2-D design of the small bubbling fluidized bed.
The 1000 μm of CaO mixed with 350 μm sand was used as the bed material. These particles sizes were sieved using an Endecott’s multi-layer test sieve shaker. The 350 μm sand particles size has been selected in this experimental because according to Geldart (1973) and Yates (1983), the particles size of sand in the range of 150-500 μm (the Group B powders) gives well fluidization. In the experiment, for each run, 240 g constant weight of CaO was used and mixed with 226, 421, 496 and 808 g of sand to obtain the CaO-sand mixture percentages. The experiment started when the mixtures of 240 and 226 g were put into the SBFB. Then the air compressor was set to 2 bar using pressure regulator and the air flow in term of the volume flow rate of 5 L min-1 was passed to the SBFB controlled by a rotameter. During the experiment the fluidization behaviors in term of bed expansion height and the pressure drop inside the SBFB were recorded. Some of the fine particles found in the bag filter was weighed and recorded at the end of the experiment.
 | |
| Fig. 3: | 3-D diagram of the nozzle distributor plate |
 | |
| Fig. 4: | The design of the SBFB. All dimensions in mm |
The experiment was repeated at different CaO mixture percentages (70, 60, 50, 40%), air volume flow rate (5, 15, 25, 35, 45, 55 L min-1) and air intake pressure (2, 3, 4, 5, 6 bar).
RESULT AND DISCUSSION
Table 1 shows the expected minimum fluidization velocity (umf) obtained for every percentage mixture of 1000 μm CaO and air pressure. All the expected minimum fluidization velocity was calculated based on the Ergun Equation (Wen, 2003; McCabe et al., 2004) using:
| (2) |
where, μg is dynamic viscosity of the carrier gas (kg m-1 sec), ρg is density of the carrier gas (kg m-3), ds is solid particles size (m) and Arnumb is Archimedes number.
The umf is needed to separate the particles of CaO and sand from each other and float in the SBFB. As shown in Fig. 5, under the constant air pressure of 2 bars, the bed pressure drops for different CaO-sand percentages were not similar.
| Table 1: | Expected minimum fluidization velocity |
 | |
 | |
| Fig. 5: | Effect of 1000 μm CaCO3 mixture percentages, air volume flow rate and air pressure on the pressure drop (2 bars) |
 | |
| Fig. 6: | Effect of 1000 μm CaCO3 mixture percentages, air volume flow rate and air pressure on the pressure drop (3 bars) |
 | |
| Fig. 7: | Effect of 1000 μm CaCO3 mixture percentages, air volume flow rate and air pressure on the pressure drop (4 bars) |
However the constant bed pressure drop was obtained when the umf reached for every CaO-sand percentages (between 0.05-0.08 m sec-1). In Fig. 6, when the umf reached 0.04-0.06 m sec-1, the constant bed pressure drop was obtained for all percentage mixture of 1000 μm CaO under 3 bars constant air pressure. The similar trends can also be seen in Fig. 7-9. When the umf reached 0.05-0.06 m sec-1, the constant bed pressure drop was obtained for all constant air pressure 4, 5 and 6 bars. The comparison between the expected minimum fluidization velocity (Table 1) using Ergun Equation (Wen, 2003; McCabe et al., 2004) and the experimentally (Fig. 5-9) were approximately same.
When the superficial fluid velocity was gradually increased, the bed pressure drop gradually increased for all percentage mixture of 1000 μm CaO and air pressure. Then the bed pressure drop levels off and no longer increases as the superficial velocity is increased because it has reached the umf. This due to the upward force exerted by the fluid on the particles was sufficient to balance the net weight of the bed and the particles begin to separate from each other and float in the fluid. As the velocity is increased further, the bed continues to expand in height, but the bed pressure drop stays constant.
 | |
| Fig. 8: | Effect of 1000 μm CaCO3 mixture percentages, air volume flow rate and air pressure on the pressure drop (5 bars) |
 | |
| Fig. 9: | Effect of 1000 μm CaCO3 mixture percentages, air volume flow rate and air pressure on the pressure drop (6 bars) |
The similar trends on the bed pressure drops constant level in the bubbling fluidization bed also can be found from experimental results reported by Flamant et al. (1991), Svoboda and Hartman (1981), Guo et al. (2003) and Yates (1983).
Based on the similar experimental results of the minimum fluidization velocity and the constant bed pressure drop were obtained compared to other researchers, the following variables affecting the fluidization height were investigated:
| • | Percentage mixture of 1000 μm CaO |
| • | Volume flow rate of the compressed air and |
| • | The air pressure |
Effect of the CaO percentages: The amount of CaO percentage in the mixture has an effect on the bed pressure drop and bed expansion height under constant pressure. With the decrease of the CaO percentages from 70, 60, 50 to 40%, the bed pressure drop ΔP in the SBFB increased under constant pressure of 2 bars as shown in Fig. 5. When the air pressure increased to 3 bars (Fig. 6), the similar trend was obtained where the bed pressure drop ΔP increased when the CaO-sand mixtures percentages decreased.
s | |
| Fig. 10: | Bed expansion height results (2 bars) |
These happened because of the increasing in the amount of mass of the solid particles (1000 μm CaO-350 μm sand) in every mixture. These similar trends can also be found in the Fig. 7-9.
In Fig. 10, its can be observed that with the decreased of the CaO percentages by 70, 60, 50 to 40, the bed expansion height increased between 0-14.5 cm when the superficial velocity increased from 0.02-0.215 m sec-1 under 2 bars constant air pressure. This can be explained by the adhesive force between CaO particles such as the Van der Waals force, the electronic force and the liquid bridge existing in the powder that has been reduced because of the increased of the 350 μm sand particles in the mixture. Previous studies reported by Geldart (1973) and Yates (1983) showed that the particle size of sand in the range of 150-500 μm (Group B powders) with low density is in the range of 1500-4000 kg m-3 has a better fluidization. Similar trends can also be found from the experimental results of Gao et al. (2009). However at early stages of the experiments for 70 and 60% CaO mixture, the bed expansion height is 0 cm, which means that these is no fluidization. This is because the superficial flow velocity has not reach the minimum superficial flow velocity where the upward force exerted by the fluid on the particles is not sufficient to force the weight of CaO-sand mixture of the bed. The adhesive force between CaO-sand mixture particles is still strong and the amount of 350 μm of sand is not enough to overcome it.
In Fig. 11-13, the similar trends can also be seen where the bed expansion height was 0 cm when the CaO-sand percentages mixture was 70 and 60% at low superficial velocity of 0.02-0.06 m sec-1. These happened under the constant air pressure of 3, 4 and 5 bars. The superficial flow velocity has not reach the minimum superficial flow velocity where the upward force exerted by the fluid on the particles is not sufficient to force the weight of CaO-sand mixture of the bed.
 | |
| Fig. 11: | Bed expansion height results (3 bars) |
 | |
| Fig. 12: | Bed expansion height results (4 bars) |
 | |
| Fig. 13: | Bed expansion height results (5 bars) |
In Fig. 14, its can be observed that the bed expansion height increased between 0 to 14.5 cm when the superficial velocity increased from 0.02-0.215 m sec-1 under 6 bars of the constant air pressure. The increased of the bed expansion height can be seen for all CaO-sand percentages mixture (70, 60, 50 to 40%). The adhesive force between CaO particles existing in the powder has been reduced due to the increased of the air pressure and the amount of sand particles in the mixture. The results obtained were similar with the explanation by Yates (1983).
Effect of the air volume flow rate and air pressure: Air volume flow rate and pressure are important operating parameters in fluidized bed.
 | |
| Fig. 14: | Bed expansion height results (6 bars) |
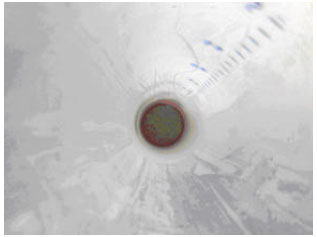 | |
| Fig. 15: | No rat holes and fluidization formed during operation (15 L min-1, 1000 μm, 70% CaO, 2 bars) |
The 1000 μm CaO-sand mixture was tested with 5, 15, 25, 35, 45 and 55 L min-1 flow rates at different air pressures to determine the fluidization behavior. As shown in Fig. 10-14, when the air volume flow rate increases (in term of superficial flow velocities 0.020 to 0.215 m sec-1), the bed expansion height also increased at all air pressures except at the low superficial flow velocity less than 0.06 m sec-1 at 2, 3, 4, 5 bars (70, 60% CaO mixture) and at 5 L min-1 (0.02 m sec-1) at all variables. At these conditions, no fluidizations were found. The reason is due to the strong interaction force that acts between two macroscopic bodies such as particle-particle and particle-wall that exist in the bed material. Furthermore the amount percentage of CaO is too much to be overcome by air volume flow rate and pressure. Figure 15 shows the one example of the pictures taken for this phenomenon.
CONCLUSIONS
The characteristics on fluidization behaviors of 1000 μm CaO-sand mixtures in the cold model experiment were determined. The investigations of the fluidization of the bed in term of the bed expansion height and the pressure drop have been listed as follows:
| • | The CaO percentages of 50 and 40 were found to have a good fluidization in range 15-55 l/min volume flow rates of air for all air pressures (2, 3, 4, 5 and 6 bars) |
| • | At 70 and 60% CaO, the fluidizations only occurred after reach 25 L min-1 air flow rate for pressure 2, 3, 4 and 5 bars except at 6 bars, the 1000 μm CaO-sand mixture fluidized in 15-55 L min-1 range |
| • | No fluidizations were found at 5 L min-1 for all variables |
ACKNOWLEDGMENTS
The authors would like to express their appreciation to The Research University Grant Scheme of University Science Malaysia (Grant No. MEKANIK/811122) for providing financial support for this study.
REFERENCES
- Abanades, J.C., E.J. Anthony, J. Wang and J.E. Oakey, 2005. Fluidized bed combustion system integrating CO2 capture with CaO. Environ. Sci. Technol., 39: 2861-2866.
CrossRef - Abanades, J.C., 2002. The maximum capture efficiency of CO2 using a carbonation/calcinations cycle of CaO/CaCO3. Chem. Eng. J., 90: 303-306.
CrossRef - Chen, Z., C.J. Lim and J.R. Grasa, 2007. Study of limestone particle impact attrition. Chem. Eng. Sci., 62: 867-877.
CrossRef - Dogru, M., C.R. Howrath, G. Akay, B. Keskinler and A.A. Malik, 2002. Gasification of hazelnut shells in a downdraft gasifier. Energy, 27: 415-427.
CrossRef - Florin, N.H. and A.T. Harris, 2008. Enhanced hydrogen production from biomass with in situ carbon dioxide capture using calcium oxide sorbent. Chem. Eng. Sci., 63: 287-316.
CrossRefDirect Link - Gao J., X. Lan, Y. Fan, J. Chang, G. Wang, C. Lu and C. Xu, 2009. Hydrodynamics of gas-solid fluidized bed of disparately sized binary particles. Chem. Eng. Sci., 64: 4302-4316.
CrossRef - Grasa, G.S. and J.C. Abanades, 2007. Narrow fluidized beds arranged to exchange heat between a combustion chamber and a CO2 sorbent regenerator. Chem. Eng. Sci., 62: 619-626.
CrossRef - Grasa, G.S., J.C. Abanades, M. Alonso and B. Gonzalez, 2008. Reactivity of highly cycled particles of CaO in a carbonation/calcination loop. Chem. Eng. J., 137: 561-567.
CrossRef - Guo, Q., G. Yue, T. Suda and J. Sato, 2003. Flow characteristics in a bubbling fluidized bed at elevated temperature. Chem. Eng. Proc., 42: 439-447.
CrossRef - Guoxin, H. and H. Hao, 2009. Hydrogen rich fuel gas production by gasification of wet biomass using a CO2 sorbent. Biomass Bioenergy, 33: 899-906.
CrossRef - Hanaoka, T., Y. Yoshidaa, S. Fujimotoa, K. Kamei and M. Harada et al., 2005. Hydrogen production from woody biomass by steam gasification using a CO2 sorbent. Biomass Bioenergy, 28: 63-68.
CrossRef - Hollingdale, A.C., G.R. Breag and D. Pearce, 1988. Producer Gas Fuelling of a 20 KW Output Engine by Gasification of Solid Biomass. Overseas Development Natural Resources Institute, London, UK., ISBN 0-85954-243-2.
Direct Link - Jorapur, R.M. and A.K. Rajvanshi, 1995. Development of sugarcane leaf gasifier for electricity generation. Biomass Bioenergy, 8: 91-98.
CrossRef - McKendry, P., 2002. Energy production from biomass (part 1): Overview of biomass. Bioresour. Technol., 83: 37-46.
CrossRef - McKendry, P., 2002. Energy production from biomass (part 2): Conversion technologies. Bioresour. Technol., 83: 47-54.
CrossRef - McKendry, P., 2002. Energy production from biomass (part 3): Gasification technologies. Bioresour. Technol., 83: 55-63.
CrossRef - Miskam, A., Z.A. Zainal and I.M. Yusof, 2009. Characterization of sawdust residues for cyclone gasifier. J. Applied Sci., 9: 2294-2300.
CrossRefDirect Link - Munoz, M., F. Moreno, R.J. Morea, J. Ruiz and J. Arauzo, 2000. Low heating value gas on spark ignition engines. Biomass Bioenergy, 18: 431-439.
CrossRef - Rezaiyan, J. and P. Nicholas, 2005. Gasification Technologies: A Primer for Engineers and Scientists. 1st Edn., CRC Press, New York, ISBN-10: 0824722477, pp: 360.
Direct Link - Salvador, C., D. Lu, E.J. Anthony and J.C. Abanades, 2003. Enhancement of CaO for CO2 capture in a FBC environment. Chem. Eng. J., 96: 187-195.
CrossRef - Shimizu, T., T. Hirama, H. Hosoda, K. Kitano, M. Inagaki and K. Tejima, 1999. A twin fluid bed reactor for removal of CO2 from combustion process. Chem. Eng. Res. Design, 77: 62-68.
CrossRef - Sridhar, G., P.J. Paul and H.S. Mukunda, 2001. Biomass derived producer gas as a reciprocating engine fuel: An experimental analysis. Biomass Bioenergy, 21: 61-72.
CrossRef - Stefan, K., P. Christoph, R. Reinhard, H. Hermann, M.M. Tonja and S. Michael, 2009. H2 rich product gas by steam gasification of biomass with in situ CO2 absorption in a dual fluidized bed system of 8 MW fuel input. Fuel Process. Technol., 90: 914-921.
CrossRef - Svoboda, K. and M. Hartman, 1981. Influence of temperature on incipient fluidization of limestone, lime, coal ash and corundum. Ind. Eng. Chem. Process Design Dev., 20: 319-326.
CrossRef - Uma, R., T.C. Kandpal and V.V.N. Kishore, 2004. Emission charteristics of an electricity generation system in diesel alone and dual fuel modes. Biomass Bioenergy, 27: 195-203.
CrossRef - Yang, W.C., 2003. Handbook of Fluidization and Fluid-Particle Systems. CRC Press, New York, ISBN: 9780824702595, Pages: 1868.
Direct Link - Yates, J.G., 1983. Fundamentals of Fluidized-Bed Chemical Processes. Butterworth-Heinemann, UK., ISBN-10: 040870909X. pp: 240.
Direct Link - Yusof, I.M., N.A. Farid, Z.A. Zainal and M. Azman, 2008. Characterization of rice husk for cyclone gasifier. J. Applied Sci., 8: 622-628.
CrossRefDirect Link - Zainal, Z.A., A. Rifau, G.A. Quadir and K.N. Seetharamu, 2002. Experimental investigation of a downdraft biomass gasifier. Biomass Bioenergy, 23: 283-289.
CrossRef - Mahishi, M.R. and D.Y. Goswami, 2007. An experimental study of hydrogen production by gasification of biomass in the presence of a CO2 sorbent. Int. J. Hydrogen Energy, 32: 2803-2808.
CrossRef