
Monal Dutta
Department of Chemical Engineering, Indian Institute of Technology, Kharagpur, West Bengal-721302, India
Jayanta Kumar Basu
Department of Chemical Engineering, Indian Institute of Technology, Kharagpur, West Bengal-721302, India
Research Journal of Environmental Toxicology
Year: 2011 | Volume: 5 | Issue: 4 | Page No.: 266-278


ABSTRACT
In the present decade, application of response surface methodology in developing char from various wood scarps for the removal of colored materials form domestic as well as industrial waste water has gained significant importance. Therefore, an activated carbon was developed from Acacia Auriculiformis scrap wood for the removal of methylene blue from its aqueous solution. The preparation conditions of the activated carbon were optimized by using response surface methodology through three levels Box-Behnken design. In this optimization procedure, three response variables namely surface area, methylene blue adsorption capacity and total pore volume were chosen whereas the input variables were carbonization temperature, carbonization time and nitrogen flowrate. The response surface methodology was based on the Box-Behnken design. The analysis of variance (ANOVA) depicted that the quadratic model was suitable for all the responses. The predicted and experimental values of responses were in reasonable agreement with each other. The optimum values of input variables were found to be 712°C, 2 h and 300 mL-1. The char prepared at optimum condition was found to have a surface area, MB adsorption capacity and total pore volume of 524.91 m2 g-1, 333.3 mg g-1 and 0.3476 cc g-1, respectively. Therefore, the char derived from Acacia Auriculiformis scrap wood showed greater efficacy towards methylene blue adsorption.
PDF Abstract XML References Citation
Received: July 26, 2011;
Accepted: October 05, 2011;
Published: October 31, 2011
How to cite this article
Monal Dutta and Jayanta Kumar Basu, 2011. Application of Response Surface Methodology for the Removal of Methylene Blue by Acacia Auriculiformis Scrap Wood Char. Research Journal of Environmental Toxicology, 5: 266-278.
DOI: 10.3923/rjet.2011.266.278
URL: https://scialert.net/abstract/?doi=rjet.2011.266.278
DOI: 10.3923/rjet.2011.266.278
URL: https://scialert.net/abstract/?doi=rjet.2011.266.278
INTRODUCTION
Dye is a major pollutant exuded by many industries all over the world especially textile, paper, printing, leather, food, cosmetics etc. which extensively, use dyes to colour their final product (Arunachalam and Annadurai, 2011; Rajeswari et al., 2011). From the dying section of an industry large amount of coloured effluents are discharged into water bodies which impart colour to the same and reduce the penetration of light (Rajendran et al., 2011; Verma, 2008). This in turn retards photosynthetic activity and inhibits the growth of biota (Oguz and Keskinler, 2005; Wanchanthuek and Thapol, 2011). These dyes are very stable, difficult to degrade and very hazardous to aquatic life (Osman et al., 2009). Therefore, the pre-treatment of these colored effluents prior to disposal into water bodies is very much essential (Wanchanthuek and Nunrung, 2011). Different conventional treatment methods such as, coagulation and flocculation (Amin, 2008; Santhy and Selvapathy, 2006), oxidation (Malik and Saha, 2003), membrane separation (Ciardelli et al., 2001) and adsorption (Wu and Tseng, 2008) are used to treat the colored water but adsorption is the most efficient and largely used technique amongst all (Dekhil et al., 2011). There are various adsorbents which are used for the removal of methylene blue dye such as, activated carbon (El Qada et al., 2006), pineapple leaf powder (Weng et al., 2009), rosewood sawdust (Garg et al., 2004), perlite (Dogan et al., 2004), montmorillonite clay (Almeida et al., 2009). Although, the activated carbon is one of the widely used adsorbents but its high cost and low availability limits the widespread uses. In most of the processes, the activated carbon is manufactured from coal (Sze and McKay, 2010) and coconut-shell (Yang et al., 2010) Besides, activated carbon is also manufactured from agricultural wastes such as rice husk (Bishnoi et al., 2004), sugarcane bagasse (Mckay, 1998; Mohan and Singh, 2002), apple pulp (Suarez-Garcia et al., 2001), banana pith (Namasivayam et al., 1998), bamboo (Hameed et al., 2007) and waste-coffee grounds (Nunes et al., 2009) etc.
Therefore, the search for comparatively low cost raw materials for the preparation of char has become a growing field of research now-a-day. The char prepared from different scrap wood by carbonization method offers large surface area and total pore volume (Tancredi et al., 2004). The dye adsorption capacity mainly depends on the characteristics properties of char which in turn influenced by various parameters of carbonization. These influences can be studied through a statistical design approach such as Response Surface Methodology (RSM) which helps to design a process by optimizing the process variables (Lee et al., 2000). Previously, Methylene Blue adsorption was optimized using RSM (Dutta et al., 2011; Alam et al., 2009) but little work was done on optimization of carbonization process parameters to develop char for MB adsorption. In the present study, the carbonization process parameters such as, carbonization time, carbonization temperature and nitrogen flow rate was optimized using RSM to prepare a char which is used for MB adsorption.
MATERIALS AND METHODS
Raw materials: The scrap wood of Acacia Auriculiformis selected for this work, was collected from local saw mill. Methylene Blue (MB), hydrochloric acid and ammonia were procured from Merck Specialities Private Limited, Mumbai, India. All the experimental studies were carried out on January 2011 and it took approximately 2-3 h to complete a single experimental run.
Preparation of char: The char was prepared by carbonization of Acacia Auriculiformis scrap wood in an inert atmosphere. The wood scrap was first cut into small pieces of 2 mM width and 40 mM of length, cleaned with distilled water and was sun dried for 24 h prior to the carbonization.
The wood pieces were kept on a ceramic boat which was placed at the center of a 40-mM i.d tubular furnace. The material was then heated from ambient temperature to the carbonization temperature at the rate of 4°C min-1 in a continuous flow of N2 and then it was kept at this temperature for 1 h for subsequent activation. It was then allowed to cool to ambient temperature in presence of N2 flow. The product was sieved to obtain the desired size fractions and stored in a desiccator over silica gel.
Adsorption equilibrium: The monolayer adsorption capacity of the prepared char for MB was determined by the equilibrium study. The equilibrium study was carried out by adding 0.1 g of adsorbent into a series of 250 mL conical flask containing 100 mL solution of MB and was shaken in a mechanical shaker for 36 h at room temperature. After this the samples were centrifuged and the concentrations were analyzed in a UV-V is spectrophotometer. The equilibrium adsorption capacity was calculated from the relationship:
| (1) |
where, qe (mg g-1) is the equilibrium adsorption capacity, Ce is the dye concentration at equilibrium (mg L-1), V is the volume of solution (l) and w is the weight of adsorbent (g).
Optimization of carbonization process through methylene blue adsorption: The carbonization process was designed and optimized statistically by applying response surface methodology through three levels Box-Behnken design (BBD).
In this experiment, the carbonization temperature (A), carbonization time (B) and nitrogen flow rate (C) were selected as significant independent variables and BET surface area (Y1), total pore volume (Y2) and MB adsorption capacity (Y3) were considered as response variables. The response variables were correlated to the independent variables by the following polynomial equation:
| (2) |
where, Y is the response and β0, βi , βii and βij are coefficients of the intercept, linear, square and interaction effects respectively. The regression model was statistically analyzed by using design expert software (Stat-Ease, Inc., version 8.0.4, Minneapolis, USA). The optimum values of the process parameters were obtained from numerical optimization. The statistical analysis was done by using response surface methodology through three levels Box-Behnken Design (BBD). In the BBD the ranges of input variables are provided as per their higher and lower values and a design matrix is predicted by the software after performing possible permutations and combinations. Once, the experiments are carried out according to the design matrix, different experimental values of output variables are put in the design matrix to determine the optimum experimental conditions.
Characterization of char: The surface area and the total pore volume of the prepared char were determined by using N2 adsorption-desorption method by using Brunauer Emmett Teller (BET) apparatus(Autosorb-1, Quantacrome) The particle size of prepared activated carbon was analyzed in a particle size analyzer (Malvern Instrument, EPA 5002, UK). The surface morphology of the char was investigated by using Scanning Electron Microscope (SEM) (Hitachi, model SU-70).
The surface functional groups were determined by fourier transform infrared spectroscopy (FTIR) spectroscopy (PerkinElmer Spectrum One). The total ash content and the apparent density of the activated carbon were also determined. The carbon, hydrogen, nitrogen and sulphur content of the activated carbon were also determined with the help of CHN analyzer (Vario, Marco). The zero surface charge characteristics of the char was determined by adding 0.1 g of adsorbent in a series of volumetric flasks containing 100 mL 0.01 M NaCl solutions of different pH (Nethaji et al., 2010). The pH values of the NaCl solutions were adjusted between 2 and 10 by adding either 0.1 M HCl or dilute ammonical solution. The suspension were placed in a shaker incubator and shaken for 40 h. The final pH (pHf) was measured and it was plotted against the difference between the initial pH (pH0) and final pH (pHf).
RESULTS AND DISCUSSION
Development of model equation by BBD: A three factor BBD was used to study the effect of the significant process parameters such as carbonization temperature, carbonization time and nitrogen flow rate on surface area, MB adsorption capacity and total pore volume.
| Table 1: | Experimental range and levels of process variables |
 | |
The range and levels of the process parameters given in Table 1 were coded as per their high and low values. The design matrix proposed by BBD contained fifteen experimental runs with three replicates at the center points. The quadratic model was suggested by the software for surface area (Y1), MB adsorption capacity (Y2) and total pore volume (Y3) and the corresponding model equations were represented in terms of coded variables by Eq. 3-5.
| (3) |
| (4) |
| (5) |
Analysis of variance (ANOVA): The adequacy of the models was justified by the analysis of variance (ANOVA). The ANOVA of surface area, MB adsorption capacity and total pore volume is given in Table 2. The model F-value is the ratio of mean square for the individual term to the mean square for the residual. The Prob > F value is the probability of F-statistics value and is used to test the null hypothesis. The parameters having an F-statistics probability value less than 0.05 are said to be significant (Bagheri et al., 2011). In the present study, the probability of model F-statistic value for surface area was 0.0003 implied that the model suggested by the software, was significant. Besides, A, B, C, AB, AC, A2, B2 terms had significant effect on surface area. In case of MB adsorption capacity, the probability of model F-statistic value was <0.0001 indicated that the model was significant and the significant model terms were A, B, C, AB, AC, BC, A2, B2, C2. Similarly, the probability of model F-statistic values for the total pore volume was also <0.0001. Therefore, the significant terms were found to be A, B, C, AB, AC, BC, A2, C2. The predicted R-squared was used in regression analysis to indicate how well the model predicted responses for new observations and adjusted-R squared was a goodness-of-fit measure in multiple regression analysis.
The plot between predicted and actual values of surface area, MB adsorption capacity and total pore volume were shown in Fig. 1a-c. It implied that a good correlation between process parameters and the desired responses could be drawn by the model developed.
Effects of process parameters on surface area: The combined effect of temperature (A), carbonization time (B) and N2 flow rate (C) on the MB uptake is depicted in Fig. 2a and b, respectively. It is observed from Fig. 2a that surface area increased with increase in time and decrease in nitrogen flowrate. On the other hand it is depicted from Fig. 2b that with increase in temperature from 500 to 750°C, an increase in surface area occurred but the surface area decreased as the temperature was increased further. The increase in temperature leads to the formation of newer pores and an opening of the existing pores on the activated carbon surface which in turn results into high surface area.
 | |
| Fig. 1(a-c): | Plot of the predicted versus actual values for surface area methylene blue adsorption capacity total pore volume |
 | |
| Fig. 2(a,b): | Effect of parameters on surface area nitrogen flowrate and time nitrogen flowrate and temperature |
| Table 2: | Analysis of variance (ANOVA) and lack of fit test for various responses |
 | |
A further increase in temperature caused the pore wall to be collapsed due to thinning of pore size, reduces the available surface area (Azargohar and Dalai, 2005). Besides, the increase in temperature also caused the ash content to increase which offered a resistance to the diffusion of activating agent (Walker and Almagro, 1995). The dispersed inorganic elements, formed at lower temperature might also sinter and block the pores which reduced the surface area (Zolin et al., 2002). The surface area may also decrease due to thermal annealing at high temperature which leads to collapse of pores (Marsh et al., 1997).
 | |
| Fig. 3(a,b): | Effect of parameters on methylene blue adsorption capacity (a) nitrogen flowrate and time (b) nitrogen flowrate and temperature |
But, it was observed from the previous literature survey that the surface area was increased with increase in nitrogen flowrate upto 500 mL-1 and then it decreased with further increase in flowrate (Jiang and Zhao, 2004). The maximum surface area (586.66 m2 g-1) was obtained at a temperature time and N2 flowrate of 750°C, 4h and 300 mL min-1, respectively.
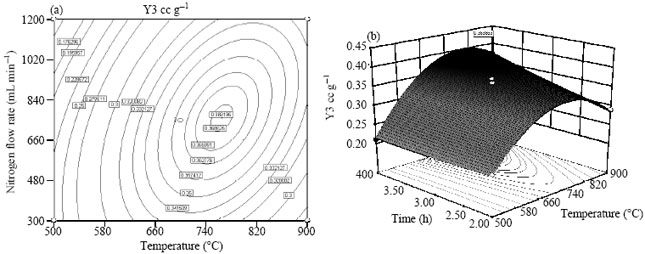
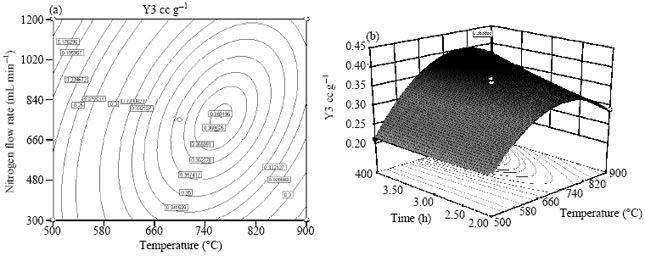
Effects of process parameters on MB removal capacity: All three parameters studied namely carbonization temperature (A), carbonization time (B) and nitrogen flow rate (C) either individually or their mutual interactions significantly affect the methylene blue removal ability (qe). In this case A, B, C, AB, AC, BC, A2, B2, C2 are significant model terms. It is inferred from Fig. 3a that Y2 increased with decrease in N2 flow rate. The aforementioned result may be attributed to the fact that with lower nitrogen flow rate greater amount of pore volume is obtained. This conclusion is in agreement with previous literature (Katyal et al., 2003). It has been also envisaged from Fig. 3a that with increase in carbonization time upto 2.5 h MB adsorption capacity (mg g-1) increased but with further increase in carbonization time resulted into lower MB adsorption capacity. This can be ascribed to the fact that when wood is carbonized for a longer time, its surface area increases upto a certain carbonization time but with further heating annealing of pores took place which results into lower surface area and lower MB adsorption capacity (Lua et al., 2004). From the Fig. 2b, it is further deduced that with increase in temperature upto 750°C the adsorption capacity of methylene blue was increased but with further increase in temperature it decreased slowly. The reason behind it is the formation of greater number of adsorption sites on the surface of the prepared char. An increase in adsorption capacity with carbonization temperature and carbon yield was observed from the work done by Shimada et al. (1999).
Effects of process parameters on the total pore volume: In case of total pore volume as the response variable, all the three process parameters i.e. carbonization temperature, carbonization time and nitrogen flow rate were found to have significant effect and the total pore volume increased with increase in all the three parameters. This is shown in Fig. 4a and b. The similar result was also observed from the work done by Walker (1996), where the total pore volume also increased with increase in temperature.
 | |
| Fig. 4(a,b): | Effects of parameters on total pore volume (a) nitrogen flowrate and temperature (b) time and temperature |
As the temperature increased, the carbon atoms were removed from the interior of the adsorbent particle caused the enlargement of the existing micropores and opening up the closed micropores. But with further increase in temperature and time the widening of the pore walls took place (Guo et al., 2009). On the contrary, the pore volume increased continuously with increase in temperature when eucalyptus wood is carbonized at 800°C (Ngernyen et al., 2006). The maximum total pore volume (0.36 cc g-1) was obtained at a carbonization temperature, carbonization time and nitrogen flowrate of 745°C, 3.5 h and 700 mL-1 respectively.
Optimization of process variables: The optimum values of different process parameters for individual responses were found from the 3D surface plots and it could be seen that the optimum values of process parameters varied slightly in each case. Therefore the numerical optimization was applied to optimize the carbonization process where three process parameters were considered at a time. The desired goal of numerical optimization was to maximize the surface area, MB adsorption capacity and total pore volume. The optimum values carbonization time and temperature and nitrogen flow rate predicted by the model were 712°C, 2 h and 300 mL-1 respectively.
A desirability value of 0.928 was obtained after optimizing the process parameters. The char prepared at this condition was termed as C712N.
Characterization of prepared char: The physical properties such as apparent density and total ash content of the prepared char were determined and the values were found to be 1.94 g cm-3 and 1.1%, respectively. It was found from the previous work of (Buczek et al., 1995) that the commercial activated carbon used for the adsorption of the binary mixture had high ash content (4-11%). The carbon, hydrogen, nitrogen and sulphur content of the activated were found to be 89.43, 2.65, 0.68 and 0.061% respectively. The BET surface area (SBET) and total pore volume (Vtot) were found to be 524.91 m2 g-1 and 0.3476 cc g-1, respectively. These values were in good agreement with the model predicted values of 544.73 m2 g-1 and 0.356 cc g-1, respectively. The surface morphology of C712N was determined by SEM analysis and it is shown in Fig. 5. It depicts from Fig. 5 that a typical honeycomb structure with pores of different size was formed on the surface of activated carbon when it was treated at optimum condition.
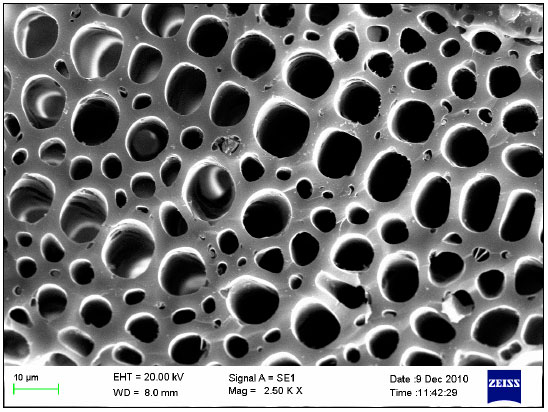 | |
| Fig. 5: | The SEM image of C712N |
 | |
| Fig. 6: | FTIR spectra of C712N |
A similar surface morphology could also be observed when activated carbon was prepared from corncob by chemical activation (Tseng, 2006). The presence of various surface functional groups was confirmed by FTIR analysis. The FTIR spectra obtained for C712 is shown in Fig. 6. The C-H and O-H bonds were detected at 1422 and 3350 cm-1 (Vasu, 2008; Al-Jlil, 2010). The carboxylic and phenolic groups were detected in the region of 1100-1200 cm-1.
 | |
| Fig. 7: | The point of zero charge of C712N |
| Table 3: | Comparison of adsorption capacity of C712N with other adsorbents |
 | |
The point of zero charge (pHZPC) is one of the important characteristics of the adsorbents and it is the plot between the final pH (pHf) and the difference between the initial (pH0) and final pH (pHf).The point of zero charge (pHZPC) indicates the pH at which the adsorbent surface has electrical neutrality (Deng et al., 2009). The pHZPC for C712N was found to be 6.31 Fig. 7.
Comparison of monolayer adsorption capacity of different activated carbons: The adsorption capacity of was compared with the adsorption capacities of activated carbons prepared by various raw materials for methylene blue (Table 3). The experimental data was fitted to various adsorption isotherms and the Langmuir adsorption isotherm fitted well and the adsorption capacity of C712N for methylene blue was found to be 333.3 mg g-1.
CONCLUSION
A char was prepared by carbonization of Acacia Auriculiformis scrap wood in a tubular furnace. The response surface methodology through Box-Behnken design was used to optimize the carbonization process. The surface area, MB removal capacity and total pore volume were considered as response variables for optimizing the charring process. A quadratic model was capable of accurately interpreting the experimental data for all the three responses. It was observed from ANOVA that carbonization temperature, time and N2 flowrate had significant effects on the response variables. The carbonization process was successfully optimized by response surface methodology.
REFERENCES
- Alam, M.Z., M.F. Mansor and K.C.A. Jalal, 2009. Optimization of decolorization of methylene blue by lignin peroxidase enzyme produced from sewage sludge with Phanerocheate chrysosporium. J. Hazardous Mater., 162: 708-715.
CrossRefPubMedDirect Link - Alaya, M.N., M.A. Hourieh, A.M. Youssef and F. El-Sejariah, 2000. Adsorption properties of activated carbons prepared from olive stones by chemical and physical activation. Adsorpt. Sci. Technol., 18: 27-42.
CrossRefDirect Link - Al-Jlil, S.A., 2010. Equilibrium study of adsorption of cobalt ions from wastewater using Saudi roasted date pits. Res. J. Environ. Toxicol., 4: 1-12.
CrossRefDirect Link - Almeida, C.A.P., N.A. Debacher, A.J. Downs, L. Cottet and C.A.D. Mello, 2009. Removal of methylene blue from colored effluents by adsorption on montmorillonite clay. J. Colloid Interface Sci., 332: 46-53.
CrossRefDirect Link - Amin, N.K., 2008. Removal of reactive dye from aqueous solutions by adsorption onto activated carbons prepared from sugarcane bagasse pith. Desalination, 223: 152-161.
CrossRef - Arunachalam, R. and G. Annadurai, 2011. Optimized response surface methodology for adsorption of dyestuff from aqueous solution. J. Environ. Sci. Technol., 4: 65-72.
CrossRefDirect Link - Aygun, A., S. Yenisoy-Karakas and I. Duman, 2003. Production of granular activated carbon from fruit stones and nutshells and evaluation of their physical, chemical and adsorption properties. Microporous Mesoporous Mater., 66: 189-195.
CrossRefDirect Link - Azargohar, R. and A.K. Dalai, 2005. Production of activated carbon from Luscar char: Experimental and modeling studies. Micropor. Mesopor. Mater., 85: 219-225.
CrossRef - Bagheri, H., S. Alinejad and K.D. Bastami, 2011. Heavy metals (Co, Cr, Cd, Ni, Pb and Zn) in sediment of gorganrud river, Iran. Res. J. Environ. Toxicol., 5: 147-151.
CrossRefDirect Link - Basar, C.A., 2006. Applicability of the various adsorption models of three dyes adsorption onto activated carbon prepared waste apricot. J. Hazardous Mater., 135: 232-241.
CrossRef - Bishnoi, N.R., M. Bajaj, N. Sharma and A. Gupta, 2004. Adsorption of Cr (VI) on activated rice husk carbon and activated alumina. Bioresour. Technol., 91: 305-307.
Direct Link - Buczek, B., A. Swiatkowski and A. Goworek, 1995. Adsorption from binary liquid mixtures on commercial activated carbons. Carbon, 33: 129-134.
CrossRef - Ciardelli, G., L. Corsi and M. Marcucci, 2001. Membrane seperation for watewater reuse in the textile industry. Resour. Conserv. Recycl., 31: 189-197.
CrossRef - Dekhil, A.B., Y. Hannachi, A. Ghorbel and T. Boubaker, 2011. Comparative study of the removal of cadmium from aqueous solution by using low-cost adsorbents. J. Environ. Sci. Technol., 4: 520-533.
CrossRefDirect Link - Deng, H., L. Yang, G. Tao and J. Dai, 2009. Preparation and characterization of activated carbon from cotton stalk by microwave assisted chemical activation application in methylene blue adsorption from aqueous solution. J. Hazard. Mater., 166: 1514-1521.
CrossRef - Dogan, M., M. Alkan, A. Turkeyilmaz and Y. Ozdemir, 2004. Kinetics and mechanism of removal of methylene blue by adsorption onto perlite. J. Hazard. Mater., 109: 141-148.
Direct Link - Dutta, S., A. Bhattacharyya, A. Ganguly, S. Gupta and S. Basu, 2011. Application of response surface methodology for preparation of low-cost adsorbent from citrus fruit peel and for removal of Methylene blue. Desalination, 275: 26-36.
CrossRef - El-Qada, E.N., S.J. Allen and G.M. Walker, 2006. Adsorption of Methylene Blue onto activated carbon produced from activated bituminous coal: A study of equilibrium adsorption isotherm. Chem. Eng. J., 124: 103-110.
CrossRef - Garg, V.K., M. Amita, R. Kumar and R. Gupta, 2004. Basic dye (methylene blue) removal from simulated wastewater by adsorption using Indian Rosewood sawdust: A timber industry waste. Dyes Pigments, 63: 243-250.
CrossRefDirect Link - Guo, S., J. Peng, W. Li, K. Yang, L. Zhang, S. Zhang and H. Xia, 2009. Effects of CO2 activation on porous structures of coconut shell-based activated carbons. Applied Surface Sci., 255: 8443-8449.
CrossRef - Hameed, B.H., A.T.M. Din and A.L. Ahmad, 2007. Adsorption of methylene blue onto bamboo-based activated carbon: Kinetics and equilibrium studies. J. Hazard. Mater., 141: 819-825.
CrossRefDirect Link - Jiang, Q. and Y. Zhao, 2004. Effects of activation conditions on BET specific surface area of activated carbon nanotubes. Micropor. Mesopor. Mater., 76: 215-219.
CrossRef - Katyal, S., K. Thambimuthu and M. Valix, 2003. Carbonisation of bagasse in a fixed bed reactor: Influence of process variables on char yield and characteristics. Renewable Energy, 28: 713-725.
CrossRef - Kavitha, D. and C. Namasivayam, 2007. Experimental and Kinetic studies on methylene blue adsorption by coir pith carbon. Bioresourc. Technol., 98: 14-21.
CrossRef - Lee, J., L. Ye, W.O. Landen, Jr. and R.R. Eitenmiller, 2000. Optimization of an extraction procedure for the quantification of Vitamin E in tomato and broccoli using response surface methodology. J. Food Comp. Anal., 13: 45-57.
CrossRef - Lua, A.C., T. Yang and J. Guo, 2004. Effects of pyrolysis conditions on the properties of activated carbons prepared from pistachio-nut shells. J. Anal. Applied Pyrol., 72: 279-287.
CrossRef - Malik, P.K. and S.K. Saha, 2003. Oxidation of direct dyes with hydrogen peroxide using ferrous ion as catalyst. Sep. Purif. Technol., 31: 241-250.
CrossRefDirect Link - Mckay, G., 1998. Application of surface diffusion model to adsorption of dyes on bagasse pith. Adsorption, 4: 361-372.
CrossRef - Mohan, D. and K.P. Singh, 2002. Single and multi-component adsorption of cadmium and zinc using activated carbon derivated from bagasse-an agricultural waste. Water Res., 36: 2304-2318.
CrossRef - Namasivayam, C., D. Prabha and M. Kumutha, 1998. Removal of direct red and acid brilliant blue by adsorption onto banana pith. Bioresour. Technol., 64: 77-79.
CrossRef - Nethaji, S., A. Sivasamy, G. Thennarasu and S. Saravanan, 2010. Adsorption of malachite green dye onto activated carbon derived from Borassus aethiopum flower biomass. J. Hazardous Mater., 181: 271-280.
CrossRef - Ngernyen, Y., C. Tangsathitkulchai and M. Tangsathitkulchai, 2006. Porous properties of activated carbon produced from Eucalyptus and Wattle wood by carbon dioxide activation. Korean J. Chem. Eng., 23: 1046-1054.
CrossRef - Nunes, A.A., A.S. Franca and L.S. Oliveira, 2009. Activated carbons from waste biomass: An alternative use for biodiesel production solid residues. Bioresour. Technol., 100: 1786-1792.
CrossRef - Oguz, E. and B. Keskinler, 2005. Determination of adsorption capacity and thermodynamic parameters of the PAC used for bomaplex red CR-L dye removal. Colloids Surfaces A Physicochem. Eng. Aspects, 268: 124-130.
CrossRef - Osman, M.M., S.A. El-Fiky, Y.M. Soheir and A.I Abeer, 2009. Impact of water pollution on histopathological and electrophoretic characters of Oreochromis niloticus fish. Res. J. Environ. Toxicol., 3: 9-23.
CrossRefDirect Link - Rajeswari, K., R. Subashkumar and K. Vijayaraman, 2011. Biodegradation of mixed textile dyes by bacterial strains isolated from dyewaste effluent. Res. J. Environ. Toxicol., 5: 97-107.
CrossRefDirect Link - Rajendran, R., S.K. Sundaram and K.U. Maheswari, 2011. Aerobic biodecolorization of mixture of azo dye containing textile effeluent using adapted microbial strains. J. Environ. Sci. Technol., 4: 568-578.
CrossRef - Sainz-Diaz, C.I. and A.J. Griffiths, 2000. Activated carbon from solid wastes using a pilot-scale batch flaming pyrolyser. Fuel, 79: 1863-1871.
CrossRef - Santhy, K. and P. Selvapathy, 2006. Removal of reactive dyes from wastewater by adsorption on coir pith activated carbon. Bioresour. Technol., 97: 1329-1336.
CrossRef - Shimada, M., H. Hamabe, T. Iida, K. Kawarada and T. Okayama, 1999. The properties of activated carbon made from waste newsprint paper. J. Porous Mater., 6: 191-196.
CrossRef - Sze, M.F.F. and G. McKay, 2010. An adsorption diffusion model for removal of para chlorophenol by activated carbon derived from bituminous coal. Environ. Pollut., 158: 1669-1674.
CrossRef - Suárez-Garcia, F., M. Martinez-Alonso and J.M.D. Tascon, 2001. Porous texture of activated carbons prepared by phosphoric acid activation of apple pul. Carbon, 39: 1111-1115.
Direct Link - Tancredi, N., N. Medero, F. Maller, J. Pariz, C. Plada and T. Cordero, 2004. Phenol adsorption onto powdered and granular activated carbon, prepared from Eucalyptus wood. J. Colloid Interface Sci., 279: 357-363.
CrossRef - Tseng, R.L., 2006. Mesopore control of high surface area NaOH-activated carbon. J. Colloid Interface Sci., 303: 494-502.
CrossRef - Vadivelan, V. and K.V. Kumar, 2005. Equilibrium, kinetics, mechanism and process design for the sorption of methylene blue onto rice husk. J. Coll. Interf. Sci., 286: 90-100.
CrossRef - Vasu, A.E., 2008. Surface modification of activated carbon for enhancement of Nickel (II) adsorption. E. J. Chemistry, 5: 814-819.
Direct Link - Walker, P.L. Jr. and A. Almagro, 1995. Activation of pre-chlorinated anthracite in carbon dioxide and steam. Carbon, 3: 239-241.
CrossRef - Walker, P.L. Jr., 1996. Complications introduced from gasification induced densification of disordered carbons. Carbon, 34: 1603-1603.
Direct Link - Weng, C.H., Y.T. Lin and T.W. Tzeng, 2009. Removal of methylene blue from aqueous solution by adsorption onto pineapple leaf powder. J. Hazard. Mater., 170: 417-424.
CrossRef - Wanchanthuek, R. and W. Nunrung, 2011. The adsorption study of methylene blue onto MgO from various preparation methods. J. Environ. Sci. Technol., 4: 534-542.
CrossRefDirect Link - Wanchanthuek, R. and A. Thapol, 2011. The kinetic study of methylene blue adsorption over MgO from PVA template preparation. J. Environ. Sci. Technol., 4: 552-559.
CrossRefDirect Link - Wu, F.C. and R.L. Tseng, 2008. High adsorption capacity NaOH-activated carbon for dye removal from aqueous solution. J. Hazard. Mater., 152: 1256-1267.
CrossRef - Yang, K., J. Peng, C. Srinivasakannan, L. Zhang, H. Xia and X. Duan, 2010. Preparation of high surface area activated carbon from coconut shells using microwave heating. Bioresour. Technol., 101: 6163-6169.
CrossRef - Zolin, A., A.D. Jensen, P.A. Jensen and K. Dam-Johansen, 2002. Experimental study of char thermal deactivation. Fuel, 81: 1065-1075.
CrossRef