
Akhiromen Dorathy Iniobong
Department of Biological Oceanography, Nigerian Institute for Oceanography and Marine Research, Victoria Island Lagos, Nigeria
LiveDNA: 234.36837
J.A. Adedipe
Department of Biological Oceanography, Nigerian Institute for Oceanography and Marine Research, Victoria Island Lagos, Nigeria
A.S. Yakub
Department of Biological Oceanography, Nigerian Institute for Oceanography and Marine Research, Victoria Island Lagos, Nigeria
K.J. Balogun
Department of Biological Oceanography, Nigerian Institute for Oceanography and Marine Research, Victoria Island Lagos, Nigeria
B.O. Bello
Department of Biological Oceanography, Nigerian Institute for Oceanography and Marine Research, Victoria Island Lagos, Nigeria
O. Abiodun
Department of Biological Oceanography, Nigerian Institute for Oceanography and Marine Research, Victoria Island Lagos, Nigeria
Journal of Biological Sciences
Year: 2022 | Volume: 22 | Issue: 2 | Page No.: 80-90


ABSTRACT
Background and Objective: Phytoplankton is the primary producer of any aquatic ecosystem and functions as a suitable indicator for water quality evaluation. Phytoplankton growth and division are tightly linked to their diet cycle. The density and diversity of phytoplankton are influenced by the quality of water. Lagos Lagoon is one of the major nine lagoons located in the southwestern region of Nigeria. The study investigated phytoplankton composition and diversity in Lagos Lagoon between January and October, 2017. Materials and Methods: Samples for the phytoplankton studies were collected using a standard plankton net of 55 μm mesh size and preserved with 4% unbuffered formalin and analysed using the microscope. Surface water samples were collected and analysed for the physicochemical parameters (temperature, dissolved oxygen, turbidity, total dissolved solids, salinity, pH, BOD, nitrate, sulphate, phosphate and silicate) using standard procedures and instruments. Results: A total of 68 species, spread out into six classes, Cyanophyta constituted 50.79% of the total phytoplankton abundance, Bacillariophyta constituted 47.64%, Dinophyta was 1%, Euglenophyta, 0.36%, Charophyta 0.14% and Chlorophyta, 0.07% were identified. Ecological indices were used in the assessment of pollution and productivity of a water body. Shannon-Wiener index ranged between 0.83-2.79. Margalef value ranged between 1.13-5.54, Berger Parker range was between 0.22-0.82, while Equitability values ranged between 0.3-0.91. The dominance of the blue-green algae in terms of phytoplankton density in the study, interplayed with the values of Shannon Weiner diversity index and Margalef, showing the study area is under pollution threat. Conclusion: Based on the result of the study, proper frequent monitoring of the study area is recommended, to avoid enhanced depreciation of the water body.
PDF Abstract XML References Citation
Copyright: © 2022. This is an open access article distributed under the terms of the creative commons attribution License, which permits unrestricted use, distribution and reproduction in any medium, provided the original author and source are credited.
How to cite this article
Akhiromen Dorathy Iniobong, J.A. Adedipe, A.S. Yakub, K.J. Balogun, B.O. Bello and O. Abiodun, 2022. Phytoplankton Composition, Abundance and Diversity in Some Selected Parts of Lagos Lagoon. Journal of Biological Sciences, 22: 80-90.
DOI: 10.3923/jbs.2022.80.90
URL: https://scialert.net/abstract/?doi=jbs.2022.80.90
DOI: 10.3923/jbs.2022.80.90
URL: https://scialert.net/abstract/?doi=jbs.2022.80.90
INTRODUCTION
Lagos Lagoon is located in the Southwestern geographical region of Nigeria and is classified to be an open, shallow and tidal lagoon with about 208 km2 surface area and less than two meters deep on average1. The lagoon provides the only opening to the sea to the other nine lagoons in the Southwest of Nigeria. Lagos Lagoon has been observed to experience a noticeable brackish condition during the dry season and it could be as a result of the dynamic pattern of river inflow and seawater incursion2. Apart from the economic and ecological importance of Lagos Lagoons, they equally serve as sink and dumpsites of different types of waste and industrial effluents which find their way unabated into the coastal waters through channels, rivers, lagoon and creeks3.
Phytoplankton is the primary producer of any aquatic ecosystem and functions as a suitable indicator for water quality evaluation and is well applicable in generating background conditions and natural variability4 as energy stored up in them determine the basic primary productivity of an ecosystem. Phytoplankton usually undergoes a fairly predictable annual cycle, but some species may develop explosively and form blooms. On smaller timescales, phytoplankton growth and division is tightly linked to their diet cycle. The density and diversity of phytoplankton are influenced by the quality of water.
Diversity indicates the degree of complexity of community structure. It is the function of the number of species and abundance. Diversity has often been related to environmental characteristics of water mass and energy within the community5. Plankton communities serve as a base for the food chain that supports the commercial fisheries and they are also very useful as biological indicators in pollution management6. Previous studies of anthropogenic wastes and environmental modifications in the Lagos Lagoons have revealed increased levels of pollution stress in the water body7. The knowledge of phytoplankton distribution concerning spatial pattern is important to determine the status of the ecosystem structure and functioning and they equally reflect the nutrient status of the environment8. Although phytoplankton does not have control over their movements, they cannot escape the pollution and this makes them good indicators of pollution in the environment9.
In any aquatic ecosystem, phytoplankton composition, community structure and species diversity have been reported to be influenced, to a large extent, by human activities and physico-chemical parameters10. Their spatial and temporal differences in distribution are widely affected by hydrochemical and physical factors such as temperature, dissolved oxygen, pH, salinity, dissolved solids, turbidity and nutrient11. The influence of these factors on the phytoplankton community alters species composition and their diversity in the marine ecosystem12. For the proper functioning of any aquatic ecosystem and favourable existence of biota, the anthropogenic activities alongside physical and chemical factors like temperature, salinity, turbidity, dissolved solids, pH, dissolved gases, nutrients need to be monitored regularly, as the activity of living organisms is greatly influenced by them13.
This study aims to find out the phytoplankton composition, abundance and species diversity at selected parts of the Lagos Lagoons and assess the impact of human activities on the water quality status, using phytoplankton occurrence as indicators and contribute to the existing knowledge on plankton ecology and distribution.
MATERIALS AND METHODS
Description of the study area: The study was carried out at Lagos Lagoon from January-October, 2017. Lagos Lagoon is in the South-Western region of Nigeria and it lies between longitudes 3°20” and 3°40” E and latitudes 6°15” and 6° 40” N" (Fig. 1) and is generally between 0.5-2m deep. The analysis was carried out at the biological oceanography laboratory of the Nigerian Institute for Oceanography and Marine Research, Lagos.
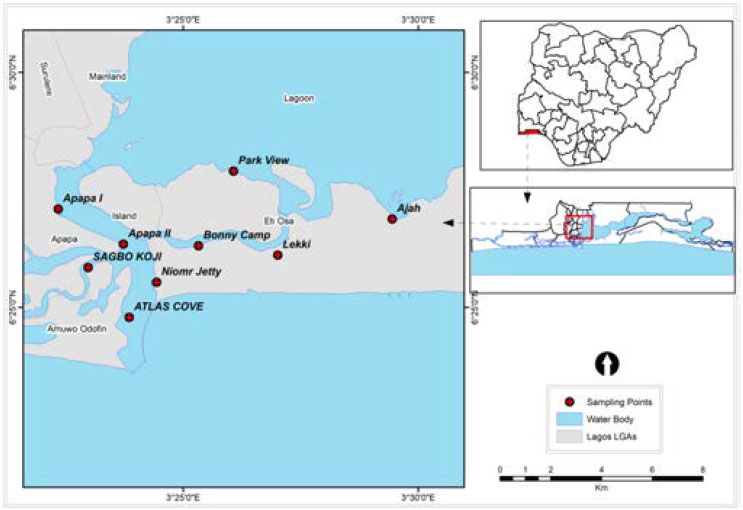 |
| Fig. 1: | Map showing sampling locations in Lagos lagoon |
Collection and analysis of water samples: Surface water samples were collected from 9 stations of Lagos Lagoons namely: NIOMR Jetty, Atlas Cove, Bonny Camp, Parkview, Lekki, Ajah, Sagbo koji, Apapa I and Apapa II, with 1dm3 water samples from all the sampling stations and stored in 1L water bottles and analysed in the laboratory for pH, conductivity, salinity and turbidity using a multi-meter water checker (Horiba U12). Another water sample was collected separately in a 250 mL dissolved oxygen bottle and fixed with Winkler solution at each station. This was followed by dissolved oxygen estimation using Iodometric Winkler’s method. Air and surface water temperature were measured in situ using mercury-in-glass thermometers. The alkalinity of the water samples was determined by titrating dilute Hydrochloric acid against 50 mL of the water sample using methyl orange as an indicator.
Collection and investigation of plankton samples: Plankton samples were collected from each station with a 55 μm mesh size standard plankton net held against the current of the subsiding tide for 10 min. The net was then hauled in and the sample was transferred to a 250 mL well labelled plastic container with a screw cap and preserved with 4% unbuffered formalin and stored in the laboratory before microscopic analysis. In the laboratory, five drops (using a dropper) of the concentrated sample (10 mL) was investigated at different magnifications (50, 100 and 400×) using a Wild II binocular microscope with calibrated eyepiece and the average recorded. The identification and estimation of phytoplankton abundance were done according to the method described by Emmanuel and Onyema14.
Plankton community structure analysis: Diversity (total number of phytoplankton taxa) and total abundance of phytoplankton for every station were determined using data from identification and counting. The composition, distribution and abundance of phytoplankton of the entire study area were determined for each season by pooling the data for all the stations.
Data analysis: The phytoplankton data obtained were pooled and analysed empirically and ecologically. Diversity indices: Margalef species richness (d) diversity, Equitability, Berger Parker dominance index and Shannon Wiener diversity (H) of the entire study area were computed for each season as described by Ogbeibu15 using a ‘Past’ software package16.
RESULTS
The result of the physico-chemical parameters is presented as shown in Table 1. The mean temperature ranged between 28.9°C and 31.4°C during the period of sampling, with the highest temperature recorded in April and the lowest temperature recorded in July. Dissolved oxygen was highest at the NIOMR jetty-station1 with 7.39 mg L–1 and lowest at Apapa II with 4.35 mg L–1. Turbidity ranged between 18.25-41.5 NTU during the sampling period. Salinity ranged between 12.5 and 24 ppt while pH had a range of 7.9-8.2. BOD had the highest value of 5.44 mg L–1 and the lowest value of 3.16 mg L–1 while the Nitrate level was low throughout the sampling period, ranging between 0.14 and 0.36 mg L–1. Sulphate value recorded 652 mg L–1 as the highest value and 199.33 mg L–1 as the lowest value. Phosphate levels also ranged between 7.11 and 12.25 mg L–1 and silicate values ranged between 9.67 and 20.33 mg L–1.
Table 2 shows the spatial phytoplankton compositions in some selected parts of Lagos Lagoons, consisting of six classes (Cyanophyta, Bacillariophyta, Dinophyta, Euglenophyta, Charophyta and Chlorophyta) and sixty-eight different species (Table 2).
| Table 1: | Mean values of the physico-chemical parameters of the water samples | ||||||||||
| Salinity | Turbidity | Nitrate | Sulphate | Phosphate | BOD | Silicate | DO | Temperature | |||
| Stations | TDS | (‰) | (NTU) | (mg L–1) | (mg L–1) | (mg L–1) | pH | (mg L–1) | (mg L–1) | (mg L–1) | (°C) |
| Niomr jetty | 465 | 23.50 | 19.25 | 0.17 | 627.33 | 7.11 | 8.09 | 4.85 | 9.67 | 7.39 | 28.9 |
| Atlas cove | 571 | 24.00 | 20.25 | 0.17 | 652.00 | 10.83 | 8.18 | 3.70 | 10.67 | 6.74 | 29.0 |
| Bonny camp | 331 | 21.00 | 18.25 | 0.18 | 496.67 | 7.54 | 8.20 | 4.97 | 12.00 | 6.38 | 29.8 |
| Parkview | 268 | 15.75 | 24.75 | 0.36 | 460.67 | 9.70 | 8.17 | 3.52 | 13.67 | 5.54 | 30.3 |
| Lekki | 278 | 14.75 | 34.00 | 0.33 | 328.67 | 11.27 | 8.18 | 3.16 | 13.67 | 5.83 | 30.7 |
| Ajah | 9440 | 12.50 | 41.50 | 0.34 | 199.33 | 12.25 | 8.17 | 3.77 | 15.67 | 5.77 | 31.4 |
| Sagbo koji | 477 | 20.00 | 22.25 | 0.14 | 469.33 | 9.37 | 8.02 | 5.44 | 16.33 | 5.76 | 30.2 |
| Apapa I | 469 | 19.75 | 20.00 | 0.27 | 524.67 | 8.67 | 8.04 | 4.97 | 18.67 | 4.55 | 31.0 |
| Apapa II | 466 | 19.75 | 24.75 | 0.28 | 486.00 | 9.21 | 8.00 | 4.55 | 20.33 | 4.35 | 30.5 |
| Table 2: | Spatial phytoplankton composition in some selected parts of Lagos Lagoons | ||||||||
| Taxa | St. 1 | St. 2 | St. 3 | St. 4 | St. 5 | St. 6 | St. 7 | St. 8 | St. 9 |
| Class: Bacillariophyta (Diatomaceae) | |||||||||
| Order I: Centrales | |||||||||
| Aulacoseira granulata var. angustissima (Ehr.) Ralfs | 3 | 1 | - | 3 | 3 | 20 | 11 | - | 4 |
| Melosira nummuloides (Dillwyn) Agardh. | - | - | - | - | - | - | 11 | - | - |
| Actinoptychus splendens | - | - | - | - | - | 1 | - | - | 1 |
| Actinoptychus undulatus (Bail.) | - | - | - | - | - | - | 1 | - | - |
| Acartia longiremis (Lillejeborg) | 4 | - | - | - | - | - | - | - | - |
| Coscinodiscus centralis Ehrenberg | 34 | 3 | 2 | 1 | - | 2 | - | 4 | |
| Coscinodiscus concinnus | 2 | 2 | 2 | 1 | 2 | 4 | 8 | - | 2 |
| Coscinodiscus granii | - | - | - | 1 | 1 | - | - | - | - |
| Coscinodiscus lineatus Ehrenberg | 13 | 1 | 1 | - | 1 | 1 | 6 | - | 1 |
| Coscinodiscus marginatus Ehrenberg | - | - | - | 1 | 19 | 40 | 15 | - | - |
| Coscinodiscus nitidus Gregory | 12 | 22 | 14 | 140 | 5 | - | 11 | 8 | 3 |
| Coscinodiscus radiatus Ehrenberg | 2 | - | - | - | - | - | - | - | - |
| Ditylum brightwellii | 2 | - | - | 2 | - | - | - | - | - |
| Odontella longicruris Greville | 4 | 29 | 10 | - | - | - | - | - | - |
| Odontella sinensis (Greville) Grunow | 1 | 1 | - | 2 | - | - | - | - | - |
| Terpsinoe musica (Ehr.) Hustedt | 1 | - | - | - | - | - | - | - | - |
| Bacteriastrum furcatum | 1 | - | - | - | - | - | - | - | - |
| Family: Chaetoceraceae | |||||||||
| Chaetoceros affine Lauder | - | ||||||||
| Chaetoceros atlanticum Cleve | 1 | 2 | 5 | 14 | - | 1 | - | - | 4 |
| Chaetoceros peruvianus Brightw. | - | - | - | 1 | - | - | - | - | - |
| Order II: Pennales | |||||||||
| Gyrosigma balticum | - | - | - | 2 | - | - | - | - | - |
| Synedra crystallina (Ag) Kützing | - | - | - | - | - | 4 | - | - | - |
| Synedra berolinensis | - | 1 | - | - | - | - | - | - | - |
| Synedra ulna (Nitzsch.) Ehrenberg | - | - | 1 | - | - | - | - | - | - |
| Epithemia argus | - | - | 1 | - | - | - | - | - | - |
| Amphora costata | 1 | - | - | - | - | - | - | - | - |
| Family: Leptocylindraceae | |||||||||
| Asterionella japonica | 14 | - | 2 | 2 | - | - | - | - | - |
| Leptocylindrus danicus | - | - | - | - | 1 | 15 | 2 | - | - |
| Nitzschia seriata | 5 | - | - | - | - | - | - | - | - |
| Nitzschia ignorata | 1 | - | - | - | - | - | - | - | - |
| Nitzschia acicularis | - | - | - | - | - | 1 | - | - | - |
| Nitzschia speculum | - | - | - | - | - | - | 1 | 1 | - |
| Nitzschia closterium | - | - | - | - | 1 | - | - | - | - |
| Nitzschia subtilis | - | - | - | 1 | - | 1 | - | - | - |
| Pleurosigma angulatum | 1 | - | - | - | - | 3 | - | - | - |
| Pleurosigma capense | - | - | - | 2 | - | - | - | - | - |
| Pleurosigma salinarum | - | - | 2 | 1 | - | - | - | - | - |
| Pseudo-nitzschia pungens | 6 | - | - | - | - | 1 | 3 | - | - |
| Rhizosolenia styliformis | 6 | - | - | - | - | - | - | - | - |
| Rhizosolenia delicatula Cleve. | 3 | - | - | 3 | - | - | - | - | - |
| Rhizosolenia hyaline | 1 | - | - | - | - | - | - | - | - |
| Thalassiothrix frauenfeldii Grunow | 2 | - | - | - | - | - | - | - | - |
| Thalassiothrix nitzschioides Grun. | 13 | 2 | - | - | - | - | 2 | 1 | 1 |
| Thalassiosira rotula | 4 | 8 | - | - | - | - | - | - | - |
| Thalassiosira hyaline | 2 | - | 3 | - | - | - | - | - | - |
| Family: Naviculaceae | |||||||||
| Frustulia weinholdi Hust. | - | - | 3 | 1 | - | - | - | - | - |
| Navicula placentula F. rostrata A. Meyer | - | - | 1 | - | - | - | - | - | - |
| Family: Rhizosoleniaceae | |||||||||
| Guinardia flaccida | 2 | - | - | - | - | - | - | - | - |
| Guinardia striata | - | - | 1 | - | - | - | - | - | - |
| Sub-total abundance(n) | 141 | 72 | 46 | 179 | 34 | 92 | 73 | 10 | 20 |
| No. of species | 27 | 11 | 13 | 17 | 9 | 12 | 12 | 3 | 8 |
| Class: Chlorophyta | |||||||||
| Order: Chlorococcales | |||||||||
| Family: Scenedesmaceae | |||||||||
| Scenedesmus brasiliensis | - | - | - | - | 1 | - | - | - | - |
| Sub-total abundance(n) | - | - | - | -- | 1 | - | - | - | - |
| No. of species | - | - | - | - | 1 | - | - | - | - |
| Class: Cyanophyta | |||||||||
| Order I: Chroococcales | |||||||||
| Microcystis aeruginosa Kutzing | 15 | 23 | 100 | 81 | 250 | 22 | 110 | 24 | 8 |
| Microcystis aeruginosa flos aquae | - | - | - | - | - | 4 | - | - | - |
| Order II: Nostocales | |||||||||
| Pseudo-anabaena catental | - | - | - | - | 1 | - | - | -- | - |
| Nostoc paludosum | - | - | - | - | - | - | 1 | - | - |
| Nostoc commune | - | - | - | - | - | - | 2 | - | - |
| Anabaena spiroides | - | - | - | - | - | 4 | - | - | - |
| Family: Surirellaceae | |||||||||
| Campylodiscus clypeus var. Bicostatus (Ehr.) Kutzing | - | - | - | - | - | 2 | - | - | - |
| Order: Oscillatoriales | |||||||||
| Family: Oscillatoriaceae | |||||||||
| Oscillatoria geminata Meneghini | - | - | - | 1 | - | - | - | - | - |
| Oscillatoria tenuis C.A. Agardh | - | 5 | 2 | 13 | 2 | ||||
| Oscillatoria minima Gicklhorn | - | 2 | - | 1 | - | - | - | - | 3 |
| Oscillatoria borneti | 1 | - | 18 | 10 | - | 1 | 2 | 1 | - |
| Oscillatoria chalybea Gomont | - | - | - | - | 1 | - | - | - | - |
| Spirulina subsalsa | - | - | - | - | - | 1 | - | - | - |
| Sub-total abundance(n) | 16 | 30 | 120 | 93 | 265 | 36 | 115 | 25 | 11 |
| No. of species | 2 | 3 | 3 | 4 | 4 | 7 | 4 | 2 | 2 |
| Class: Dinophyta | |||||||||
| Order: Gonyaulacales | |||||||||
| Family: Ceratiaceae | |||||||||
| Ceratium furca (Ehrenberg) Claparede et Lachmann | - | 2 | - | 9 | - | - | - | - | - |
| Ceratium fusus (Ehrenberg) Dujardin | - | - | - | 3 | - | - | - | - | - |
| Sub-total abundance(n) | - | 2 | - | 12 | - | - | - | - | - |
| No. of species | - | 1 | - | 2 | - | - | - | - | - |
| Class: Charophyta | |||||||||
| Order: Klebsormidiales | |||||||||
| Family: Elakatothricaceae | |||||||||
| Elakatothrix gelatinosa | - | - | - | - | 2 | - | - | - | - |
| Sub-total abundance(n) | - | - | - | - | 2 | - | - | - | - |
| No. of species | - | - | - | - | 1 | - | - | - | - |
| Class: Euglenophyta | |||||||||
| Order: Euglenales | |||||||||
| Euglena spirogyra | - | - | 2 | - | - | - | - | - | - |
| Trachelomonas volvocina | - | - | - | - | 2 | - | 1 | - | - |
| Sub-total abundance(n) | - | - | 2 | - | 2 | - | 1 | - | - |
| No. of species | - | - | 1 | - | 1 | - | 1 | - | - |
| Total taxa-S (No. of species) | 29 | 15 | 18 | 23 | 16 | 19 | 17 | 5 | 10 |
| Total individuals (abundance) | 157 | 104 | 172 | 284 | 304 | 128 | 189 | 35 | 31 |
| Shannon-H | 2.794 | 2.022 | 1.516 | 1.593 | 0.832 | 2.162 | 1.675 | 0.901 | 2.103 |
| Margalef | 5.538 | 3.014 | 3.303 | 3.895 | 2.624 | 3.709 | 3.052 | 1.125 | 2.621 |
| Equitability-J | 0.829 | 0.747 | 0.524 | 0.508 | 0.3 | 0.734 | 0.591 | 0.559 | 0.913 |
| Berger-parker index | 0.216 | 0.278 | 0.581 | 0.493 | 0.822 | 0.312 | 0.582 | 0.686 | 0.258 |
| Table 3: | Summary of total species in each class | |
| Taxonomic classes | Total number of species | Percentage (%) |
| Bacillariophyta | 49 | 72.1 |
| Cyanophyta | 13 | 19.1 |
| Dinophyta | 2 | 2.9 |
| Euglenophyta | 2 | 2.9 |
| Chlorophyta | 1 | 1.5 |
| Charophyta | 1 | 1.5 |
| Total | 68 | 100 |
| Table 4: | Numerical abundance and variation of the phytoplankton in part of Lagos Lagoon | |||||||||||||
| Phylum | St. 1 | St. 2 | St. 3 | St. 4 | St. 5 | St. 6 | St. 7 | St. 8 | St. 9 | Total No. | Percentage (%) | |||
| Bacillariophyta | 141 | 72 | 46 | 179 | 34 | 92 | 73 | 10 | 20 | 667 | 47.64 | |||
| Chlorophyta | - | - | - | - | 1 | - | - | - | - | 1 | 0.07 | |||
| Cyanophyta | 16 | 30 | 120 | 93 | 265 | 36 | 115 | 25 | 11 | 711 | 50.79 | |||
| Dinophyta | - | 2 | - | 12 | - | - | - | - | - | 14 | 1 | |||
| Charophyta | - | - | - | - | 2 | - | - | - | - | 2 | 0.14 | |||
| Euglenophyta | - | - | 2 | - | 2 | - | 1 | - | - | 5 | 0.36 | |||
| (N) | 1400 | 100 | ||||||||||||
| St. 1-9: Station 1-9 and N: Overall abundance | ||||||||||||||
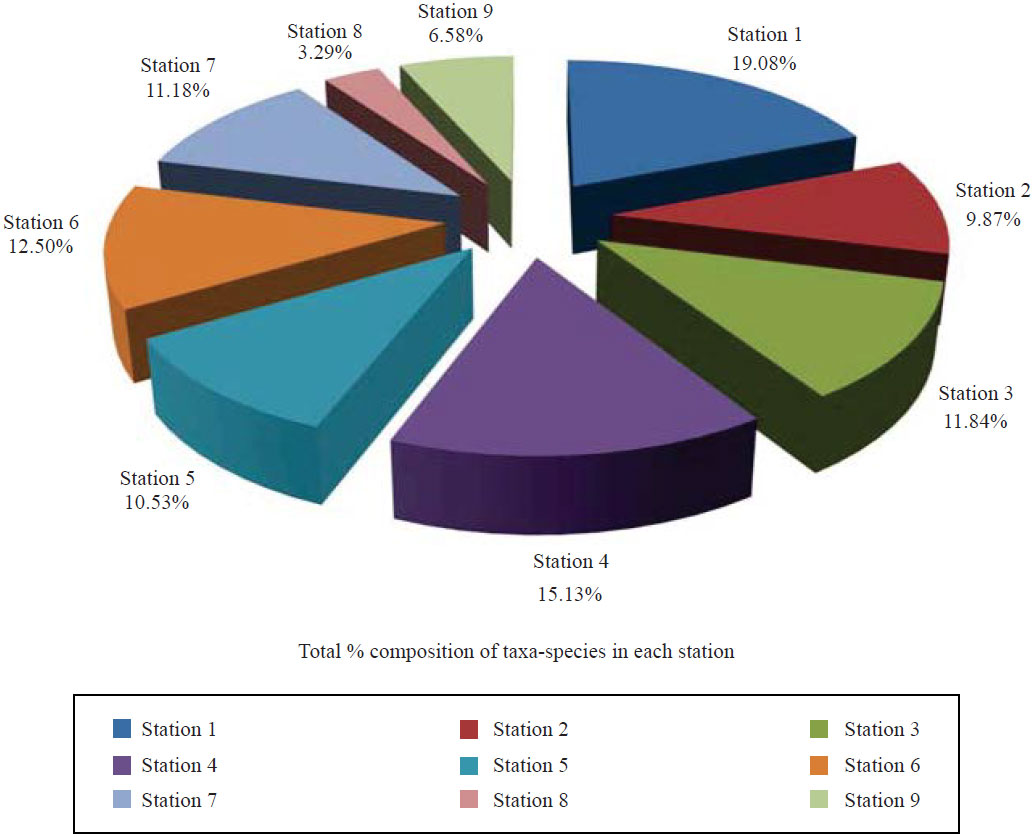 |
| Fig. 2: | Total percentage composition of taxa-species in each sampling station |
Biological characteristics
Phytoplankton community structure: The species composition, distribution and diversity of the phytoplankton communities are presented in Table 3. A total of 68 species were recorded during the studies. Bacillariophyceae had 49 species, representing 72.1% of the phytoplankton community, Cyanophyceae had 13 species representing 19.1%, Dinophyta had 2 species representing 2.9%, Euglenophyceae recorded two species also, accounting for 2.9%, Chlorophyta recorded one species, representing 1.5% and Charophyceae recorded also one specie, representing 1.5%. Bacillariophyta was the most diverse class, followed by Cyanophyceae, then Dinophyceae and Euglenophyceae, contributing equally to the phytoplankton community, followed by Chlorophyceae and Charophyceae.
Table 4 shows the part of Lagos Lagoons under study consisting of six different phylum of phytoplankton, their numerical abundance per station and total numerical abundance in the study. The numerical abundance and variation of the phytoplankton in part of Lagos Lagoon during the period of study are shown in Table 4.
The number of species found in each station had station one recording the highest percentage of phytoplankton communities in the sampling period (Fig. 2). Station eight recorded the lowest percentage number of different species of phytoplankton communities (Fig. 2) which invariably would be as a result of low dissolved oxygen in that station and thereby not enough oxygen to support life. Station five recorded the highest percentage of total phytoplankton abundance, considering number of species and individual phytoplankton abundance (Fig. 3), while station nine recorded the lowest percentage of individual phytoplankton abundance.
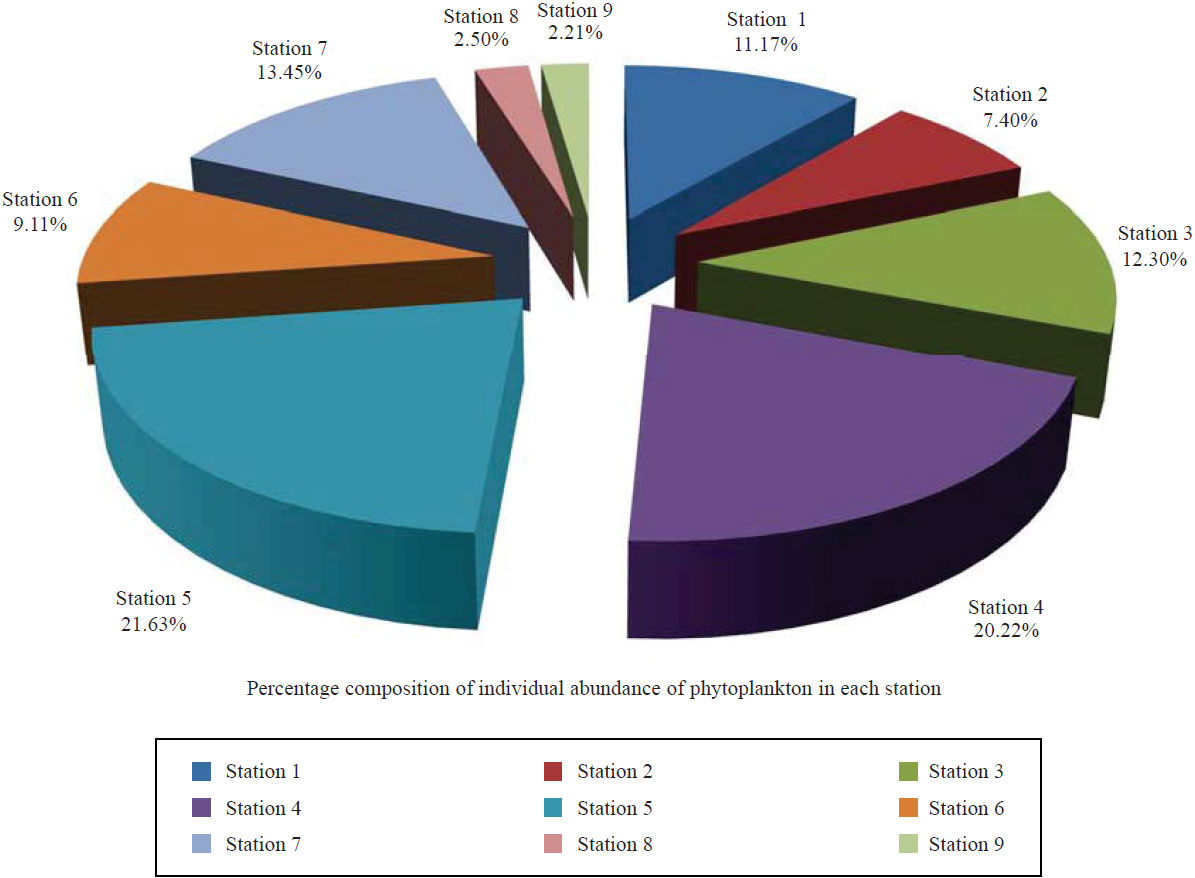 |
| Fig. 3: | Percentage composition of species and individual abundance of phytoplankton in Lagos Lagoons |
DISCUSSION
Temperature plays an important role in controlling the abundance of phytoplankton as it influences the lives of aquatic organisms and the physico-chemical parameters of the water body17. Temperature showed variation between seasons with the maximum recorded in Ajah during the sampling period at 31.4°C , while 28.9°C was the lowest recorded temperature at NIOMR JETTY, this could be attributed to the rainfall during that period.
Dissolved oxygen on average was highest in station 1 (NIOMR Jetty 7.39 mg L–1) and lowest in station 9 (APAPA II 4.35mg L–1) during the sampling period. This value in APAPA II is lower compared to the National Environment Standards and Regulations Agency (NESREA) limits of 5.0 mg L–1 for surface water. The low dissolved oxygen and high biological oxygen demand values recorded in APAPA ll are likely pointers to pollution stress the area is exposed to. Station 9 (Apapa ll) has in its surrounding environment a lot of industrial and municipal activities. The consequence generated waste and effluents are discharged into the surrounding water body, thus the decrease in dissolved oxygen. This agrees with the observation of Adesalu and Kunrunmi18 who worked on Tomaro and Ajegunle creek and suggested that low dissolved oxygen in that study site could be due to the water body receiving effluents containing oxygen-demanding substances, alongside domestic sewage. An inverse relationship was observed between phytoplankton and dissolved oxygen in station 9 (Apapa ll) and the dominant species in this station was Microcystis aeruginosa.
Turbidity was highest in station 6 (AJAH- 41.5 NTU) and lowest in station 3 (BONNY CAMP-18.25 NTU). The water samples were observed to be more turbid during the rainy season and the influx of particulate matters brought into the lagoon by surface run-off and flood must have caused the higher turbidity during this period and this agrees with the findings that re-suspension of dissolved materials due to surface run-off caused by the rains increases turbidity19.
Biochemical oxygen demand refers to the amount of oxygen used by microorganisms in the aerobic oxidation of organic matter, BOD is widely used to indicate the organic strength of the water. In the present study, a higher value of BOD was reported as 5.44 mg L–1 at station 7 SAGBO KOJI and the lowest at station 5 (LEKKI). The recorded high BOD values at station 7 (SAGBO KOJI), maybe due to the influx of organic sewage from anthropogenic activities, wastewater discharges and/or agricultural activities, inviting the presence of several microbes in the water body and accelerating metabolic activities with the increase in the concentration of organic matter and this is in total agreement with Khalid et al.20. Moreover, BOD levels between 1-2 mg L–1 or less signifies clean water, 4-7 mg L–1 denotes slightly or moderately polluted water and more than 8 mg L–1 denotes severe pollution21.
Relatively low values of nitrate were observed from this study and the concentration of nitrate varied averagely between 0.14-0.36 mg L–1, with the highest at station 4 (PARK VIEW) and lowest at station 7 (SAGBO KOJI). A similar observation of low nitrate level has been recorded22.
Sulphate enters into the water body from the catchment area through surface runoff. Generally, sulphate concentration was observed to be high during the study. In the study area, the minimum amount of sulphate was recorded in station 6 (AJAH 199.33 mg L–1), while station 2 (ATLAS COVE 652 mg L–1) recorded the highest amount of sulphate. The concentration of sulphate recorded in the study could be attributed to saline water intrusion and the absence of thiosulphate bacteria, that uses sulphate. Municipal drainage and industrial effluent could also contribute to the increased sulphate level recorded. However, the highest phosphate concentration was recorded in station 6 (Ajah- 12 mg L–1) and the lowest phosphate concentration was recorded in station 1 (NIOMR Jetty- 7,11 mg L–1).
Reactive silicate value was highest in station 9 (APAPA II) and lowest in station 1(NIOMR JETTY). The high silicate value recorded in the study site would have been as a result of an influx of land drainage that is rich in silicate into the sea, during the rains. The low silicate value observed in this study could be attributed to its uptake by phytoplankton for their biological activities. This can be seen in the higher phytoplankton biomass and recorded in station 1 (NIOMR JETTY), in comparison to a lower phytoplankton occurrence in station 9 (APAPA II) and this observation was in contrast with the work of Effiong and others23 who observed reactive silicate to be less in months with high phytoplankton biomass.
Relating to the number of species found in each station, station one (1) recorded the highest percentage of phytoplankton communities in the sampling period (Fig. 2), while station (8) recorded the lowest. This might have been as a result of the higher dissolved oxygen which is a pointer to increased photosynthensis rate by the phytoplankton in this station. This agrees with the findings of (Abolude et al., 2012)24, that a water body with a higher dissolved oxygen will support more life. Station eight (8) record of lowest percentage number of different species of phytoplankton communities would be as a result of low dissolved oxygen in that station and thereby no enough oxygen to support life. In terms of the number of specie and individual phytoplankton abundance, station five (5) recorded the highest percentage of total phytoplankton abundance present (Fig. 3), while station nine (9) recorded the lowest. The higher specie abundance recorded in station five (5) could be as a result of increased temperature, especially with the presence of the blue green algae which tolerate high temperature range25. The lowest percentage of specie abundance recorded in station nine (9) would have been as a result of the low dissolved oxygen to support aquatic life.
Phytoplankton plays an important role as producers in the aquatic ecosystem and are useful indicators of water quality. The phytoplankton community in this study was characterized by six classes and sixty-eight species. Their contribution in terms of species abundance are thus, Bacillariophyceae>Cyanophyceae>Dinophyceae and Euglenophyceae>Chlorophyceae and Charophyceae. Bacillariophyceae dominated the sampling period, with Coscinodiscus being the most abundant species and this in station 4 (park view). The abundance of Bacillariophyta in terms of species in this study could be attributed to the fact that it was observed their population increased with increased silica levels and other nutrients like phosphate and nitrate26. A similar observation of Bacillariophyceae as the dominant species in the Imo river have been recorded27. The predominance of diatoms in the study could be attributed to alkaline pH and high levels of the nutrient.
Cyanophyceae one of the major groups of phytoplankton is mostly confined to the freshwater zones. Twelve species of Cyanophyceae were recorded during the sampling period, with Microcystis aeruginosa being the most abundant species among them. The numerical dominance of Microcystis aeruginosa has been reported earlier in the South-Western part of Nigeria as being prevalent in freshwater conditions28. The relative abundance of Cyanophyceae in the study could be attributed to the alkaline condition, nutrient-rich freshwater discharge, high temperature and turbidity as a result of suspended solid that will enhance their growth13.
The class Dinophyceae was represented by two species Ceratium furca and Ceratium fusus. Their distribution is influenced by pH, salinity and temperature, as most of them are found in areas with marine influence29. Dinophyceae was few in abundance in this study. This could be as a result of their oligotrophic nature and their competitive rate with diatoms30. Euglenophyceae also was represented by two species in the study Euglena spirogyra and Trachelomonas volvocina. Representatives of this class inhabit both freshwater basins and marine waters and they are known to thrive in waters rich in organic matter that is also exposed to anthropogenic eutrophication31.
The class Chlorophyceae was represented by one species Scenedesmus brasiliensis. Their very low occurrence in the study area could be attributed to the influence of salinity as its occurrence was only in station 5 (Lekki), with a reduced salinity value. High turbidity value in the station, is also a limiting factor to its thriving and occurrence. Charophyceae was represented by one species Elakatothrix gelatinosa. Their low number of occurrences could be a result of increased turbidity which can rip them off with the strong tide and high nutrient concentration32.
The importance of species diversity indices in phytoplankton studies is their usage in the assessment of pollution and productivity of a water body. Examining the diversity in the range of polluted and unpolluted ecosystems, the Shannon-Weiner diversity index proposed that a diversity index greater than (>4) is clean water, between 3-4 is mildly polluted water and less than 2 is heavily polluted water33. However, the highest values of the Shannon-Wiener Index of 2.794 was recorded in station 1 (NIOMR JETTY), while the lowest value of 0.832 was recorded in station 5 (LEKKI). The Shannon-Wiener diversity index in this study ranged between 0.832-2.794 and is, therefore, implies that the water body is in between moderately polluted to highly polluted. Station 5 (LEKKI) with the lowest value of the Shannon-Weiner index also recorded the highest species density of Microcystis aeruginosa, which could contribute also to the pollution status of the station. Margalef’s indices have been used to determine the phytoplankton species richness and the index states that the index values greater than 3.0 signify clean water conditions, values less than 1.0 indicates severe pollution and intermediate values indicate moderate pollution34. Based on the overall values obtained in this study, some sections of the study area is being threatened by pollution as the Margalef value ranges between 1.13-5.54.
The equitability index is a measure of the evenness with which individuals are divided among the taxa. It reflects the equitable abundance of various species throughout the study period. The value lies between 0 and 1, 1 representing complete evenness. The closer the value to 1, the more even the population of phytoplankton species that makes up the community. In the present study, equitability ranged between 0.3-0.91 indicating that the phytoplankton was not evenly distributed, due to the dominance of two classes, Bacillariophyta and Cyanophyta. It was only in station 9 (APAPA II) and station I (NIOMR JETTY) that there was even distribution of the phytoplankton. It ranged between 0.3 in station 5 (LEKKI) and 0.913 in station nine (APAPA II).
CONCLUSION
This study showed the occurrence and diversity of phytoplankton are influenced by environmental variables within the Lagos Lagoon. Nutrients are discharged into the water body via anthropogenic activities and surface run-off. These factors alongside the presence of phytoplankton indicator species reveal the pollution level of the study area. The study revealed that the diatoms were more diverse in terms of phytoplankton species but the blue-green algae dominated in terms of phytoplankton density. Their abundance, alongside the occurrence of pollution indicator species such as Nitzschia, Navicula, Euglena, Spirogyra contributed adversely to the water quality. The occurrence of some of these indicator species also shows that activities that could pose a threat to the aquatic ecosystem like the indiscriminate discharge of municipal waste, discharge of untreated sewage and industrial effluents are ongoing and should be monitored so that both aquatic and human life will not be at risk.
SIGNIFICANCE STATEMENT
This study discovers the level of contamination and pollution threat of aquatic life in some parts of Lagos Lagoon. This novelty work has clearly defined the significance of species diversity indices in phytoplankton studies in the evaluation of water body productivity and pollution assessment. This study will help many other researchers to unearth the critical area of Lagos Lagoons that is under threat of pollution and possibly propose a way forward to mitigate it thus creating a new frontier.
REFERENCES
- Badejo, O.T., J.B. Olaleye and A.S. Alademomi, 2014. Tidal characteristics and sounding datum variation in Lagos State. Int. J. Innovative Res. Stud., 3: 436-457.
Direct Link - Nkwoji, J.A., I.C. Onyema and J.K. Igbo, 2010. Wet season spatial occurrence of phytoplankton and zooplankton in Lagos Lagoon, Nigeria. Sci. World J., 5: 7-14.
Direct Link - Amaeze, N.H. and C.J. Abel-Obi, 2015. Coastal dump sites in the Lagos Lagoon and toxicity of their leachate on brackish water shrimp (Palaemonetes africanus). J. Appl. Environ. Sci., 19: 503-510.
CrossRefDirect Link - Parmar, T.K., D. Rawtani and Y.K. Agrawal, 2016. Bioindicators: The natural indicator of environmental pollution. Front. Life Sci., 9: 110-118.
CrossRefDirect Link - Puerta, P., C. Johnson, M. Carreiro-Silva, L.A. Henry and E. Kenchington et al., 2020. Influence of water masses on the biodiversity and biogeography of deep-sea benthic ecosystems in the North Atlantic. Front. Mar. Sci., Vol. 7.
CrossRefDirect Link - Tweddle, J.F., M. Gubbins and B.E. Scott, 2018. Should phytoplankton be a key consideration for marine management? Mar. Policy, 97: 1-9.
CrossRefDirect Link - Nkwoji, J.A., S.I. Ugbana and M.Y. Ina-Salwany, 2020. Impacts of land-based pollutants on water chemistry and benthic macroinvertebrates community in a Coastal Lagoon, Lagos, Nigeria. Sci. Afr., Vol. 7.
CrossRefDirect Link - Crossetti, L.O., V. Becker, L. de Souza Cardoso, L.R. Rodrigues, L.S. da Costa and D. da Motta-Marques, 2013. Is phytoplankton functional classification a suitable tool to investigate spatial heterogeneity in a subtropical shallow lake? Limnologica, 43: 157-163.
CrossRefDirect Link - Otero, J., X.A. Álvarez-Salgado and A. Bode, 2020. Phytoplankton diversity effect on ecosystem functioning in a coastal upwelling system. Front. Mar. Sci., Vol. 7.
CrossRefDirect Link - Sharma, R.C., N. Singh and A. Chauhan, 2016. The influence of physico-chemical parameters on phytoplankton distribution in a head water stream of garhwal himalayas: A case study. Egypt. J. Aquat. Res., 42: 11-21.
CrossRefDirect Link - Edoreh, J.A., C.U. Inegbenosun, I.O. Elimhingbovo and T.O.T. Imoobe, 2019. Spatial and temporal variation in physico-chemical parameters at Ugbevwe Pond, Oghara, Delta State. Trop. Freshwater Biol., 28: 141-157.
CrossRefDirect Link - Duarte, P., M.F. Macedo and L.C. da Fonseca, 2006. The Relationship Between Phytoplankton Diversity And Community Function In A Coastal Lagoon. In: Marine Biodiversity, Martens, K., H. Queiroga, M. R. Cunha, A. Cunha, M. H. Moreira (Eds.), Springer, Netherlands, ISBN-13: 978-1-4020-4697-1, pp: 3-18.
CrossRefDirect Link - Bhateria, R. and D. Jain, 2016. Water quality assessment of lake water: A review. Sustainable Water Resour. Manage., 2: 161-173.
CrossRefDirect Link - Emmanuel, B.E. and I.C. Onyema, 2007. The plankton and fishes of a tropical creek in South Western Nigeria. Turk. J. Fish Aquat. Sci., 7: 105-113.
Direct Link - Ogbeibu, A.E., 2005. Biostatistics-A Practical Approach to Research and Data Handling. 1st Edn., Mindex Press, Benin City, Nigeria, Pages: 276.
Direct Link - Hammer, Ø. and D. Harper, 2005. Paleontological data analysis. Geol. Mag., 143: 554-554.
CrossRefDirect Link - Smitha, P.S. and G.V. Venkataramana, 2013. Zooplankton diversity of Chikkadevarayana canal in relation to physico-chemical characteristics. J. Environ. Biol., 34: 819-824.
Direct Link - Adesalu, T. and O. Kunrunmi, 2012. Effects of physico-chemical parameters on phytoplankton of a tidal creek, Lagos, Nigeria. J. Environ. Ecol., 3: 116-136.
CrossRefDirect Link - Zhou, P., G. Wang and R. Duan, 2020. Impacts of long-term climate change on the groundwater flow dynamics in a regional groundwater system: Case modeling study in Alashan, China. J. Hydrol., Vol. 590.
CrossRefDirect Link - Khalid, S., M. Shahid, Natasha, I. Bibi, T. Sarwar, A. Shah and N. Niazi, 2018. A review of environmental contamination and health risk assessment of wastewater use for crop irrigation with a focus on low and high-income countries. Int. J. Environ. Res. Public Health, Vol. 15.
CrossRefDirect Link - Rim-Rukeh, A. and L.E. Agbozu, 2013. Impact of partially treated sewage effluent on the water quality of recipient Epie Creek Niger Delta, Nigeria using Malaysian water quality index (WQI). J. Appl. Sci. Environ. Manage., 17: 5-12.
Direct Link - Davidson, J., C. Good, C. Welsh, S.T. Summerfelt, 2014. Comparing the effects of high vs. low nitrate on the health, performance, and welfare of juvenile rainbow trout Oncorhynchus mykiss within water recirculating aquaculture systems. Aquacult. Eng., 59: 30-40.
CrossRefDirect Link - Effiong, K.S., A.I. Inyang and U.U. Robert, 2018. Spatial distribution and diversity of phytoplankton community in Eastern Obolo River Estuary, Niger Delta. J. Oceanogr. Mar. Sci., 9: 1-14.
CrossRefDirect Link - Abolude, S.D., A.M. Chia, A.S. Yahaya and D.C. Okafor, 2012. Phytoplankton diversity and abundance as a function of water quality for fish production: A case study of two man-made reservoirs in Zaria, Nigeria. Trop. Freshwater Biol., 21: 41-58.
CrossRefDirect Link - Dhanam, A., Sathya and B. Elayaraj, 2016. Study of physico-chemical parameters and phytoplankton diversity of ousteri lake in puducherry. World Sci. News WSN, 54: 153-164.
Direct Link - Bode, A., M.G. Estévez, M. Varela and J.A. Vilar, 2015. Annual trend patterns of phytoplankton species abundance belie homogeneous taxonomical group responses to climate in the NE Atlantic upwelling. Mar. Environ. Res., 110: 81-91.
CrossRefDirect Link - Ogbuagu, D.H. and A.A. Ayoade, 2012. Seasonal dynamics in plankton abundance and diversity of a freshwater body in Etche, Nigeria. Environ. Nat. Resour. Res., 2: 48-59.
CrossRefDirect Link - Onyema, I.C. and A.A. Ojo, 2008. The zooplankton and phytoplankton biomass in a tropical creek, in relation to water quality indices. Life Sci. J., 5: 75-82.
CrossRefDirect Link - Cremer, H., D. Gore, N. Hultzsch, M. Melles and B. Wagner, 2004. The diatom flora and limnology of lakes in the Amery Oasis, East Antarctica. Polar Biol., 27: 513-531.
CrossRefDirect Link - Fonge B.A., A.S. Tening, E.A. Egbe, G.S. Yinda, A.N. Fongod and R.M. Achu, 2012. Phytoplankton diversity and abundance in Ndop wetland plain, Cameroon. Afr. J. Environ. Sci. Technol., 6: 247-257.
CrossRefDirect Link - Ajayan, A.P. and K.G.A. Kumar, 2017. Phytoplankton as biomonitors: A study of Museum Lake in Government Botanical Garden and Museum, Thiruvananthapuram, Kerala India. Lakes Res.: Res. Manage., 22: 403-415.
CrossRefDirect Link - Kumari, S.P., S. Gayathri and R.M. Mohan, 2018. Phytoplankton diversity in bangalore lakes, importance of climate change and nature’s benefits to people. J. Ecol. Nat. Resour., Vol. 2.
CrossRefDirect Link - Shekhar, T.R.S., B.R. Kiran, E.T. Puttaiah, Y. Shivaraj and K.M. Mahadevan, 2008. Phytoplankton as index of water quality with reference to industrial pollution. J. Environ. Biol., 29: 233-236.
Direct Link - Yusuf, Z.H., 2019. Benthic macroinvertebrates diversity as bioindicators of water quality of Nasarawa Reservoir Katsina State Nigeria. Bayero J. Pure Appl. Sci., 12: 449-456.
CrossRefDirect Link