

Turki Abdullah Alanazi
Othman Yeop Abdullah Graduate School of Business,University Utara Malaysia, Kedah, 06010, Malaysia
Asmat Nizam Abdul Talib
Othman Yeop Abdullah Graduate School of Business,University Utara Malaysia, Kedah, 06010, Malaysia
Hasbullah Ashari
Othman Yeop Abdullah Graduate School of Business,University Utara Malaysia, Kedah, 06010, Malaysia
Rabiul Islam
School of Economics, Finance and Banking, College of Business, University Utara Malaysia, Kedah, 06010, Malaysia
Journal of Applied Sciences
Year: 2015 | Volume: 15 | Issue: 2 | Page No.: 240-247





ABSTRACT
The present study designated the impact of teamwork quality on New Product Development (NPD) cycle time through the moderated environmental turbulence in the telecommunication industry in Saudi Arabia. The aim of this study was to obtain the moderating effect of environmental turbulence on new product development cycle time in the telecom industry. Random sampling was used to select respondents for a survey. The PLS-SEM was used to analyze the direct and indirect relationships between teamwork quality, environmental turbulence and NPD cycle time while path coefficient and assessment of measurement and structural model used to test the research hypotheses. Findings indicated that environmental turbulence moderated the relationship between two factors of teamwork quality, namely, communication and coordination and NPD cycle time. Environmental turbulence did not moderate balance of member contribution, mutual support, effort and cohesion. The study also provides a theoretical understanding of how teamwork qualities drive new product development cycle time.
PDF Abstract XML References Citation
Article History
Received: September 11, 2014;
Accepted: November 05, 2014;
Published: December 06, 2014
How to cite this article
Turki Abdullah Alanazi, Asmat Nizam Abdul Talib, Hasbullah Ashari and Rabiul Islam, 2015. Moderating Effect of Environmental Turbulence on New Product Development Cycle Time in the Telecom Industry. Journal of Applied Sciences, 15: 240-247.
DOI: 10.3923/jas.2015.240.247
URL: https://scialert.net/abstract/?doi=jas.2015.240.247
DOI: 10.3923/jas.2015.240.247
URL: https://scialert.net/abstract/?doi=jas.2015.240.247
INTRODUCTION
The construct of teamwork quality along with its measures was investigated in empirical research conducted by Easley et al. (2003), Hoegl et al. (2004) and Hsu et al. (2012). With regards to high teamwork quality, team members often practice open communication regarding task materials (Hauptman and Hirji, 1996), activities, coordination (Adler, 1995; Faraj and Sproull, 2000) and contribute their knowledge (Seers, 1989). They also practice mutual support among them in discussions and individual tasks (Cooke and Szumal, 1994), lay down and sustain standards of great effort (Weingart, 1992) and encourage team cohesion (Gully et al., 1995). Therefore, different levels teamwork quality can have varying impacts on project performance (Hoegl and Gemuenden, 2001).
In this study, Hoegl and Gemuendens (2001) teamwork quality (TWQ) model was chosen as a basis for this study because it is one of the prominent models in teamwork and is regularly applied to explain the phenomenon. Six dimensions are shown in the following:
| • | Communication |
| • | Coordination |
| • | Balance of Member Contributions |
| • | Mutual Support |
| • | Effort |
| • | Cohesion |
There are a number of reasons to expect that group cohesion may also be an important antecedent of NPD cycle time. First, when group cohesion is high, there is a motivation to improve the performance of the team (Mullen and Copper, 1994) which positively a ffects the NPD cycle time. Second, a cohesive team also provides more opportunities for team members to interact with each other (Ehrhart and Naumann, 2004). The frequent interaction may allow them to observe each other’s team and improve the NPD processes. Based on the multidimensional model Carron et al. (1985) studied the relationship between group cohesion and performance. A direct relationship between specific dimensions of group cohesiveness and performance was found. Cohesion was indicated to be an antecedent of performance. In their meta analytic study, Beal et al. (2003) showed that cohesion wass related to team performance and NPD cycle time (effectiveness and efficiency). However, Mullen and Copper (1994), in their meta analytic study, revealed disagreements on the relationship between group cohesion and performance. They concluded that the relationship between cohesion and performance is significant but small.
Depending on the industry they compete in, firms need to continuously engage in new product development in order to remain competitive. New products or improved products are not sufficient for a competitive environment that is modern knowledge-based. New Product Development (NPD) must be complemented with the rapid introduction of new or significantly improved products in order to prevent obsolescence. The following sections address the definition of NPD and then introduce the construct of NPD cycle time including its measurement and reduction techniques.
The first new school of thought focuses on how to enhance the structured NPD process. Cooper and Kleinschmidt (1995) also agreed that a structured process should be abided by; however, they added that stages can be combined or even skipped. They emphasized that a NPD process should still encompass the structured approach; however, they did stress that the activities within each stage need not be fully executed prior to proceeding through a "gate". This first school of thought is referred to as the "flexible school of thought". Improvisation is the second school of thought. It is the extreme case of flexibility. In the "Improvisation school of thought", there are no structured frameworks that the NPD process follows. Due to frazzled structures, it causes NPD teams to improvise throughout the progression of each project. Moorman and Miner (1998), among others, believed that improvisation can have an affirmative effect on new product outcomes.
A new product development cycle time is critical because life cycles are shrinking and obsolescence is occurring more quickly than in the past while competition has intensified (Griffin, 1997). In today’s world economy, regardless of the industry, organizations are searching for new ways to compete more effectively and efficiently. In their efforts to do so, they are confronted with numerous competitive challenges. It is no longer sufficient to meet the traditional requirements of product cost, performance, quality and dependable delivery.
In order to be able to measure the actual steps of the development process, Griffin (1997) used project timing, which chronicle(s) the dates when various phases of development (begin). As mentioned already, Griffin (1997) measured NPD cycle time in terms of time-to-market, concept-to-customer and development time. Each one of the time variables begin with different stages of the NPD process, but the series of activities of interest end just before the product launch stage begins, which Kumar et al. (1994) called the production stage of the NPD process, for the purpose of treating time as an internal variable. The stages described here become easier to measure as the development process moves forward. The earliest stages are the most difficult to uncover. Stages 0 and 1 are usually estimates kept informally with marketing or planning groups. The transition from stage 0 to stage 1 is especially fuzzy (general uncertainties of start dates). Conversely, Stages 2, 3 and 4, are usually recorded in logbooks kept by design/development or manufacturing (Griffin, 1993, 1997). Now that the stages have been identified, the time variables are defined in Table 1.
The initial duration of a five product development phases are needed for every project. The first stage (Stage 0) is referred to as the concept generation stage. This is followed by Stage 1 which is the project evaluation where approval of product strategy and target market is sealed and the project is given a green light for specifications development. The actual times for the initiation of Stages of 0 and 1 are sometimes unsure as the idea may just be juggled around in marketing or development for some time without employment. The initial step of some projects may be listed down with clarity in memorandums bringing forward the idea or in case of a project conducted to satisfy competitor’s entry, the data the other product was publicized in the market. This is followed by Stage 2 where the first R and D money was spent on physical product development. Stage 3 is the manufacturing development where the documentation takes place concerning the development of the processes. This is followed by Stage 4 that concerns commercialization in this phase, the manufacturing production trials are initiated. The initial dates are procured easily from the time sheets of engineering and manufacturing as well as business memorandums.
Research concerning moderators of the market orientation-new product development has primarily concentrated on the moderating role of environmental conditions (Schweitzer et al., 2011). Three widely acknowledged factors that comprise environmental conditions are market turbulence, technological turbulence and competitive intensity (Aziz and Yassin, 2010; Schweitzer et al., 2011).
| Table 1: | Phase timing variables |
 | |
| Source: Griffin (1993) | |
Previous studies showed that environmental conditions influence the internal market orientation and performance link (Kirca et al., 2005). These three environmental factors have important roles in determining the strategic orientation of afirm within the high tech division (Su et al., 2010). This study concentrates on effect of technological turbulence, competition turbulence, as well as market turbulence on:
| • | Technological turbulence |
| • | Competition turbulence |
| • | Market turbulence |
In the past several years, telecommunication workers have been tackling changes in the environment (Garrett and McDaniel, 2001). Complex work environments call for worker flexibility in adapting various client needs and adapting to the environment particularly in telecommunication organizations. According to a previous study, Environmental Turbulence (ET) refers to the individuals’ interaction with their environment in reaction to instability and dynamic changes in their internal or external environment or both that are influenced by the individuals/groups or organization’s attributes and that has the potential to eventually influence patient and nursing outcomes.
A case that established the impact of environmental turbulence on individual teamwork took place in the 1980s when ET was integrated into healthcare environment as part of the restructuring of patient care delivery system that came with a decrease in hospital funding (Tillman et al., 1997). Internal and external environmental factors in healthcare may be characterized by instantaneous and unpredictable changes that alter the patients, units and the resources’ characteristics (e.g., equipment, money and number of nurses). The internal environment refers to the forces operating external to the organization to which it is susceptible to (i.e., regulatory groups, personal issues, customers, suppliers and market and resource competition). Some environmental issues that complicate nurses’ work include missing information, lack of resources, missing medications and equipment, defective equipment and lack of communication and team work ingrained in the culture.
Furthermore, the internal environment was revealed to influence job satisfaction, which in turn was related to patient outcomes. Specifically, emotional exhaustion, which is a component of burnout (Garrett and McDaniel, 2001) has been linked to unsafe work environments. This condition is often an outcome of long-term involvement in emotionally draining situations and the ineffective handling of long-term stress. Nurses that have been in profession for a long time were found to be more susceptible to burnout and were at a greater risk of quitting (Ebright et al., 2004).
The external environment may develop turbulence in the form of the creation of countless rules, unrealistic mandates, or decreasing reimbursement or the combination of all. This turbulence may adversely affect the internal environment, which in turn may develop changes in the external environment. Additionally, the internal environment may also change and thus create perceived environmental uncertainty and add to the turbulence (Aiken et al., 2002).
It has been hypothesized that teamwork quality affects the new product development cycle time which itself has been linked to better organizational performance. The first theory upon which the framework is grounded is resource-based view founded by Wernerfelt (1984) and popularized by Barney (1991). The second theory is contingency theory, which explains the moderator variable in the framework. Based on this theory, it is proposed that performance is a condition to the relationship of an organization and its external environment (Duncan, 1972; Gresov, 1989; Weiss and Heide, 1993). The third one is internal market orientation theory founded by Lings and Greenley (2005), which explains the mediating influence of internal market orientation.
So, the present study aims to obtain the moderating effects of enviromental turbulence on new product development time in the telecom industry.
MATERIALS AND METHODS
Sampling procedure: The principal idea of sampling is to demonstrate that by selecting some of the elements in a defined target population, a conclusion about the entire population can be drawn (Hair et al., 2000). Figure 1 shows the four stages of the sampling procedure which was adopted from Cooper and Schindler (2006). First, a defined target population for investigation was identified. Second, the sampling frame which lists all eligible population elements from which the sample was drawn was determined. Third, the sampling method was identified. Last, the appropriate sample size was decided upon.
Moderating variable: Environmental factors is the moderator variable in the present study. Environmental turbulence is operationally defined by three dimensions: Technological, competitive and market turbulence.
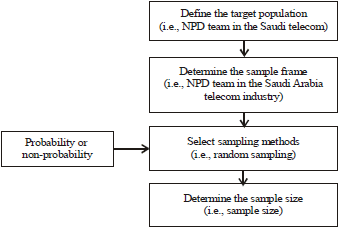 | |
| Fig. 1: | Sampling design process |
| Table 2: | Items to measure environmental turbulence |
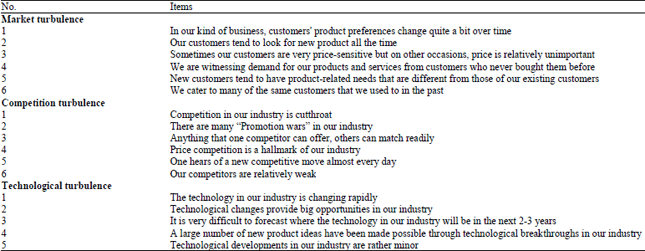 | |
The instrument used to measure environmental turbulence was adopted from Jaworski and Kohli (1993) and it was reported to have a high validity score of internal reliability market turbulence, competitive turbulence and technological turbulence found the scales had high internal reliability (Cronbach’s alpha = 0.68, 0.81 and 0.88 respectfully). This instrument was widely used in many types of industry and it is felt that it has no problem to be used in the context of Saudi telecommunication study.
The scale comprises five items. The technological turbulence scale items assess the extent to which a firm perceives that technology in an industry was in a state of flux. All items were scored on a seven-point scale, ranging from ‘1’ "Strongly disagree" to ‘7’ "Strongly agree". Competitive turbulence was measured using a six-item scale developed by Jaworski and Kohli (1993). The competitive turbulence scale items assess the extent to which a firm perceives competition in its industry. All items were scored on a seven-point scale, ranging from ‘1’ "Strongly disagree" to ‘7’ "Strongly agree". Finally, the market turbulence construct was measured using a six-item scale developed by Jaworski and Kohli (1993). The market turbulence scale items assess the extent to which a firm perceives its customers’ changing desires and habits in the market. All items were scored on a seven-point scale ranging from ‘1’ "Strongly disagree" to ‘7’ "Strongly agree." A complete scale of items used to assess environmental turbulence is presented in Table 2.
RESULTS
Structural model: Following the assessment of the measurement model, the researcher evaluated the structural model in order to examine the constructs’ relationships as provided in the theoretical framework in another chapter. Examining the structural model enables the assessment of its explanatory power. In other words, how much variance in the dependent variable(s) of interest can be independent variables explain or account for is the main objective of this analysis. This section presents the results of the hypothesis testing based on the hypothesis developed in the earlier chapter. To test the hypotheses, a two pronged analysis which comprises conventional statistical analysis using SPSS and Structural Equation Modelling (SEM) using Partial Least Squares (PLS) was employed.
Smart PLS 2.0 (Ringle et al., 2005) yielded two critical pieces of information, which indicates how well the structural model predicts the hypothesized relationships. The first piece of information was the coefficient of determination (R2) for each endogenous construct in the theoretical framework. This value measures the percentage variation explained by the model (Wixom and Watson, 2001). The PLS structural model and hypotheses were assessed by examining path coefficients (similar to standardized beta weights in a regression analysis) and their significance levels.
Direct effect in the main model: The proposed model first examined the impact the direct relationship in the structural model. Second, the proposed model examines the effect of the mediating relationship in the structural model. Third, the proposed model examines the effect of the moderating relationship in the structural model. The data was run through two software packages of PLS. This path modeling encapsulates the relationship effect size and the overall ability to predict BPS on BRQ. The examination of the structural model also allows the inspection of various paths (arrows moving from one construct to another) in the research model. Each structural path in the research model represents a proposed hypothesis. The analysis of the structural model results in the acceptance (supported) or rejection (not supported) of each hypothesis as well as the comparisons of the impact of various independent constructs on the dependent one(s).
Paths are considered as standardized beta (β) weights that are identical to the analysis of simple regression (Agarwal and Krahanna, 2000). According to Chin (1998), the standardized paths have to be at least 0.20 but ideally, they have to be above 0.30 to be deemed as meaningful.
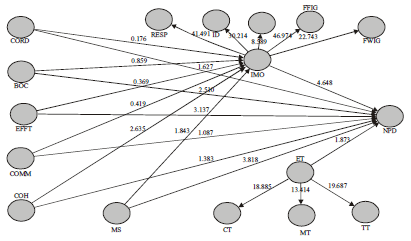 | |
| Fig. 2: | Assessment of the structural model |
| Table 3: | Path coefficients of the structural model |
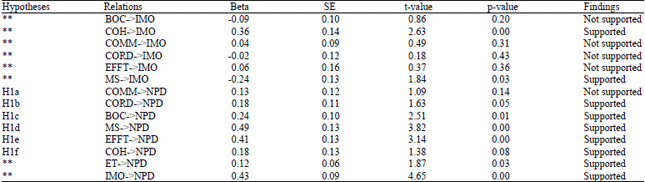 | |
| **p<0.05, (one-tailed test). BOC: Balance of member contribution, COH: Cohesion, COMM: Communication, CORD: Coordination, EFFT: Effort, MS: Mutual support, ET: Environmental turbulence, IMO: Internal market orientation, NPD: New product development cycle time | |
| Table 4: | Effect size (Moderation model) |
 | |
On the other hand, Cohen (1988) categorized standard path coefficients having absolute values of lower than 0.10 as possessing "small" effect, values of 0.30 as having a "medium" effect and values greater than 0.50 as having "large" effects.
The assessed structural model is presented in Fig. 2 and the results of the hypotheses tests are listed in Table 3.
Moderation of effect size: The strength of the moderating of environmental turbulence on the new product development cycle time was determined by calculating the effect size f2 based on Cohen (1988) recommendations in which the coefficient of determination (R2) of the main effect with the coefficient (R2) for total effect was xompared. As indicated in Table 4, the f2 value of 0.08 can be considered as having a small effect.
However, according to Chin et al. (2003), a small effect size does not necessarily mean that the underlying moderating effect is negligible. "Even a small interaction effect can be meaningful and then it is important to take these conditions into accounts" (Chin et al., 2003).
DISCUSSION
Result indicated that environmental turbulence moderated the relationship between the two dimensions of teamwork quality (communication and coordination) and new product development cycle time. This result is partially consistent with the argument that in turbulent environments, adopting a customer-focused vision is not as important owing to the many innovations that arise within a short period of time from R and D working external to the industry. The result also supports Dayan and Basarir (2010) finding that showed a relationship between team reflexivity, a reflection of teamwork quality and NPD cycle time, referred to as ‘speed to market’ in their study. The researchers reported a moderating influence of environmental turbulence on the team reflexivity and NPD speeds to market.
The moderating effect of competitor turbulence also indicates that this turbulence can be helpful for new product development and this is consistent with several studies that found that competitor knowledge was associated and moderated by the new product advantage (Li and Calantone, 1998; Augusto and Coelho, 2009). In environments rife with competition, consumers are free to select from a greater range of market offers. As a result, monitoring customers’ needs is a crucial issue to guarantee that customers refrain from choosing rival products. This calls for stronger focus on competitors as this would lead to the identification of customer wants and needs and the anticipation of changes in the product strategies of rivals. As for the coordination, intensity of competition is likely to weaken its relationship with product development cycle duration, owing to the competitive environments requirement of timely decision making and coordination and owing to its consensus decision style’s barrier to responses.
While the result showed a moderating effect of environmental turbulence on communication, coordination, it did not moderate the relationship between balances of contribution, efforts, mutual support and cohesion and new product development cycle time in the telecommunication industry in Saudi Arabia. This result is not in line with that reported by Gatignon and Xuereb (1997) who revealed a positive moderating effect of environmental potential, such that a stronger market orientation was required in a fast growing market to achieve the desired level of performance. In addition, Han et al. (1998) revealed a positive moderating effect of high market growth on the link between team members and organizational creativity. In addition, this result is not consistent with Song and Parry (1997) that supports the view that high market potential strengthens the relationship between product differentiation and new product performance.
This result is valid because the market is highly organized and strongly controlled by Communication and Information Technology Commission (CITC) to ensure a fair competition in the market. In addition, some of the products are developed globally and local operators have the same chance to introduce this product in the local market. In addition, firms and their management must try to cope with turbulent conditions. To do so adequately requires the ability to adapt to changes. It also requires firms to continuously collect and analyze environmental data as emphasized in the market orientation construct.
In sum, environmental turbulence was found to moderate the relationship between the two dimensions of communication and coordination on NPD cycle time but no moderating effect of environmental turbulence on the relationship between balance of contribution, effort, mutual support and cohesion and NPD cycle time was observed. One of the main reasons why the first set of dimensions were found to have a moderating influence is that this set is related to the competition in the market which is highly influenced by the environment. On the other hand, the latter set of dimensions is related to the internal processes between the employees which are not influenced by the environment outside the workplace.
CONCLUSION
Since teamwork is essential to New Product Development (NPD) cycle time, managers need to be concerned about how to improve team effectiveness so that it reduces new product development cycle time. Managers vigilant about launching new products should facilitate an environment conducive to teamwork to realize superior course of reflective activities.
The study has also provided managers with some insight and understanding of some of the strategic behaviors that drive processes and procedures of new product development in organizations. Result indicated that firms that had a greater internal market orientation applied in process of new product development would be more creative and fast to introduce new products to the market. Therefore, it is recommended that firms develop appropriate internal market orientation to new product development process by understanding current customers’ latent needs and current competitors' future strategies. Thus, this study supports the contention that, because of its proactive nature, a future-market focus leaves more space for creativity than a current-market focus by encouraging managers to broaden their horizons and think outside the box. Firms should then try to develop a market orientation that would drive smooth learning in the business concerning the various needs of customers, anticipating competitors’ actions and using market information in a business-like way.
ACKNOWLEDGMENT
The authors are thankful to Dr. Faridahwati Mohd Shamsudin for her constant help and motivation for this study.
REFERENCES
- Adler, P.S., 1995. Interdepartmental interdependence and coordination: The case of the design/manufacturing interface. Organiz. Sci., 6: 147-167.
Direct Link - Aiken, L.H., S.P. Clarke, D.M. Sloane, J. Sochalski and J.H. Silber, 2002. Hospital nurse staffing and patient mortality, nurse burnout and job dissatisfaction. J. Am. Med. Assoc., 288: 1987-1993.
CrossRefPubMedDirect Link - Augusto, M. and F. Coelho, 2009. Market orientation and new-to-the-world products: Exploring the moderating effects of innovativeness, competitive strength and environmental forces. Ind. Market. Manage., 38: 94-108.
CrossRefDirect Link - Aziz, N.A. and N.M. Yasin, 2010. How will market orientation and external environmnet influence the performance among SMEs in the agri-food sector in Malaysia? Int. Bus. Res., 3: 154-164.
CrossRefDirect Link - Barney, J.B., 1991. Firm resources and sustained competitive advantage. J. Manage., 17: 99-120.
CrossRefDirect Link - Beal, D.J., R.R. Cohen, M.J. Burke and C.L. McLendon, 2003. Cohesion and performance in groups: A meta-analytic clarification of construct relations. J. Applied Psychol., 88: 989-1004.
CrossRefPubMedDirect Link - Chin, W.W., B.L. Marcolin and P.R. Newsted, 2003. A partial least squares latent variable modeling approach for measuring interaction effects: Results from a Monte Carlo simulation study and an electronic-mail emotion/adoption study. Inform. Syst. Res., 14: 189-217.
CrossRefDirect Link - Cohen, J., 1988. Statistical Power Analysis for the Behavioral Sciences. 2nd Edn., Routledge, New Jersey, USA., ISBN: 9780203771587 Pages: 567.
CrossRefDirect Link - Cooke, R.A. and J.L. Szumal, 1994. The impact of group interaction styles on problem-solving effectiveness. J. Applied Behav. Sci., 30: 415-437.
CrossRefDirect Link - Cooper, R.G. and E.J. Kleinschmidt, 1995. Benchmarking the firm's critical success factors in new product development. J. Prod. Innov. Manage., 12: 374-391.
CrossRefDirect Link - Dayan, M. and A. Basarir, 2010. Antecedents and consequences of team reflexivity in new product development projects. J. Bus. Ind. Market., 25: 18-29.
CrossRefDirect Link - Duncan, R.B., 1972. Characteristics of organizational environments and perceived environmental uncertainty. Admin. Sci. Quart., 17: 313-327.
CrossRefDirect Link - Easley, R.F., S. Devaraj and J.M. Crant, 2003. Relating collaborative technology use to teamwork quality and performance: An empirical analysis. J. Manage. Inform. Syst., 19: 247-265.
CrossRefDirect Link - Ebright, P.R., L. Urden, E. Patterson and B. Chalko, 2004. Themes surrounding novice nurse near-miss and adverse-event situations. J. Nurs. Admin., 34: 531-538.
Direct Link - Ehrhart, M.G. and S.E. Naumann, 2004. Organizational citizenship behavior in work groups: A group norms approach. J. Applied Psychol., 89: 960-974.
CrossRefDirect Link - Faraj, S. and L. Sproull, 2000. Coordinating expertise in software development teams. Manage. Sci., 46: 1554-1568.
CrossRefDirect Link - Garrett, D.K. and A.M. McDaniel, 2001. A new look at nurse burnout: The effects of environmental uncertainty and social climate. J. Nurs. Admin., 31: 91-96.
Direct Link - Gatignon, H. and J.M. Xuereb, 1997. Strategic orientation of the firm and new product performance. J. Market. Res., 34: 77-90.
CrossRefDirect Link - Gresov, C., 1989. Exploring fit and misfit with multiple contingencies. Admin. Sci. Quart., 34: 431-453.
CrossRefDirect Link - Griffin, A., 1993. Metrics for measuring product development cycle time. J. Prod. Innov. Manage., 10: 112-125.
CrossRefDirect Link - Griffin, A., 1997. PDMA research on new product development practices: Updating trends and benchmarking best practices. J. Prod. Innov. Manage., 14: 429-458.
CrossRefDirect Link - Gully, S.M., D.J. Devine and D.J. Whitney, 1995. A meta-analysis of cohesion and performance: Effects of level of analysis and task interdependence. Small Group Res., 26: 497-520.
CrossRefDirect Link - Hair, J.F., R.P. Bush and D.J. Ortinau, 2000. Marketing Research: A Practical Approach for the New Millennium. McGraw-Hill, New York, USA., ISBN-13: 9780256195552, Pages: 682.
Direct Link - Han, J.K., N. Kim and R.K. Srivastava, 1998. Market orientation and organizational performance: Is innovation a missing link? J. Market., 62: 30-45.
CrossRefDirect Link - Hauptman, O. and K.K. Hirji, 1996. The influence of process concurrency on project outcomes in product development: An empirical study of cross-functional teams. IEEE Trans. Eng. Manage., 43: 153-164.
CrossRefDirect Link - Hoegl, M. and H.G. Gemuenden, 2001. Teamwork quality and the success of innovative projects: A theoretical concept and empirical evidence. Organiz. Sci., 12: 435-449.
CrossRefDirect Link - Hoegl, M., K. Weinkauf and H.G. Gemuenden, 2004. Interteam coordination, project commitment and teamwork in multiteam R&D projects: A longitudinal study. Organiz. Sci., 15: 38-55.
CrossRefDirect Link - Hsu, J.S.C., S.P. Shih, J.C. Chiang and J.Y.C. Liu, 2012. The impact of transactive memory systems on IS development teams' coordination, communication and performance. Int. J. Project Manage., 30: 329-340.
CrossRefDirect Link - Jaworski, B.J. and A.K. Kohli, 1993. Market orientation: Antecedents and consequences. J. Market., 57: 53-70.
CrossRefDirect Link - Kirca, A.H., S. Jayachandran and W.O. Bearden, 2005. Market orientation: A meta-analytic review and assessment of its antecedents and impact on performance. J. Market., 69: 24-41.
CrossRefDirect Link - Li, T. and R.J. Calantone, 1998. The impact of market knowledge competence on new product advantage: Conceptualization and empirical examination. J. Market., 62: 13-29.
CrossRefDirect Link - Lings, I.N. and G.E. Greenley, 2005. Measuring internal market orientation. J. Ser. Res., 7: 290-305.
CrossRefDirect Link - Moorman, C. and A.S. Miner, 1998. Organizational improvisation and organizational memory. Acad. Manage. Rev., 23: 698-723.
CrossRefDirect Link - Mullen, B. and C. Copper, 1994. The relation between group cohesiveness and performance: An integration. Psychol. Bull., 115: 210-227.
CrossRefDirect Link - Schweitzer, F.M., O. Gassmann and K. Gaubinger, 2011. Open innovation and its effectiveness to embrace turbulent environments. Int. J. Innov. Manage., 15: 1191-1208.
CrossRefDirect Link - Seers, A., 1989. Team-member exchange quality: A new construct for role-making research. Organiz. Behav. Hum. Decis. Process., 43: 118-135.
CrossRefDirect Link - Song, X.M. and M.E. Parry, 1997. A cross-national comparative study of new product development processes: Japan and the United States. J. Market., 61: 1-18.
CrossRefDirect Link - Su, Z.F., E. Xie and J.H. Peng, 2010. Impacts of environmental uncertainty and firm's capabilities on R&D investment: Evidence from China. Innov. Manage. Policy Pract., 12: 269-282.
CrossRefDirect Link - Tillman, H.J., J. Salyer, M.C. Corley and B.A. Mark, 1997. Environmental turbulence: Staff nurse perspectives. J. Nurs. Admin., 27: 15-22.
Direct Link - Weingart, L.R., 1992. Impact of group goals, task component complexity, effort and planning on group performance. J. Applied Psychol., 77: 682-693.
CrossRefDirect Link - Weiss, A.M. and J.B. Heide, 1993. The nature of organizational search in high technology markets. J. Market. Res., 30: 220-233.
CrossRefDirect Link - Wernerfelt, B., 1984. A resource-based view of the firm. Strategic Manage. J., 5: 171-180.
CrossRefDirect Link - Agarwal, R. and E. Karahanna, 2000. Time flies when you're having fun: Cognitive absorption and beliefs about information technology usage. MIS Quart., 24: 665-694.
CrossRefDirect Link - Carron, A.V., W.N. Widmeyer and L.R. Brawley, 1985. The development of an instrument to assess cohesion in sport teams: The group environment questionnaire. J. Sport Psychol., 7: 244-266.
Direct Link - Wixom, B.H. and H.J. Watson, 2001. An empirical investigation of the factors affecting data warehousing success. MIS Quart., 25: 17-41.
CrossRefDirect Link