
Yupiter HP Manurung
Faculty of Mechanical Engineering, Universiti Teknologi MARA, 40450 Shah Alam, Malaysia
M.Z. Puteri Zirwatul Nadila
Faculty of Mechanical Engineering, Universiti Teknologi MARA, 40450 Shah Alam, Malaysia
Suhaila Abd Halim
Faculty of Computer and Mathematical Sciences, Universiti Teknologi MARA, 40450 Shah Alam, Malaysia
Sunhaji Kiyai Abas
Faculty of Mechanical Engineering, Universiti Teknologi MARA, 40450 Shah Alam, Malaysia
Ghalib Tham
Faculty of Mechanical Engineering, Universiti Teknologi MARA, 40450 Shah Alam, Malaysia
Esa Haruman
Department of Industrial Engineering, Bakrie University, Jakarta, Indonesia
Zulfahmy Awaldin
ZL Technologies Sdn. Bhd. No. 32, Jln Nilam 1/1, Taman Teknologi Tinggi Subang, 40000 Shah Alam, Malaysia
Journal of Applied Sciences
Year: 2012 | Volume: 12 | Issue: 7 | Page No.: 612-626


ABSTRACT
As an inspection method, new technology using μ-focused digital radiography is nowadays increasingly used in welding or fabrication industry. Compared to film based radiography, digital image can be acquired with high time efficiency and less radiation. However, noises can easily occur due to the system complexity, parameters sensitivity and environmental effect which can indicate low quality image and can result in difficulty for interpretation. Therefore, a need of an application tool which can improve, analyze and record the image is becoming an urgent task. In this research, an interactive and user-friendly application tool was developed containing important components which can be needed by interpreter or operator to analyze the defects and to record the results. This tool is divided into three important parts, namely: Image Processing Method (IPM), Image Quality Measurement (IQM) method and Radiographic Inspection Report (RIR). This application tool was written by using MATLAB’s image processing tool which is further followed by a compilation process using GUIDE toolbox in MATLAB to build a WINDOWS stand-alone application which allows to be executed at any computer without the installation of MATLAB.
PDF Abstract XML References Citation
Received: November 05, 2011;
Accepted: March 07, 2012;
Published: June 19, 2012
How to cite this article
Yupiter HP Manurung, M.Z. Puteri Zirwatul Nadila, Suhaila Abd Halim, Sunhaji Kiyai Abas, Ghalib Tham, Esa Haruman and Zulfahmy Awaldin, 2012. Development of Stand Alone Application Tool for Analyzing and Reporting Weld Imperfection Captured by μ-focussed Digital Radiography using MATLAB-based GUI. Journal of Applied Sciences, 12: 612-626.
DOI: 10.3923/jas.2012.612.626
URL: https://scialert.net/abstract/?doi=jas.2012.612.626
DOI: 10.3923/jas.2012.612.626
URL: https://scialert.net/abstract/?doi=jas.2012.612.626
INTRODUCTION
Welding is a common joining technique used in industries. In order to produce a sound welding quality result, several factors must be considered. One of them is the inspection method. Non-Destructive Testing (NDT) is an applied technology for this purpose. Other common purposes using NDT are i.e., to assist in product development, to screen or sort incoming materials, to monitor, improve or control manufacturing processes and to inspect for in-service damage. There are various NDT methods and radiographic testing is one of the most commonly used techniques in welding industries (Pardikar, 2008). Film has been the primary medium for capturing, displaying, and storing radiographic images since the discovery of radiographic technology in 1895. To obtain an image showing the defects, film processing is one of the important steps which include development, fixing, washing and drying. As the last step of the inspection process, interpretation is carried out by an inspector for the acceptance of the requirement stand. Digital radiography is progressively replacing conventional (film-based) radiographic technique which promises consistently high levels of image quality, more effective use of radiation and more efficient work practices through by passing chemical processing and the ability to digitally transfer and to enhance images. Furthermore, less radiation can be used to produce an image of similar contrast to conventional radiography. Digital radiography is a two-dimensional MxN array of gray levels that cab be in the form of x-ray imaging (Saadi et al., 2010). The digital X-ray sensors such as Charge-Coupled Devices (CCD) and flat-panel detectors (FPD) are used instead of traditional radiographic film. A comparison between film-based and digital radiography image properties is summarized in Table 1 (Parks and Williamson, 2002).
For processing and measuring quality of image, there are some well established software existing such as Quick MTF, I See, ImageJ and Imatest. However, there is still found a deficit on a comprehensive analyzing and reporting tool which is particularly tailored to the needs of modern welding industry. In this investigation, an application tool for analyzing and reporting of radiographed image is designed and developed using MATLAB.
| Table 1: | Comparison of Radiographic Quality between Conventional and Digital X-ray |
 | |
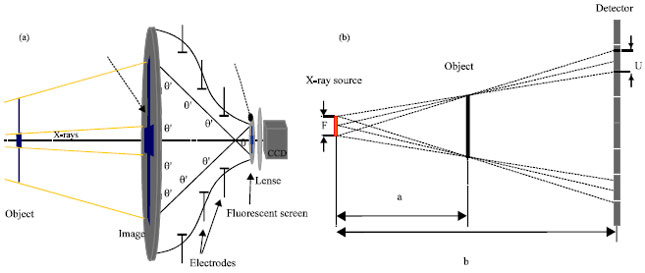 | |
| Fig. 1(a-b): | System overview of (a) Image intensifier and (b) Unsharpness (U) on the detector |
Generally, this tool comprises of three main components, which are: (1) Image Processing Method (IPM), (2) Image Quality Measurement Method (IQM) and (3) Radiographic Inspection Report (RIR). In the first part, image processing method consists of methods for noise removal, intensity adjustment and edge detection. Image quality measurement is used to analyze the image quality based on Modulation Transfer Function (MTF) method, image sensitivity using IQI single wire (10 FE EN), image unsharpness using IQI duplex wire (EN 462-5) and Normalized Signal Noise Ratio (SNRnorm) using step wedge. Results from IPM and IQM will be transferred automatically and displayed on RIR. A proper report can be recorded which allows easy traceability process for further use.
BASIC PRINCIPLE AND SYSTEM OVERVIEW OF Μ-FOCUSED DIGITAL RADIOGRAPHY
In this investigation, image is acquired using NDT Analyzer Model: m 225D from GE Phoenix X-ray with digital image chain for enhanced contrast and superior resolution. This μ-focused digital radiography has 9” triple-, 6” dual- and 6” single-field image intensifier for full digital imaging. In this system, radiographs are acquired using 1000x1000 pixel-CCD camera creating various 12 bit image formats. Figure 1 shows an overview of the image intensifier system. The incoming x-rays are converted into a visible light. A photo cathode is converting the visible light into electrons, which is then accelerated and focused onto a fluorescent screen. On this screen, a bright, small and visible X-ray image appears which is then received by the CCD camera. X-ray tube is used to control radiation for high detectability of small details such as weld defects.
A smaller focus size indicates smaller geometrical unsharpness to produce sharp image (Nadila et al., 2010). Fig. 1 and Eq. 1 show relation between focus spot size (f), focus-to-detector distance (FDD), focus-to-object distance (FOB) and geometrical unsharpness (U).
| (1) |
On Fig. 2, the digital radiography and system set-up used in this investigation are shown.
MATLAB-BASED GUI DEVELOPMENT OF APPLICATION TOOL
This application tool was designed and developed by using three main tool boxes in MATLAB which are image processing toolbox, GUIDE and compiler. Image processing toolbox has a variety of methods that can be used to enhance the image and the generated codes were integrated within the GUI to develop a complete function of components. The developed GUI was compiled using MATLAB Compiler. The standalone executing process includes selection of windows standalone application, adding the m-file to main functions, building the m-file and packaging the compiled file. Fig. 3 shows a model development process which describes the development process of this application tool.
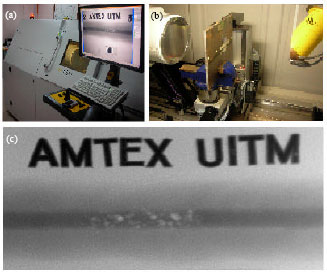 | |
| Fig. 2(a-c): | (a) μ-Focused Digital Radiography, (b) System Set-up and (c) Radiographed Image using Flawed Specimen using 180 V, 240 A, FDD = 870 mm and FOD = 270 mm |
 | |
| Fig. 3: | Model development process |
 | |
| Fig. 4: | Main page of application tool |
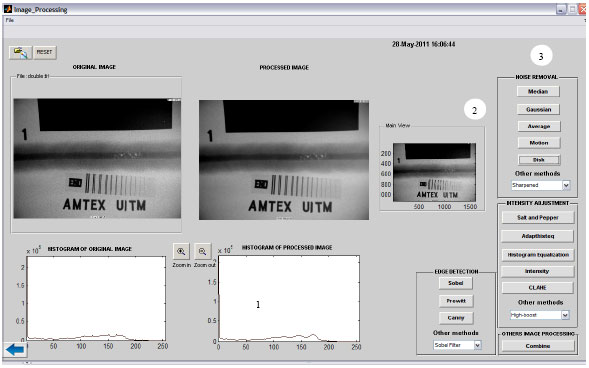 | |
| Fig. 5: | Image processing method results (1) Histogram results, (2) View window and (3) Image processing method |
This application tool consists of three sections namely: Image Processing Method, Image Quality Measurement and Radiographic Inspection Report as shown as main page in Fig. 4.
Image processing method (IPM): IPM is divided into four parts which are noise removal, intensity adjustment, edge detection and other methods. The main objective of these methods is to bring out details of image or to enlarge the contrast in a low contrast image and it can be done by modifying the intensity of the pixel of the input image (Xie et al., 2009).
The selected methods are based on a MATLAB image processing tool such as Gaussian, adaptive filtering, median, etc. It is important to choose suitable image processing method because the requirement of welding image enhancement is to improve image quality and vision effect which is the foundation of the following process and analysis of welding defects (Xiaowei et al., 2009). Fig. 5 shows the IPM containing following components: (1) Histogram results, (2) View window and (3) Image processing method Menu.
The principle of enhancement techniques is to process an image so that the result is more suitable than the original image for a specific application (Gonzalez and Woods, 1992). One of the image enhancement methods in image processing is noise removal which can be considered as the first step by giving smoothing effects on the image. There are various techniques for noise removal that apply filters on neighboring pixels. Techniques such as average, Weiner median and two dimensional order-statistics filter are types of noise removal that apply filters on neighboring pixels (Noori et al., 2011). According to Cai and Lee (2009), median filter is an alternative approach to remove the impulse noise (salt and pepper) which preserves the better edge by replacing the grey level of each pixel with a median of the grey levels in a neighborhood of that pixel. To calculate the median, the pixel values from the surrounding neighborhood is sorted into a numerical order and then a consider pixel is replaced with the middle pixel value. An image with MxN size is filtered using 3x3 size of the neighborhood. The median filter is represented using the Eq. 2.
| (2) |
where, N(x,y) is the immediate neighbors of pixel (x,y). The procedure for median filter is summarized in the algorithm described as below:
 |
The Gaussian smoothing operator is a 2-D convolution operator that is used to `blur' images and remove detail and noise. The Gaussian filter can be shaped using structuring element and standard deviation. Gaussian low pass filter can remove noise sufficiently well by using the equation below:
| (3) |
where, u is the standard deviation of the distribution and it controls the amount of blurring. The distribution is assumed that it has a mean of zero which is centered on the line x = 0. The algorithm of Gaussian filter is described below:
| Algorithm: Gaussian Filter |
 |
Average filter replace the value of center pixel by average value of neighborhood pixel. The image after neighborhood smoothing is hence:
| (4) |
where, M is the total points of neighborhood pixel and S is neighborhood of point (x,y). The algorithm of Average filter is described below:
 |
Disk filter or called as circular averaging filter (pillbox) is also a method that was used in image processing tool and gives blurring effect. It is defined as in Eq. 5.
| (5) |
Here, R is a defocus radius. The image will be smoothed when the radius is increased. The value of the radius chosen for this method is 3. The algorithm of Radius filter is described below:
Important method that was used to alter the dark image is Histogram Equalization (HE). The previous research by Kim (1997) state that HE method is widely used for contrast enhancement where improve the brightness of an image and give effect on the dynamic range stretching. HE method usually increases the global contrast of many images, especially when the usable data of the image is represented by close contrast values.
Through this adjustment, the intensities can be better distributed on the histogram. This allows for areas of lower local contrast to gain a higher contrast. HE accomplishes this by effectively spreading out the most frequent intensity values. Thus, with the HE method, it can increase the contrast quality with the result the weld discontinuities on the film can be seen clearly. The formula for histogram equalization is given as in Eq. 6.
| (6) |
where rk is input intensity, sk is processed intensity, k is the intensity range (0.0-1.0), nj is the frequency of intensity j and n is the sum of all frequencies. As a result, dynamic range of histogram is stretched evenly flat where the entire gray levels have uniform probability density.
Image quality measurement method (IQM): The quality of enhanced image is further analyzed in terms of noises, sensitivity, unsharpness, Modulation Transfer Function (MTF) and the ratio of signal to noise. The noise is measured based on MSE and PSNR, whereby two types of Image Quality Indicator (IQI) are used to evaluate the sensitivity and unsharpness of the image. The Modulation Transfer Function (MTF) of a Region of Interest (ROI) on a Tungsten plate which can produce a clear distinct edge. The measurement of Signal-to-Noise Ratio (SNR) is carried out on a step wedge with five (5) different thicknesses. The following methods for measuring the image quality are summarized as follow:
Measurement of noise (MSE and PSNR): Besides visual evaluation by a human interpreter, the performance of enhanced image can be evaluated quantitatively using methods such as Mean Square Error (MSE) and Peak Signal to Noise Ratio (PSNR).The MSE represents the cumulative squared error between the processed and the original image, whereas PSNR represents a measure of the peak error and is measured in decibels (dB) unit. Equation 7 and Eq. 8 show MSE and PSNR formula.
| (7) |
where, M and N are the height and width of image, respectively. I(x,y) is the original image and I’(x,y) is the processed image.
| (8) |
PSNR is the ratio of peak signal power to average noise power. Equation Eq. 8 shows the PSNR, where PSNR represents the ratio between a maximum of the signal (R2) and the Mean Square Error ([I(x,y) and I’(x,y)]). R2 is a maximum peak-to-peak swing of the signal, whereby R is 255 for on 8-bit images. If processes having a lower MSE and a high PSNR, it is considered better one.
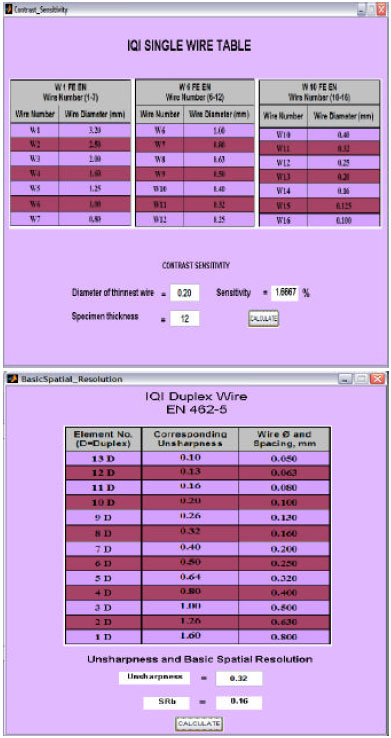
Measurement of sensitivity and image unsharpness using IQI: IQI is used to control the quality of a radiograph that can help better visualization on the film. Two common types of IQI are used for assessing the radiographic quality which is IQI single wire (10 FE EN) and IQI duple wire (EN462-5). For single wire, the last visible wire on radiographic image is considered as the contrast sensitivity of the wire can be calculated using Eq. 9.
| (9) |
Image unsharpness is one of the image quality parameters which is important in evaluating the system properties and qualities. It can be achieved by taking the geometric unsharpness divided by the magnification. Detector unsharpness is determined by the basic spatial resolution (SRb) which corresponds to the effective pixel size (Zscherpel et al., 2007). According to standard committees, it was recommended to use the duplex wire method due to its simplicity (EN 462-5, ISO 19232-5 and ASTM E 2002) (Ewert et al., 2007). By referring to the IQI duplex wire table (Table 2), the total unsharpness and SRb can be determined using Eq. 10.
| (10) |
Measurement of modulation transfer function (MTF) and spatial frequency: Modulation Transfer Function (MTF) of an imaging system is a measure of how well sine waves that describe the transmission of x-rays through an object are represented truly in the image. The transmitted x-ray beam is modulated by the object being inspected and the imaging system is responsible to translate this signal into a visible image. The MTF is represented by the curve with the spatial frequency response and measured in line pairs per millimeter (lp/mm) or cycles per millimeter (c mm-1) (Hendee and Ritenour, 2002). In this investigation, a Region of Interest (ROI) on a Tungsten plate which can provide a clear distinct edge is to be determined for measuring the MTF. The MTF of an imaging system can be determined by the Edge Spread Function (ESF) and line spread function (LSF). The ESF is differentiated to obtain the LSF.
| Table 2: | IQI single wire table (10 FE EN) with contrast sensitivity calculation and IQI duplex wire table (EN 462-5) with unsharpness and SRb calculation |
 | |
ESF uses a sharp edge rather than simply a line. It is measured when various influences to the imaging system are dependent on the area exposed, such as when the spatial properties of scattered x-radiation are measured, or for systems that have a large amount of optical light scatterings, such as fluoroscopy. The ESF formula is given as:
MTF is analyzed based on Edge Spread Function (ESF) and Line Spread Function (LSF). ESF uses a sharp edge rather than simply a line. It is measured when various influences to the imaging system are dependent on the area exposed, such as when the spatial properties of scattered x-radiation are measured, or for systems that have a large amount of optical light scattering, such as fluoroscopy.
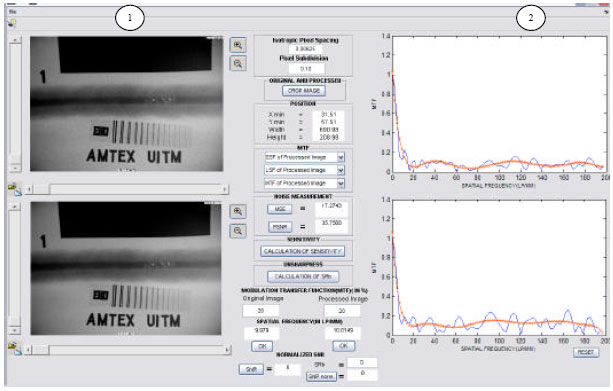 | |
| Fig. 6: | Modulation transfer function, (1) Objects and (2) Resulting Graph |
In this research, a thin tungsten plate was used to produce sharp image. The ESF formula is given as in Eq. 11.
| (11) |
where, x is the direction perpendicular to the edge, x0 is the location of the edge, -B and B are the left and right boundaries of the image and A is constant. LSF can be considered as a line of continuous holes placed very closer together. Experimentally, the long narrow slit is located in the center of the lead to get LSF form. The gray level distribution is high in the center line after penetration and it is called LSF of the imaging system. Mathematically, the line spread function is the first derivative of the ESF. LSF is given by the Eq. 12.
| (12) |
High spatial frequency means that more line pairs (black and white) in one millimeter. The Fourier Transform (FT) method changes the pixel form to spatial frequency in terms of a line pair per millimeter (lp/mm). In most cases, FT is used to convert images from the spatial domain into the frequency domain and vice-versa. The FT is also an important image processing tool which is used to decompose an image into its sine and cosine components. The output of the transformation represents the image in the Fourier or frequency domain, while the input image is the spatial domain equivalent. In the Fourier domain image, each point represents a particular frequency contained in the spatial domain image. MTF equation and algorithm structure is given as below and Fig. 6 shows the MTF interface with resulted graphs.
 | (13) |
 |
 | |
| Fig. 7(a-c): | Operation of Application Tool, (a) Image processing method, (b) Image quality measurement and (c) Radiographic inspection report |
Measurement of normalized signal noise ratio (SNRnorm): Signal-to-noise ratio (SNR) is a technical term used in digital radiography to quantify how much a corruption of signal caused by noise. The corruption of signal is focused on the imaging system which is a Charge Couple Device (CCD) camera. In CCD image sensor, the SNR is given by the ratio of the light signal to the sum of the noise signals and measured in decibels (dB) units. SNR is given as in Eq. 14.
| (14) |
where Mswx,swy (x,y) is mean grey value in local area and σnwx,nwy (x,y) is square root of window variance. Theoretically, SNR increases with square root of detector’s pixel area under same radiation quality and exposure time (Ewert et al., 2007). The standard pixel area should be normalized using SNRnorm to allow comparison of different detectors. The proposed equivalent square pixel area is 88.6x88.6 μm2 and detector’s basic spatial resolution, SRb is calculated by using equation Eq.10. The normalized SNR (SNRnorm) can be obtained using Eq. 15.
| (15) |
Experimentally, the normalised SNR is measured using the step wedge method according to EN 14784-1 with constant voltage while current and exposure time are set to different values. Based on theoretical and experimental results, the normalised SNR is reduced as the thickness increases. Figure 6 shows the layout of Image Quality Measurement Method.
| Table 3: | Parameters used to capture the radiographed image of flawed specimen |
 | |
| Table 4: | Results of image quality for five noise removal methods |
 | |
Radiographic inspection report (RIR): This section helps the user to collect all information and save to Portable Document Format (PDF) file. Some results from IPM and IQM can be automatically transferred to the RIR section and can be also fulfilled manually by a radiographer/interpreter. The information collected and displayed in RIR is experimental results, original image, enhanced image and radiographic technique. The four techniques of radiography namely single wall single image (SWSI), single wall single image panoramic, double wall double image (DWDI) and double wall single image (DWSI) can be selected and noted in the report. These techniques are usually used for welding process in welding industry.
In this section, the original and enhanced images are displayed side by side to provide transparency in analyzing the weld defects. All parameters and image quality results for both images are shown in table form. In this reporting section, the user is enabled to indicate the defects by using drawing tool and to measure the defects with the help of a measurement tools. Figure 10 shows the drawing and measurement tool from the reporting’s toolbar. The importance of reporting can be summarized as follows: (1) Increasing productivity which can lead to savings in time and costs, (2) Meeting quality assurance requirements for welding and documentation for all major codes and standards, (3) Reducing costs with a fast and easy creation of NDT reports, (4) Saving time with predefined layouts for radiographic and image processing techniques and (5) Minimizing the effort by ensuring traceability of documentation.
Execution and operation: Once the user executes the tool package, this application tool is ready to be operated. Fig. 7 shows the operation flow chart starting from Section 2 (IPM), Section 3 (IQM) and Section 4 (Reporting). In this research, a flawed specimen from SONASPECTION No.: U-C-15 was captured and enhanced using various methods in IPM. Prior to the calculation of ESF/LSF/MTF, isotropic pixel spacing based on detector specification of CCD camera and pixel subdivision which is suggested to be between 0.03-0.15 (Samei et al., 1998) are to be determined.
In this study, flawed specimen which is carbon steel and with thickness of 12 mm was captured using parameters shown in Table 3. The original image was then processed using various noise removal methods as shown in Table 4.
Theoretically, high PSNR and lower MSE will give a better result. It is because the image had less error of signal after enhancement by using image processing method. The result of spatial frequency in lp/mm (MTF) can be obtained by defining a clear distinct edge on the image such as using Tungsten plate. The spatial frequency is increased at 20% MTF by using methods of noise removal in IPM section. Figure 8 shows the results of noise measurement and spatial frequency. On the image in Fig. 9, the 8th wire can be seen clearly and by referring to the IQI duplex wire table, the total unsharpness was 0.40 mm. By using the Eq. 10, the value of basic spatial resolution (SRb) is displayed. The result of contrast sensitivity, unsharpness and basic spatial resolution are shown in Fig. 11.
Based on a result shown in a Table 3, original image and enhanced image of radiographic weld image was improved in terms of three parameters which are Mean Square Error, Peak-to-Signal Noise Ratio and Modulation Transfer Function. The chosen method from image processing is in category noise removal. Six methods of a noise removal show smoothing effect and the results show increasing of MTF compared to original image. The lower of MSE and the higher of PSNR are considered better than the original image.
The normalised Signal-to-Noise Ratio (SNRnorm) is used to determine corruption of signal caused by the noise which is measured using step wedge method.
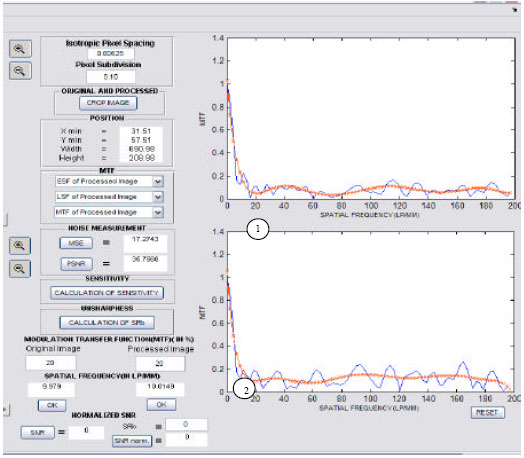 | |
| Fig. 8: | Results of (1) Noise Measurement and (2) Spatial Frequency |
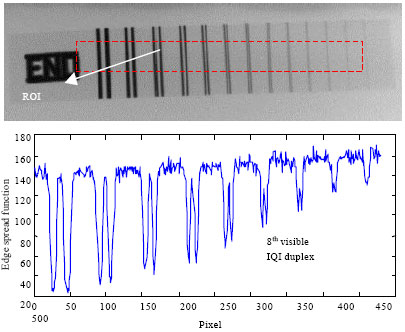 | |
| Fig. 9: | Region of interest (ROI) and edge spread function (ESF) curve for measuring the unsharpness using IQI duplex wire |
 | |
| Fig. 10: | Step wedge with different thickness for normalized signal-to-noise ratio |
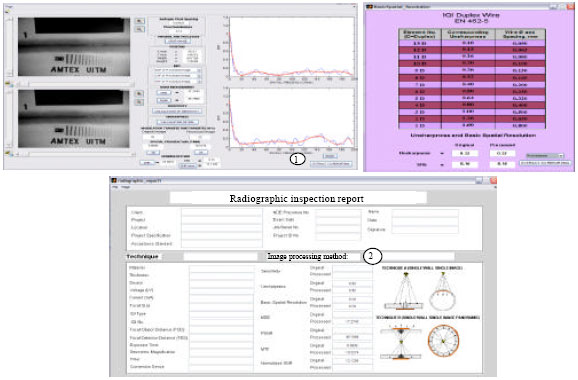 | |
| Fig. 11: | Extracted information from image quality to reporting (1) Extract button and (2) Result after transferring data |
The SNRnorm result is obtained used the equation Eq. 14 and Eq. 15. Table 5 shows the results of SNR and SNRnorm measured using step wedge.
All information from image quality measurement is transferred automatically to reporting section.
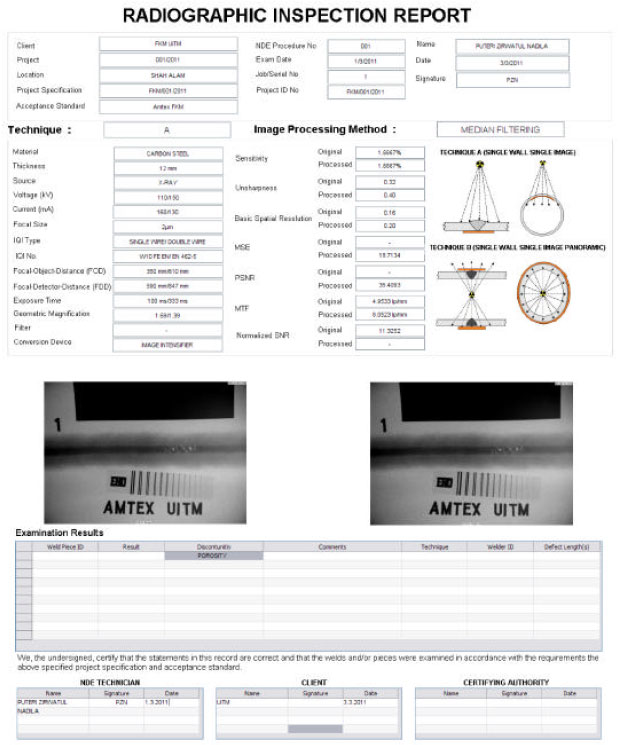 | |
| Fig. 12: | Radiographic inspection report |
| Table 5: | Results of SNR and SNRnorm |
 | |
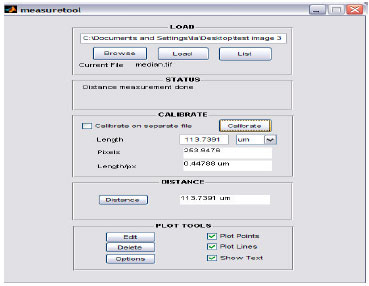 | |
| Fig. 13: | Drawing and measurement tool on report |
The user should fill up the remaining information until a proper radiographic inspection report is created, printed and documented in PDF format (Fig. 11-13).
CONCLUSION
In this study, a MATLAB GUI for image processing method, image quality and radiographic inspection report was developed. The process is allowing the user to fill up the parameter value, displaying the results through the window and determine a suitable method to improve the image. Each of tool part was tested and the corresponding results were compared. Development of this tool is attractive because it has a complete step to evaluate the image and measuring the system qualities and properties. For further development, this tool will be supported with comprehensive theoretical background for user to gain some information about welding inspection works. It is well known that the future of radiography will be digital in welding fabrication industry which behooves interpreter or operator to be familiar with the technical principle and image quality criteria.
ACKNOWLEDGMENTS
The authors would like to express gratitude to staff of Faculty of Mechanical Engineering, Laboratory of Advanced Manufacturing and Advanced Manufacturing Technology Excellence Centre (AMTEx), Universiti Teknologi MARA (UiTM), Shah Alam for the technical support during this investigation. This investigation is sponsored by E-Science from Malaysian Ministry of Science and Technology (MOSTI) with the project number: 03-01-01 SF0355.
REFERENCES
- Parks, E.T. and G.F. Williamson, 2002. Digital radiography: An overview. J. Contemp. Dent. Pract., 3: 23-39.
PubMed - Zscherpel, U., U. Ewert and K. Bavendiek, 2007. Possibilities and limits of digital industrial radiology: The new high contrast sensitivity technique: Examples and system theoretical analysis. Proceedings of the International Symposium on Digital Industrial Radiology and Computed Tomography, June 25-27, 2007, Lyon, France.
- Samei, E., M.J. Flynn and D.A. Reimann, 1998. A method for measuring the presampled MTF of digital radiographic systems using an edge test device. Med. Phys., 25: 102-113.
PubMed - Xie, X., Z. Shi, W. Guo and S. Yao, 2009. An adaptive image enhancement technique based on image characteristic. Proceedings of the 2nd International Congress on Image and Signal Processing, October 17-19, 2009, Tianjin, pp: 1-5.
CrossRef - Xiaowei, H., D. Feng, Y. Xiaohui and Z. Hongying, 2009. An approach of adaptive enhancement of X-ray welding image. Proceedings of the International Conference on Information Engineering and Computer Science, December 19-20, 2009, Wuhan, pp: 1-4.
CrossRef - Kim, Y.T., 1997. Contrast enhancement using brightness preserving bi-histogram equalization. IEEE Trans. Consumer Electron., 43: 1-8.
CrossRefDirect Link - Saadi, S., M. Bettayeb and A. Guessoum, 2010. Optimal approach for neutron images restoration using particle swarm optimization algorithm with regularization. J. Applied Sciences, 10: 517-525.
CrossRefDirect Link - Noori, O., S.M.S. Ahmad and A. Shakil, 2011. Offline malay handwritten cheque words recognition using artificial neural network. J. Applied Sci., 11: 86-95.
CrossRefDirect Link