
Abdullah Nurdden
Department of Civil and Structural Engineering, Faculty of Engineering, University Kebangsaan Malaysia, 43600 UKM Bangi, Selangor Darul Ehsan, Malaysia
Riza Atiq O.K. Rahmat
Not Available
Amiruddin Ismail
Not Available
Journal of Applied Sciences
Year: 2007 | Volume: 7 | Issue: 7 | Page No.: 1013-1018


ABSTRACT
The car is the second (40%) most common mode of transportation in Malaysia. The rapid increase in the use of personal transportation has its roots in the weak Malaysian public transport system. As a result, traffic congestion, accidents, air pollution and need for parking space among other evils, have escalated. In this study, policies aimed at discouraging the use of private transportation were studied. In addition, this study sought to identify factors that prevent personal transport users from utilizing public transport so that rational policies could be formulated to encourage greater utilization of public transport. A survey was carried out on users of private and public (both bus and urban train transport) (n = 1200). A binary logit model was developed for the three alternative modes, Car, Bus and Train. This study found that age, gender, car ownership, travel time, travel cost, household size and income are significant factors in influencing the individual’s choice of transportation. The most important variables found likely to encourage the use of public transport were reduced travel time, reduce the distance from home to public transportation stations and subsidized fares. In conclusion, for the commuter to switch to public transport, proper incentives need to be provided for a successful implementation.
PDF Abstract XML References Citation
How to cite this article
Abdullah Nurdden, Riza Atiq O.K. Rahmat and Amiruddin Ismail, 2007. Effect of Transportation Policies on Modal Shift
from Private Car to Public Transport in Malaysia. Journal of Applied Sciences, 7: 1013-1018.
DOI: 10.3923/jas.2007.1013.1018
URL: https://scialert.net/abstract/?doi=jas.2007.1013.1018
DOI: 10.3923/jas.2007.1013.1018
URL: https://scialert.net/abstract/?doi=jas.2007.1013.1018
INTRODUCTION
In view of the increased number of registered private cars and injuries and deaths of its users in Malaysia, a shift away from car using towards other safer modes is essential to increase road safety. The increasing number of car users involved in crashes and the associated injury has prompted the government of Malaysia to undertake various studies to address the problem. One of these studies was the shift of transportation mode from private car to public transportation (Bus and Train) in Malaysia (Riza, 2004). The study targeted to evaluate policies and strategies than can help to formulate, model shift of transportation mode from private car to public transportation in Malaysia, to formulate the modeling of possible model shift from private car to public transportation and to predict the future model shift. The current study is a part of the research that has focused on model shift initiatives. To date, research efforts have focused primarily on modeling modal shift from private car to public transport. Many cities have attempted to restrict the use of private cars in favour of public transport Steg (2003). Such policies exist in France (Harrison et al., 1998), Germany (FitzRoy and Smith, 1998), Britain (Harrison et al., 1998), (Sayed Sharafuddin and Ata Khan, 2000), Netherlands (Cheung and Hoen, 1996), Romania (Marshall and McLellan, 1998), Australia (Black, 1996), Asian countries (Shimazaki et al., 1994; Land Transport Authority, 1996) and Canada (Schimek, 1996).
Mode choice models have been widely used to predict mode choice for work trips and other types of trips in the development of regional travel models (Moshe and Lerman, 1985). This study describes modelling of transportation policies to formulate, model shift from private car to public transport. The purpose of this study is to consider car users’ receptiveness to various policy changes, namely providing park and ride facilities, raising the minimum driving age from 18 to 23 years and improvements in public transport frequency and services. The explanatory variables included in the models were demographic, socio-economic characteristics of individuals, trip characteristics and mode attributes. A binary logit model was used to identify factors that are significant in determining the choice of transport and to predict the probability of a change in bus and train ridership with respect to various travel times and cost.
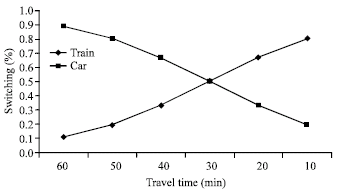 | |
| Fig. 1: | Effect of public transport travel time reduction on car users mode choice probability |
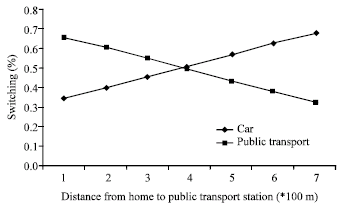 | |
| Fig. 2: | Effect of distance from home to public transport increases on car users mode choice probability |
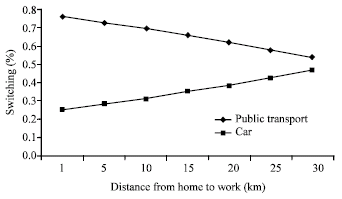 | |
| Fig. 3: | Effect of distance from home to work increases on car users mode choice probability |
The study examined the probability of car users shifting to public transport based on a scenario of a reduction in bus travel time and travel cost. This was done by solving the binary logit equation for probability using the range of various travel time scenarios. The effects of other variables were controlled by keeping them constant (giving them the values mainly based on means). The mode share probabilities categorized by various levels of travel time and distance from home and work to public transport are shown in Fig. 1-3.
MATERIALS AND METHODS
To achieve the objectives of this study, survey was carried out in the state of Kuala Lumpur city center over four months from (1 September to 1 February 2005), for users of three modes of transport: private car, bus and urban train (n = 1200). Kuala Lumpur was chosen as the study locality because it has high car ownership and use and public transport (bus and rail) available. The SP and RP methods were adopted because of their successful previous use (Kores and Sheldon, 1988).
The SP survey was designed to gather information on the choice of commuting by private and public transport (bus and train) using a series of hypothetical route choice questions. The questionnaire was in three parts. The first contained nine questions on general information (personal characteristics and socio-demographic influence): age, income, convenience, trip perception and purpose, education, household size, car ownership and occupation. The second part (12 questions) was on the trip characteristics and preference for driving versus public transport, weather, comfort, satisfaction, flexibility and prestige. The last part (11 questions) asked the respondents to consider three policy tools in choosing his travel mode and to choose the factors most likely to persuade him to use public transport:
| Policy 1: | Providing park and ride facilities |
| Policy 2: | Raise the legal age for driving from the current 18 to 23 years. |
| Policy 3: | Transit improvement (frequency and services) |
In the survey, the respondents were asked to reflect on their last trip. They were asked their destination, how they traveled and how much it cost. Then they were asked for another way by which they could have traveled instead, had their mode of travel not been Available. The answers provided the RP data. The survey also hypothetically varied the Public transport fares for the respondents’ current and alternative modes of travel under a Series of pricing scenarios and asked what they would have done in each situation. The responses were recorded as the mode of transport they would have used and the fare.
They would have liked to pay for the SP data. A binary logit model was developed for three alternatives namely, bus, train and car, with the aim of comparing the utility of these travel modes and to identify the factors that would influence car users to move from traveling by car to choosing the public transport alternative. In these models, model car and public transport, the dependent variable was 1 if the commuters traveled by public transport and 0 for car use and other three models the dependent variable was 1 switch to public transport and 0 if the commuters were not agree to switch. The explanatory variables were: age, gender, income, travel time, travel cost, household size, distance from home to public transport, distance from home to work and car ownership. Some of the explanatory variables such as age, income per month household size and gender were categorized. For instance, the income was categorized as; <RM 1000, RM 1001-2000, RM2001-3000, RM 3001-4000, >4001 (1USD = RM3.65) while gender was categorized as 0 for male and 1 for female. Age was also categorized as; 16-20, 21-25, 26-30, 31-35, 36-40, 41-45, 46-50, 51-55 and >56. Household size was categorized as; 2 person 3-5 person and >6 persons.
RESULTS
Modal choice models
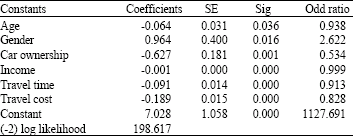
Modal 1. (Car and public transport): The estimated coefficients for gender for the public transport mode (Table 1) came out positive, implying that if the gender was female, the preference would be for commuting by public transport instead of driving the car. The odds ratio increased by approximately 2.622 times for females compared to males. The estimated coefficients for travel time and travel cost for the public transport mode (Table 1) were negative, implying that an increase in travel time and travel cost for the public transport mode was likely to increase the probability of car users to continue choosing the car as the preferred transport mode. The likelihood of shifting car users to public transport was likely if reductions in travel time and cost could be achieved. In the model, demographic variables such as age and income were found to significantly explain mode choice behavior. In terms of age, older people were more likely to use the public transport as opposed to driving. The odds ratio increased about 93% for older people compared to younger commuters.
| Table 1: | Estimation results for binary mode choice model (n = 1200) |
 | |
| Table 2: | Estimation results for binary ligit model (n = 1200) |
 | |
The models explanatory power, the two R2 values indicate the model’s strong explanatory power. The factors included in the model account for 90.4% of the variation for the Negelkerke, while Cox and Snellt explained 63.9%. Classification matrices were calculated to assess if the model fits the data and it was found that the model correctly classified about 97.7% of carcases and about 93.4% of bus mode cases. The overall accuracy of the prediction model was 96.4%.
The mode choice probabilities were categorized by various levels of travel time (Fig. 1). Mode choice probabilities ranged from 60% likelihood of car use with current public transport total travel time per trip (60 min) to 20% likelihood of car use with a reduction in public transport total travel time per trip (10 min). At the same time, the probability of public transport ridership increased from 10% with current public transport total travel time per trip (60 min) to 80% of likelihood with a 10 min reduction in public transport total travel time per trip. A 50: 50 split may be achieved when the travel time are set at 30 min per trip for public transport travel.
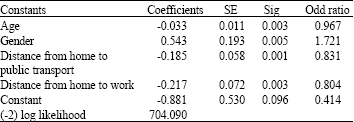
Modeling of proposed policies
Model 2. (Policy 1: Providing park and ride facilities): The estimated coefficients for gender for the public transport mode (Table 2) came out positive, implying that if the gender was female, the preference would be for commuting by public transport instead of driving the car. The odds ratio increased by approximately 1.721 times for females compared to males. The estimated coefficients for Distance from home to public transport and Distance from home to work for the public transport mode (Table 2) were negative, implying that an increase in Distance from home to public transport and Distance from home to work for the public transport mode was likely to increase the probability of car users to continue choosing the car as the preferred transport mode. The likelihood of shifting car users to public transport was likely if reductions in Distance from home to public transport and Distance from home to work could be achieved.
In the model, age was found to significantly explain mode choice behavior. Older people were more likely to use the public transport as opposed to driving. The odds ratio increased about 96.7% for older people compared to younger commuters.
The models explanatory power, the two R2 values indicate the model’s strong explanatory power. The factors included in the model account for 94% of the variation for the Negelkerke, while Cox and Snellt explained 72.4%.
The mode choice probabilities were categorized by various levels of Distance from home to public transport (Fig. 2) and Distance from home to work. Mode choice probabilities ranged from 34% likelihood of car use with current Distance from home to public transport (100 m) to 68% likelihood of car use with a increases in Distance from home to public transport (700 m) At the same time, the probability of public transport ridership decrease from 66% with current Distance from home to public transport (100 m) to 32% of likelihood with (700 m). A 50:50 split may be achieved when the Distance from home to public transport are set at 350 m.
Also mode choice probabilities were categorized by various levels of Distance from home to work (Fig. 3). Mode choice probabilities ranged from 25% likelihood of car use with current Distance from home to public transport (1 km) to 47% likelihood of car use with a increases in Distance from home to work (30 km) At the same time, the probability of public transport ridership decreased from 75% with current Distance from home to work (1 km) to 53% of likelihood with (30 km).
Model 3. (Policy 2: Raising the minimum driving age from 18 to 23 years): Table 3 showed the effect of license age increase on car users switching behavior against age and Gender. The results showed that age is significant in explaining mode switching behavior. The odds ratio increased by approximately 0.360% for each two years (1 unit). In other words, the older riders are more likely to switch to public transport compared to the younger riders. The estimated coefficients for gender, Table 3 showed the effect of license age increase on car users switching behavior against gender, the results indicated that resistance to switching is higher among female car users compared to females car users. Cross tabulation results are also in agreement with the model results.
| Table 3: | License age increase switching behavior in relation to age and gender (cross tabulation and estimated parameter) |
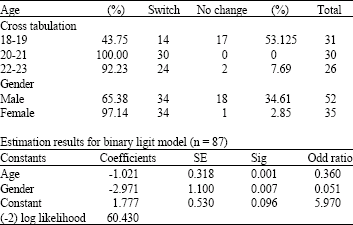 | |
| Table 4: | Estimation results for binary ligit model (n = 1200) |
 | |
Classification matrices were also calculated to assess the fit of the model to the data. The model was found to correctly classify about 92.6% of switching cases and about 89.5% of no switching cases. The prediction model was 92% accurate. The factors included in the model account for 87% of the variation for the Negelkerke, while Cox and Snellt explained 77.16%.
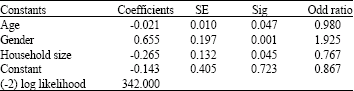
Model 4. (Policy 3: Transit improvement (Frequency and services)): Three factors were found to significantly explain mode choice behavior. Age, gender and household size. In terms of age, older people were more likely to use the public transport opposed to driving. The odds ratio increased about 98% for older people compared to younger commuters. The estimated coefficients for gender for the public transport mode (Table 4) came out positive, implying that if the gender was female, the preference would be for commuting by bus instead of driving the car. The odds ratio increased by approximately 5% for females compared to males. Table 4 showed the effect of public transport improvement on car users switching behavior against Household size. The results showed that Household size is significant in explaining mode switching behavior. The odds ratio increased by approximately 77% for each one person in the household.
The model for Transit improvement was found to correctly classify about 96% of switching cases and about 88.0% of the not switching cases. The prediction model was 89.7% accurate. In this model explanatory power, the two R2 values indicate the model’s strong explanatory power. The factors included in the model account for 87.6% of the variation for the Negelkerke, while Cox and Snellt explained 90.55%. Thus, by promoting the appropriate policy, in relation to providing Park and Ride Raise the legal age for driving from the current 18 to 23 years and Transit improvement, one could provide opportunities for mode shifts among car users, which in return, will reduce their exposures and therefore, the risk of injury.
CONCLUSION
The study attempted to conduct mode choice behavior of travelers of tow modes of transport namely car, public transport and determined the trade-offs travelers make when considering choice of their mode of transport. Utility of the two modes were compared to determine the important reasons behind the choice of a particular mode and the circumstances, which might cause travelers to change their choice for the car. In order to promote greater use of public transport, this study examined the effect on car use if total bus and train travel time, travel costs Distance from home to public transport and Distance from home to work for the public were reduced and the results suggest that travel time and travel cost are characteristics that determine why car use is a favored modal choice.
This was understood by solving the binomial logit equation for probability using several options of travel time and distances scenarios. In order to promote greater use of public transport and less dependence on car, an efficient public transport system is clearly needed. Higher capacity transit systems, use of bus lanes, bus gates and ITS systems are among initiatives that could be implemented to improve the public transport system. The use of traffic restraint policies such as in France (Harrison et al., 1998), Australia (Black, 1996), Area Licensing in Singapore (Geok, 1981) or London Road Pricing (Litman, 2005) could further enhance a policy that promotes public transport; a policy that is moving towards a more sustainable transport system compared with total dependence on private vehicles. The findings of this research can be concluded that the travel time, travel cost, Distance from home to public transport and Distance from home to work are the contributing factors that influence the model shift from car to public transport in Malaysia.
ACKNOWLEDGMENTS
Support of this research was provided by grants from faculty of engineering, university Kebangsaan Malaysia. Mr. Kamba would like to thank professor Riza Atiq O.K. Rahmat and associate professor Amiruddin Ismail for their guidance.
REFERENCES
- FitzRoy, F. and I. Smith, 1998. Public transport demand in Freiburg: Why did patronage double in decade? Transport Policy, 5: 163-173.
CrossRef - Harrison, S., G. Henderson, E. Humphreys and A. Smyth, 1998. Quality bus corridors and green routes: Can they achieve a public perception of permanence of bus services? Proceedings of PTRC 26th European Transport Conference: Public Transport Planning and Operations, September 14-18, Loughborough University, UK.
- Kores, E.P. and R.J. Sheldon, 1988. Stated preference methods: An introduction. J. Transport Econ. Policy, 221: 11-26.
Direct Link - Syed, S.J. and A.M. Khan, 2000. Factor analysis for the study of determinants of public transit ridership. J. Public Transport., 3: 1-17.
Direct Link - Schimek, P., 1996. Automobile and public transit use in the United States and Canada: Comparison in the postwar trends. Transport. Res. Rec., 1521: 3-11.
CrossRef - Shimazaki, T., H. Kazunori and S.M. Shihana, 1994. Comparative study of transportation modal choice in Asian countries. Transport. Res. Rec., 1441: 71-83.
Direct Link - Steg, L., 2003. Can public transport compete with the private car? IATSS Res., 27: 27-35.
Direct Link