
Bi Mingde
Key Laboratory of Ministry of Education for Image Processing and Intelligent Control, Department of Control Science and Engineering, Huazhong University of Science and Technology, 1037 Luoyu Road, 430074, Hubei, Wuhan, China
Sun Zhigang
Key Laboratory of Ministry of Education for Image Processing and Intelligent Control, Department of Control Science and Engineering, Huazhong University of Science and Technology, 1037 Luoyu Road, 430074, Hubei, Wuhan, China
Information Technology Journal
Year: 2011 | Volume: 10 | Issue: 9 | Page No.: 1701-1708


ABSTRACT
In this study, a new fabric defect detection algorithm base on undecimated wavelet transform is proposed. The selection scheme of wavelet decomposition scales is investigated to set the decomposition scales adaptively to the fabric texture. The objective of the scheme is to enhance the energy of defective region and attenuate the energy of non-defective region. And the performance of detection results with different number of decomposition scales is also discussed. A simple and computationally effective data fusion scheme combined with amplitudes division of wavelet coefficients is used to fuse data from multiple scales together. And several features based on defective energy estimation are extracted from fused image. By examining the extracted features the proposed algorithm can provide not only the location of defects but also some detailed information about them which can be used for defect recognition and classification. Experimental results of real fabric defects are provided to validate the effectiveness and robustness of the defect detection algorithm.
PDF Abstract XML References Citation
Received: January 08, 2011;
Accepted: May 13, 2011;
Published: July 27, 2011
How to cite this article
Bi Mingde and Sun Zhigang, 2011. Fabric Defect Detection using Undecimated Wavelet Transform. Information Technology Journal, 10: 1701-1708.
DOI: 10.3923/itj.2011.1701.1708
URL: https://scialert.net/abstract/?doi=itj.2011.1701.1708
DOI: 10.3923/itj.2011.1701.1708
URL: https://scialert.net/abstract/?doi=itj.2011.1701.1708
INTRODUCTION
Fabric defect detection is one of the most important procedures effecting the manufacturing efficiency and quality in fabric industry. Traditional inspection based on human vision is labor-intensive and lack of consistency and reliability. As the development of image processing technology, many methods base on machine vision are proposed and a good summarization and taxonomy of those methods can be found (Kumar, 2008). Because of the high degree of periodicity of the fabric texture, the spectral approaches are appealing for the task of defect detection. Fourier transform was used for this task in (Chan and Pang, 2000; Tsai and Hsieh, 1999). However, Fourier transform turns out to be suitable for globe defects rather than local ones, because of its poor local resolution in the frequency domain. Therefore, some defect detection algorithms based on Gabor filters were proposed to achieve optimal joint localization in both spatial and frequency domain (Kumar and Pang, 2000a, 2002; Bodnarova et al., 2002; Escofet et al., 1998). As Gabor filter banks are not mutually orthogonal, the outputs of the filter banks are significantly correlated. Wavelet analysis is a good solution to this problem (Nadhim, 2006) which is widely used for and image segmentation (Zhang et al., 2008), image compression (Venkateswaran and Rao, 2007), texture characterization (Loum et al., 2007) and classification (Raju et al., 2008). Several fabric defect defection methods based on wavelet transform were proposed using orthogonal wavelet basis (Jasper et al., 1996; Sari-Sarraf and Goddard Jr., 1999; Yang et al., 2001, 2002).
In this study, fabric defect detection using wavelet transform is further investigated. The undecimated discrete wavelet transform is used to achieve shift-invariant property. Multi-scale analysis of wavelet is used to provide multi-resolution representation of defects. And an adaptive selection scheme of decomposition scales is proposed to enhance the energy distinction between the defective and non-defective regions. The performance of different decomposition scales for each kind of popular defects is also evaluated. Several features based on the energy estimation are extracted and used to discriminate the defect from normal texture.
UNDECIMATED DISCRETE WAVELET TRANSFORM (UDWT)
Standard discrete wavelet transform (DWT) is not suitable for detect detection, as it is not shift-invariant. A defect in different displacement of a fabric image may result in different wavelet coefficients which possibly lead to different detection results. So UDWT is used in this study.
 | |
| Fig. 1: | 2D undecimated wavelet transform |
It gives a complete but redundant representation of signal (Unser, 1995). The most important advantage of UDWT is its shift-invariant property which is desirable for fabric defect detection. Compare to DWT, UDWT does not down-sample the wavelet coefficients, instead it up-samples the high-pass and low-pass filters of the wavelet by inserting zeros. The implementation of 2D UDWT is illustrated in Fig. 1, where Aj denotes wavelet approximation at scale j. Wij denotes wavelet coefficients at scale j along orientation i, where i = 1,2,3 denote horizontal, vertical and diagonal orientation, respectively. hj[n] and gj[n] denote the low-pass and high-pass filters at scale j, where:
| (1) |
| (2) |
↑denotes up-sample by inserting zeros.
DEFECT DETECTION ALGORITHM
The block diagram of defect detection is shown in Fig. 2. In the proposed algorithm the defect is assumed to be local, not global. The essence of the proposed algorithm is to discriminate the defect from normal texture by examining the defective energy within a sub region. Preprocess is used to make the original fabric image zero mean so that both the dark pixels and bright pixels which defects are usually made up of, have larger energy than the normal background. UDWT, amplitude division and data fusion are used to enhance the energy of the defect and attenuate the energy of normal background. Then the energy features are extracted and defects are detected by thresholding.
 | |
| Fig. 2: | Block diagram of defect detection |
Wavelet selection scheme: For every preprocessed fabric image, UDWT is used for multi-scale decomposition. For almost all the defect detection tasks using wavelet transform, the most important issue is the selection of wavelet. There are two fundamental problems with selection of wavelet. The first is selection of wavelet basis. The second is selection of decomposition scales. Wavelet coefficients at different scales contain different parts of information of fabric image. It is needed to select some scales which can best represent defects in the image. The larger number of scales selected corresponds to higher computational costs, on the other hand insufficient or improper selection of scales may lose some information of certain defects which makes them difficult to detect.
To detect defects of different kinds, Yang et al. (2001) designed an adaptive wavelet basis for each kind of defects and a set of wavelet bases were used for multiple kinds of the defects which greatly increase computational load. Jasper et al. (1996) and Yang et al. (2002) designed an adaptive wavelet basis to characterize fabric texture and only one scale was used so that multi-resolution representation of the defect was not provided. Sari-Sarraf and Goddard Jr. (1999) used Daubechies D2 (Daubechies, 1988) wavelet basis and selected decomposition scale manually by human observation. The scale at which the normal texture is significantly attenuated while the defect is still visually intact is selected. This involves participation of human vision which may not desirable. In this study we also use Daubechies D2 wavelet basis, because of its low computational complexity as well as its similarity of corresponding 2-D kernel with the fabric weave pattern and the decomposition scale is set adaptive to the fabric texture. The proposed scale selection scheme is based on the following two conceptions. First, the defect, within its boundary, tends to have lower intensity variation than normal texture (Sari-Sarraf and Goddard Jr., 1999) which means the main energy of the defect lies in lower frequency region than the normal texture in the frequency domain. Second, the objective of wavelet transform is to enhance the energy of defective region and attenuate the energy of non-defective region.
Because the normal texture of fabric exhibits high degree of periodicity, it has large energy nearby a certain frequency point which we claimed as Textural Inherent Frequency Point (TIFP), along each orientation in the frequency domain. TIFP is located at the reciprocal of the texture periodicity along each orientation. As the decomposition scale increases, the passband of high-pass filter of UDWT decreases by a step of an octave which is shown in Fig. 3. Let the upper cut-off frequency of high-pass filter of Daubechies wavelet be FC at scale 1, then its upper cut-off frequency at scale j will be FC/(2j-1). In order to enhance the energy of defective region and attenuate the energy of non-defective region, the frequency region of defects should be in the passband of high-pass filter and the TIFP of normal texture should be in the stopband of high-pass filter along each orientation which means the desirable scales to be selected must meet the following condition:
| (3) |
which can be written as:
| (4) |
where, j denotes scale level, FPi denotes TIFP along orientation i. Equation 4 gives a lower limit of advisable decomposition scale along each orientation. We claim the smallest scale satisfies Eq. 4 as initiation scale, where we start to calculate the wavelet coefficients; the previous scales are ignored to reduce computational load. Different orientations may have different initiation scales depending on TIFP (or texture periodicity) of fabric texture along that orientation.
 | |
| Fig. 3: | Relationship among the frequency responses of Daubechies wavelet, the defect frequency region and TIFP in one dimension |
Figure 3 illustrates the relationship among the frequency responses of Daubechies wavelet from scale 1 to scale 3, the defect frequency region and TIFP in one dimension. In Fig. 3 only scale 3 satisfies Eq. 4, so the initiation scale is scale 3, at which wavelet coefficients are calculated. Wavelet coefficients at scale 1 and 2 are ignored.
Because any scale can only capture the information of certain categories of defects, wavelet coefficients at several successive scales beginning from the initiation scale are used to detect various detects. The number of decomposition scales is an important parameter which greatly affects the detection results. The large number of scales selected corresponds to high computational load, while insufficient number of scales may lead to failure of detection. Proper number of decomposition scales for each kind of defects will be discussed here. The output of UDWT is a set of wavelet coefficients listed as W1h, W2v, W3d,W1(h+1),W2(v+1),W3(d+1),…,W1(h+n-1),W2(v+n-1) and W3(d+n-1), where 1, 2, 3 denote horizontal, vertical and diagonal orientation respectively, h, v and d are their corresponding initiation scales and n denotes the number of scales selected.
Amplitude division: It is found that defects, within their boundaries, tend to have more dark pixels (e.g., big-knot, dirty yarn, etc.) or light pixels (e.g., mispick, broken yarn, etc.) than the normal texture. In turn large quantities of dark pixels or light pixels within a local region indicate a defect in that region. Preprocess is used to make the original fabric image zero mean so that the dark pixels within a defective region have larger negative amplitudes than normal texture while light pixels within a defective region have larger positive amplitudes than normal texture and UDWT is used to enhance both positive and negative amplitude distinctions while keeps the output zero mean. In order to know whether the defect is made up of dark pixels or light pixels the output of UDWT is divided into two parts, each of which contains only positive amplitudes or negative amplitudes, respectively:
 | (5) |
| (6) |
where, WN denotes the negative coefficients containing the energy from dark pixels, WP denotes the positive coefficients containing the energy from light pixels. Both of two parts are further processed separately.
Data fusion: UDWT decomposes the original image into wavelet coefficients of several scales and orientations. Each scale and orientation only captures parts of information of defects in the fabric image, so it is needed to fuse the information gathered from different scales and orientations to provide relatively complete representation of the defects which makes them easy to discriminate from normal texture. Some data fusion schemes were used by Kumar and Pang (2000b) and Sari-Sarraf and Goddard Jr. (1999) to fuse the information from different scales and orientations into a single image. In this study only data from different scales are fused and a simple fusion scheme is used:
| (7) |
| (8) |
The fusion scheme is similar to Kumar and Pang (2000a), except that data from different orientations are not fused, because different orientations may have different initiation scales, it is not proper to fuse them together. Besides it is found that most defects are horizontal, vertical or diagonal and wavelet coefficients of the UDWT along a certain orientation are enough to detect the defects along that orientation. For a defect along a certain orientation, the output of UDWT along other orientations give little information about it, so fusing data from different orientations will not notably improve the detection result but add extra computational load. The positive and negative amplitudes of wavelet coefficients are fused separately for the same reason discussed here and geometric mean is used to fuse the data at adjacent scales. Since lots of elements in CNi and CPi are set to zero by amplitude division, only the real defects which emerge on both adjacent scales are preserved and random noise is depressed. This is useful to reduce false alarm.
Energy feature calculation: The fused images of each orientation and of both positive and negative amplitudes are subjected to the energy estimation to extract energy features. And these features are used to discriminate the defects from normal texture. The fused images are divided into non-overlapping subregions. Within these subregions six energy features are computed as:
| (9) |
| (10) |
| (11) |
| (12) |
 | (13) |
 | (14) |
In the symbols of six features H, V, D denote horizontal, vertical, diagonal orientation, respectively and P, N denote positive and negative amplitudes, respectively, e.g., EHP denotes the energy of horizontal positive amplitudes in the subregion.
The extraction of the features can be explained as following procedure: The amplitudes within a subregion are accumulated along each orientation which can be considered as a 2D-to-1D projection toward that orientation, to form an accumulation vector and then the energy of the accumulation vector is calculated and used for defect detection by thresholding. Compared with direct calculation of energy of wavelet coefficient matrix, the proposed method uses more addition operations instead of multiplication operations which needs less computational time on most computational platform (except some specialized DSPs).
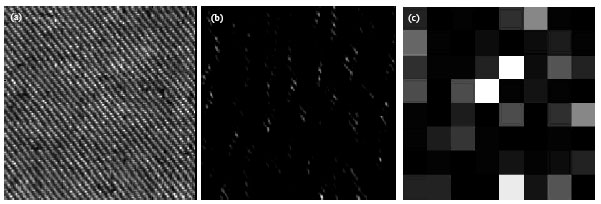 | |
| Fig. 4 (a-c): | (a) Sample fabric without defect, (b) CP2 and (c) EVP of a |
More important, because the accumulation vector of corresponding feature accumulates the defective amplitude a long a certain orientation, so if the subregion containing a real defect along that orientation, the amplitudes of accumulation vector will be greatly enhanced which makes the defect much easy to detect by thresholding. The size of the subregion is an important parameter. Large size corresponds to less detection error while small size provides more precise location of defects. In this study the size of 32x32 subregion is used to achieve a desirable result.
Thresholding: The six features measure the defective energy of positive and negative amplitudes along horizontal, vertical and diagonal orientations within a subregion, respectively. If any of them exceeds the thresholding limit, then the subregion is considered as a defective region. The thresholding limits are determined from defect-free sample fabric images. The features of sample images are calculated. Figure 4 illustrates a sample image, its fused image CP2 (x, y) and the feature EVP. The thresholding limits of features are set to μ+λσ, where μ and σ are mean and standard deviation of features extracted from sample fabric images, λ is a parameter compromising between false positive and false negative rate and set to 4 in this study.
Different from most defect detection algorithms which can only detect the defect giving its location, this method, by examining which feature exceeds the thresholding limit, can also provide some detailed information of the defect: whether the defect is horizontal, vertical or diagonal, whether the defect is mainly made up of dark pixels or light pixels.
RESULTS AND DISCUSSION
Samples of fabric image, in which the defects are considered to be most difficult to detect, are used to evaluate the performance of the detection algorithm. All of the images are acquired by line scan CCD camera with a spatial resolution of 0.2 mm/pixel against backlighting illumination and digitalized into 256x256 pixels. The subregion size is set to 32x32. Figure 5 shows the detection results of twill fabric samples with defect dirty-yarn, slack-end and wrong-pick with two decomposition scales. And several samples of plain weave fabric with defect broken-pick, misyarn, triple-weft and Big-knot are illustrated in Fig. 6. Misyarn uses only one decomposition scale, while broken-pick and Big-knot use two scales and triple-weft uses three scales. The fused images and features which are used to detect the defects are presented, as well as the final thresholding results.
In Fig. 5 and 6, different number of decomposition scales are used to detect different kinds of detects. Larger number of decomposition scales corresponds to better detection result but more computational load. In order to investigate the relationship between detection performance and the number of decomposition scales, a criterion function is used as follows:
| (15) |
where, Ud is an average feature value calculated from quantities of defective subregions with defects of the same kind. The feature is selected from the six features in Eq. 9-14, by which the defects are detected. Un is the counterpart of Ud calculated from non-defective subregions. J denotes the ratio of average feature values between defective subregions and non-defective subregions and is used to evaluate the performance of the algorithm. Some similar criterion functions based on the ratio of average feature values between normal texture and defects were also used by Kumar and Pang (2002) and Yang et al. (2001).
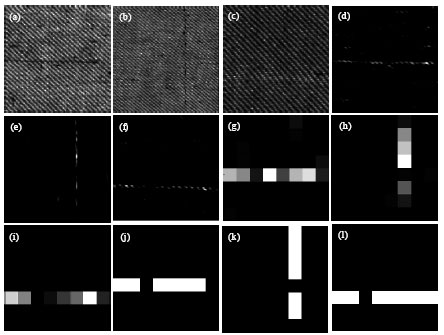 | |
| Fig. 5 (a-l): | Twill fabric samples with dirty yarn, slack-end, wrong pick in (a-c), corresponding CN1, CP2 and CP1 in (d-f), EHN, EVN, EHP in (g- i) and detection results in (j-l) |
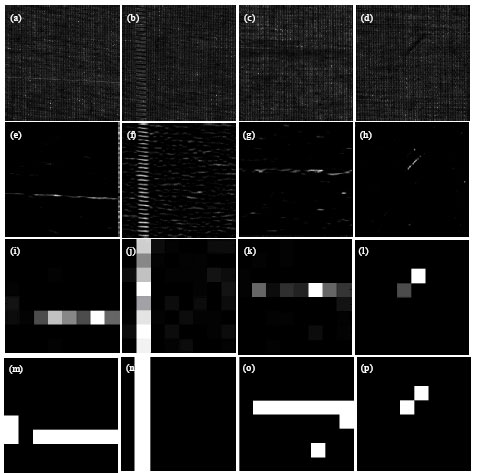 | |
| Fig. 6 (a-p): | Twill fabric samples with broken pick, misyarn, triple-weft and big-knot in (a-d), corresponding CP1, CP2 and CN1, CN3 in (e-h), EHP, EVN, EHN, EDN in (i-l) and detection results in (m-p) |
| Table 1: | Performance of detection result with different number of decomposition scales for each kind of defect |
 | |
The higher magnitude of J indicates larger Euclidean distance between the features of defects and normal texture which means it is much easier to discriminate the defects by thresholding. Table 1 presents the magnitude of criterion function of defects illustrated in Fig. 5 and 6 with different decomposition number of scales. The features which are used to detect the defects are also presented. In Table 1 it is suggested that with the increase of scale number, J of nearly all categories of defects (except misyarn) increases which means better detection results at expense of more computational load. Only one scale is sufficient to defect misyarn. This can be probably explained as that the frequency respond of the misyarn is quite close to that of normal texture. So it needs only one scale (initiation scale) to get a desirable result. The power spectrum of other kinds of defects lies in lower frequency regions in the frequency domain, so they need some further scales to detect. The defects dirty yarn, slack-end, wrong pick, broken pick and Big-knot require two scales while triple-weft requires three. We can see from Table 1 that the triple-weft is hardest to detect by the proposed algorithm, as compared with other kinds of defects with the same number of scales J of the triple-weft is smallest. This is because the gray values of pixels of defect triple-weft are close to a constant which means long distance from TIFP of normal texture thus needs largest number of scales to detect.
CONCLUSIONS
In this study, a new fabric defect detection method was demonstrated. Multi-scale analysis property of wavelet was used to provide multi-resolution representation of defects. The wavelet decomposition scales were selected adaptively to the fabric texture. Wavelet coefficients of only several selected scales were calculated and the others were omitted. This greatly saves the computational power and improves the real-time performance which is required in on-line inspection. The detection performance using different number of decomposition scales for different kinds of defects was also evaluated. Users can appropriately select the number of decomposition scales depending on the tradeoff between detection precision and computational load in their systems. Experimental results were shown to validate the effectiveness and robustness of the algorithm. The proposed algorithm can provide not only the exact location of the defect but also some detailed information about the defect: whether the defect is horizontal, vertical or diagonal and whether the defect is mainly made up of dark pixels or light pixels. And this can be used for further investigation on the defect such as defect recognition and classification.
ACKNOWLEDGMENT
This study was supported by Open fund of Image Processing and Intelligent Control Key Laboratory of Education Ministry of China.
REFERENCES
- Kumar, A., 2008. Computer-vision-based fabric defect detection: A survey. Trans. Ind. Electron., 55: 348-363.
CrossRef - Chan, C.H. and G.K.H. Pang, 2000. Fabric defect detection by Fourier analysis. IEEE Trans. Ind. Appl., 36: 1267-1276.
CrossRef - Tsai, D.M. and C.Y. Hsieh, 1999. Automated surface inspection for directional textures. Image Vision Comput., 18: 49-62.
CrossRef - Kumar, A. and G. Pang, 2000. Defect detection in textured materials using Gabor filters. Conf. Rec. IEEE Ind. Appl., 2: 1041-1047.
CrossRef - Bodnarova, A., M. Bennamoun and S. Latham, 2002. Optimal Gabor filters for textile flaw detection. Pattern Recog., 35: 2973-2991.
CrossRef - Sari-Sarraf, H. and J.S. Goddard Jr., 1999. Vision system for on-loom fabric inspection. IEEE Trans. Ind. Appl., 35: 1252-1259.
CrossRef - Jasper, W.J., S.J. Garnier and H. Potlapalli, 1996. Texture characterization and defect detection using adaptive wavelets. Opt. Eng., 35: 3140-3149.
CrossRef - Yang, X.Z., G.K.H. Pang and N.H.C.Yung, 2002. Discriminative fabric defect detection using adaptive wavelets. Opt. Eng., 41: 3116-3126.
Direct Link - Unser, M., 1995. Texture classification and segmentation using wavelet frames. IEEE Trans. Image Process, 4: 1549-1560.
Direct Link - Daubechies, I., 1988. Orthonormal bases of compactly supported wavelets. Commun. Pure Applied Math., 41: 909-996.
CrossRefDirect Link - Kumar, A. and G. Pang, 2000. Fabric defect segmentation using multichannel blob detectors. Opt. Eng., 39: 3176-3176.
CrossRef - Kumar, A. and G.K.H. Pang, 2002. Defect detection in textured materials using optimized filters. IEEE Trans. Syst. Man Cybernet. B Cybernet., 32: 553-570.
CrossRef - Yang, X.Z., G.K.H. Pang and N.H.C. Yung, 2001. Fabric defect detection using adaptive wavelet. Proc. IEEE Int. Conf. Acoustics, Speech Signal Proc., 6: 3697-3700.
CrossRef - Nadhim, A.M.M., 2006. Introduction to multitone multiresolution wavelet analysis. Inform. Technol. J., 5: 494-502.
CrossRefDirect Link - Loum, G., C.T. Haba, J. Lemoine and P. Provent, 2007. Texture characterisation and classification using full wavelet decomposition. J. Applied Sci., 7: 1566-1573.
CrossRefDirect Link - Raju, U.S.N., B.E. Reddy, V.V. Kumar and B. Sujatha, 2008. Texture classification based on extraction of skeleton primitives using wavelets. Inform. Technol. J., 7: 883-889.
CrossRefDirect Link - Zhang, M., Z. Shang and J. Shen, 2008. Research on the image segmentation necessity for regions-based image processing. Inform. Technol. J., 7: 269-276.
CrossRefDirect Link - Venkateswaran, N. and Y.V.R. Rao, 2007. K-Means clustering based image compression in wavelet domain. Inform. Technol. J., 6: 148-153.
CrossRefDirect Link