
Mingxin Zhang
Department of Information and Communication Engineering, Xi`an Jiaotong University, China
Zhaowei Shang
College of Computer Science, Chongqing University, China
Junyi Shen
Department of Information and Communication Engineering, Xi`an Jiaotong University, China
Information Technology Journal
Year: 2008 | Volume: 7 | Issue: 2 | Page No.: 269-276


ABSTRACT
In this study, we propose a novel segmentation necessity metrics with the considerations of the implicit region sizes or image complexity. As for the region-based image processing such as region-based image retrieval, classification, pattern recognition or computer vision, one image should be segmented into different size and shape regions according to the colors or edge information of the image. However, for some images with great complexity or without meaningful implicit regions, these images should avoid segmentation, as the images with larger numbers of fragmentary regions would consume a great deal of computation or storages. It is necessary to exclude these images before segmentation. According the segmentation necessity metric, the minimum region sizes of the incoming image analysis, retrieval or object recognition is used to evaluate the values of segmentation necessity metrics. This is also the unique peculiarity of the metric when compared with other segmentation necessity metrics, e.g., wavelet modulus maxima points-based or connectivity index-based approaches. An image database with many categories is constructed to test the proposed segmentation necessity metric and other common approaches. Experiment results show the proposed metric could keep consistent with the implicit region sizes and numbers, while the numbers have directed relations with image segmentation complexity. It`s also verified that the proposed scheme can achieve more verdict accuracy than other schemes and could achieve the verdict accuracy of 98.5% at the requirement region sizes of 50 pixels.
PDF Abstract XML References Citation
How to cite this article
Mingxin Zhang, Zhaowei Shang and Junyi Shen, 2008. Research on the Image Segmentation Necessity for Regions-Based Image Processing. Information Technology Journal, 7: 269-276.
DOI: 10.3923/itj.2008.269.276
URL: https://scialert.net/abstract/?doi=itj.2008.269.276
DOI: 10.3923/itj.2008.269.276
URL: https://scialert.net/abstract/?doi=itj.2008.269.276
INTRODUCTION
As the use of digital image information grew rapidly in recent years, it became more important to manage these images efficiently. The need of analysis, retrieval, classifications and knowledge mining from larger numbers of images based their contents, is shared by many groups, including engineers, journalists, librarians, teachers, artists and historians. However, the content in one image is described by its contained objects in different forms under special scenes. So, it is usually necessary to extract objects from background or separate the image into several meaningful regions. Thus, the segmentation of images has always been a key problem in image analysis based contents.
The straightforward segmentation methods are those based expectation maximization (Fwu and Djuric, 1997), k-means methods (Chen et al., 1998) and threshold-based approaches (Xue and Gupta, 1993). However, when these approaches could not achieve accuracy segmentation regions. In recent literatures (Jianbo and Malik, 2000; Comaniciu and Meer, 2002; Chunming et al., 2005; Edward, 1993; Felzenszwalb and Huttenlocher, 2004; Larrabide et al., 2006; Montoya et al., 1999), some more accuracy image segmentation methods have been proposed, i.e., the methods based normalized cuts (Jianbo and Malik, 2000), mean shift clustering (Comaniciu and Meer, 2002), level set (Chunming et al., 2005), watershed (Edward, 1993), graph (Felzenszwalb and Huttenlocher, 2004), topological derivative (Larrabide et al., 2006), region growing (Montoya et al., 1999) and so on. In order to segment the complex images with large numbers of small objects, these image segmentation algorithms will consume much time, which should be avoided as these segmentation results may be unuseful to image content analysis or retrieval. Although the complex images occupy only one small part of image databases, it is essential to avoid segmenting these images. These complex images will be analyzed or retrieved as a whole rather than the segmented regions. Therefore, how to measure the necessity of image segmentation is one problem met in recently research works.
This problem was described by Dai et al. (2006) and Luo et al. (2001), respectively. The complexity of one image is used as the metric of segmentations. Actually, the segmentation complexity of images could be measured by that of any suitable descriptors (Shao et al., 2007), such as color, energy, orientation or phase. Thus, Dai et al. (2006) adopted the wavelet modulus maxima-based complexity indicator (WMMCI) as the metric of image complexity, which is defined as the ratio of the total number of wavelet modulus maxima points to the total number of pixels in one image. The number of wavelet modulus maxima points is essentially the measure of image edge information or acute points and only reveals how much the edge information is in the image as a whole. However, the edge information could not explicitly indicate the implicit regions to be disclosed by image segmentation, as some implicit regions may not contain acute points, e.g., the flat regions. As another image segmentation complexity measure, the Cluster Connectivity Index (CCI) was detailed in literature. On the basis of initial image segmentation by histogram based-multi-threshold approaches, its evaluation is conducted by averaging the connectivity of every pixel according its details in Luo et al. (2001). Nevertheless, just like the WMMCI, the CCI is only the measure of image segmentation complexity as a whole, which could not indicate the necessity of image segmentation. It is the size of implicit regions in one image that also determines the necessity of image segmentation, as we generally use those regions whose sizes in certain size ranges.
So, the necessity of segmentation should be evaluated according to image complexity together with the implicit region sizes. In this paper, we give one Segmentation Necessity Index (SNI) as the metric of segmentation necessity, which is defined as the couple of image complexity and its region sizes. According to the proposed metric, one image is determined to be further segmented if its SNI was lower than the given threshold. It is determined by the minimum implicit object sizes along with the image analysis time requirements. Thus, the RI-based necessity of images can roundly reflect the object analysis requirements and its complexity limitations, while the WMMCI and CCI-based approaches only disclose the complexity of segmentations, which could not avoid those unuseful segmentation results.
SEGMENTATION NECESSITY
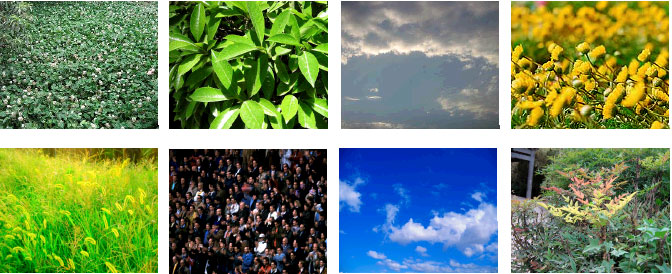
When the segmented regions of one image are meaningless to image analysis or one image is essentially indiscriptable, image segmentations should be avoided to save much computation overhead. In Fig. 1, we list 8 images to which image segmentation should be avoided and these images are taken in our school except the one containing peoples. Then their segmentation results are also presented in Fig. 2, where the Graph-based segmentation method as showed in literature (Felzenszwalb and Huttenlocher, 2004) is used to conduct image segmentations. As showed Fig. 2, there are two different representations i.e., one simple dominant region and larger numbers of small regions.
Though the more details of objects in images are disclosed explicitly, the regions from correspondent segmentations may be meaningless to image retrieval or classification. According to the contents of these images, they should not be segmented as they only confer one semantic object and should be dealt with as a whole rather than those segmented meaningless regions. Thus, this puzzle also presents us one challenge to detect those images that refuse to segmentation.
 | |
| Fig. 1: | Example images to be avoided with segmentation |
 | |
| Fig. 2: | The correspondent segmentation results of those images in Fig. 1 |
RELATED WORKS
As we known, there are no dedicated literatures to address the question about image segmentation and the problem were only partially involved in references where the segmentation necessity is determined by the given WMMCI or CCI according to their predefined thresholds, respectively. But, the selection of thresholds was not detailed in the two literatures. So, there are still many disclosed problems about segmentation necessity metrics to be worked out. Here, for the sake of preliminary information, we give some simple introductions to the WMMCI and CCI, which one can find more details in literatures by Dai et al. (2006) and Luo et al. (2001), respectively.
Wavelet modulus maxima points: Mallat and Hwang (1992) have proposed the use of wavelet transform modulus maxima for characterization of regularity of signals. By examining the wavelet modulus maxima, they could measure the local Lipschitz exponents of a signal. This turned out to be an effective way to locate the singularity or edges of an image. The points having local maximum of wavelet transform modulus are corresponding to the abrupt change locations in one image and the gradual changes are set to zero. The wavelet modulus maxima can represent the sharply focused edges and the inner texture details of the interest regions in image. Therefore, the wavelet maxima point density of the image is in proportion to the visual complexity of the whole image.
Define the ratio of the total number of wavelet modulus maxima points to the total number of pixels as the complexity indictor Cw of the image. Then, the low threshold Cw-low and high threshold Cw-high are specified to determine the segmentation necessity. If Cw < Cw-low, it shows that the image content is so consistent as not to be segmented, the whole image can be looked as region of interest. If Cw > Cw-high, it shows that the image has too many details to be segmented, the whole image can be looked as region of interest too.
For the example images refused to segmentation in Fig. 1, their corresponding wavelet modulus maxima images are showed in Fig. 3. The crowd image and flowers image having abundant texture details, their wavelet modulus maxima point densities are larger than Cw-high. But for sky images, the densities are smaller than Cw-low, it is difficult to know which region is interest region or background. If these four images were segmented, some meaningful regions would be lost.
Connectivity index: The image complexity is actually related to the cluster connectivity of image pixels according to their color values, so the cluster connectivity is used as the metric of image segmentation in literature by Luo et al. (2001). Thus, the cluster connectivity approaches are based on the pixel cluster of images.
According to the results of reference Luo et al. (2001), a hue histogram based multi-threshold approach is used for image segmentation. It is the most simple way and effective way in many cases, because different objects in practical world usually have different colors. Then, the cluster connectivity index Nk can be defined as:
| (1) |
 | |
| Fig. 3: | The wavelet modulus maxima point images of the images in Fig. 1 |
where, N is the image size and k is the size of the neighborhood area, Vk(x) is the ratio of the same labeled pixels number as the x-th pixel in the neighborhood one considers.
By calculating the connectivity index one can classify the images into different groups according to their complexity. The Nk is bigger if the complexity of the image is low. Then, two thresholds are specified, i.e., Nk-low and Nk-high. We assume that if Nk < Nk-low, the image is too complex for segmentation; if Nk-low < Nk < Nk-high, assume the complexity of the image is average and we do clustering for subsequent image analysis; if Nk > Nk-high, we assume that the image is simple. Thus, the too complex or simple images will be avoided for segmentation.
SEGMENTATION NECESSITY
The two approaches mentioned earlier ignore the implicit region sizes, which could only disclose those regions with acute changes rather than those flat regions. So, we propose another segmentation necessity metric, i.e., the Segmentation Necessity Index (SNI), which can synthetically reflect both the image complexity and the implicit region sizes. The segmentation complexity is actually consistent with the number of implicit regions, while the segmentation necessity is related to the dominant region sizes. Subsequently, we give the definition of SNI with general consideration of image complexity and region sizes.
Definition: Assume the initial segmentation regions can be denoted as {R(i) | iε{1,2,...,K}}, where K is the total region number in one image and the {N(i), iε{1,2,...,K}} is the correspondent region size in terms of pixels. Then, the segmentation regions are sorted in descending order according their sizes and {R(n,i) | n = 1,2,..., K, iε{1,2,...,K}}are the sorted regions, where the size of R(n,i) is larger than that of R(n+1,i). Given a specified region size N(0), the entropy for those regions whose sizes smaller than N(0) is firstly evaluated and then its scaled version by their total percentage in the image is defined as the segmentation necessity index of the image, i.e.,
| (2) |
where, SN(0) (K0) and HN(0) (K0) are denoted as the entropy for those regions whose sizes smaller than N(0) and their total percentage in the image, respectively. They are given as followings, i.e.,
| (3) |
In the formula (2), the parameter N is used to normalize the product of SN(0) (K0) and HN(0) (K0) according to the image size. The terms of SN(0) (K0) and HN(0) (K0) actually reflect the significance and the number of those small regions, respectively. As the percentage of every small region is much smaller than one, this results in the strong relations between the value of HN(0) (K0) and the number of small regions. The more the number of small regions, the larger the value of HN(0) (K0) is and the more segmentation complexity for the image. However, if the small regions only occupy one small part of the image with small SN(0) (K0), the value Ps of SNI is shrunk and the image should be further segmentation. Otherwise, the image should refuse to segmentation. Thus, the proposed metric for image segmentation necessity can reflect the requirement of region sizes and complexity.
Threshold: As the WMMCI and CCI, one specified threshold for the SNI must be given in advance to determine segmentation necessity. According to the SNI definition, the threshold is related with the requirement region size N(0), which is the smallest region size that should be retrieved or classification.
In order to give the threshold, let us consider the case, where N(0) is the largest region size in one image segmentation and all other regions are a little smaller than the given largest regions. Thus, the largest region and all other regions are almost equal to each other and the value of (2) can be considered as the critical value to determine whether the given image should refuse to segmentation, i.e., the threshold Ps(N(0)) for segmentation. So, the Ps(N(0)) is evaluated as:
| (4) |
In the case that N(0) is much smaller than the image size N, the (4) can be approximated as:
| (5) |
Implementation: In the color image, the Hue-Saturation-Intensity (HSI) color space represents the human concept of color well and it is more suitable for the analysis of color images. Usually, in the HSI color space, intensity is used for texture analysis and the other two components are used to extract the color feature. Here, the saturation can be considered as the importance index of the weight of color information. The higher the saturation, the more reliable the color information is. The perception of color of human eyes mainly comes from the hue component.
For a given color image, one hue histogram based multi-threshold (Xue and Gupta, 1993) is adopted for initial image segmentation to evaluate its segmentation necessity index. The multi-threshold method is the most simple way and effective way in many cases as different objects in practical world usually have different colors. The scheme to determine the segmentation necessity of images could be implemented as showed in Fig. 4. The label regions are conducted by the method given in reference of Haralick and Shapiro (1992), while the multi-threshold of hue-histogram multi-threshold segmentation approaches (Xue and Gupta, 1993) are achieved by detecting the maximum points of hue-histogram after smoothed by Gaussian functions.
 | |
| Fig. 4: | The flowchart of segmentation necessity |
RESULTS AND DISCUSSION
In order to validate the accuracy of image segmentation necessity, an image database with 121 images is constructed, which includes many categories of images, such as flower, sky, horse, dog, vegetable, leafs, grass, automobile, crowd, individual and buildings. According to the semantic content or complexity of images, each image in the database is flagged to indicate whether refuse to segmentation. Then, the proposed segmentation necessity and other approaches are used to check each image whether worthy of segmentation and their evaluated results are compared with the pre-flagged indicators to achieve their verdict accuracies.
Here, the WTMM point density (Mallat and Hwang, 1992), the connectivity index (Dai et al., 2006), the intensity variance based methods and the region size-based schemes (Shao et al., 2007) are used to evaluate the segmentation necessity together with the proposed scheme. The critical thresholds of WTMM point density, intensity variance and connectivity index based approaches, consist of high and low thresholds which are achieved by averaging the corresponding segmentation necessity metrics of 20 typical images that refuse to segmentations. So does the threshold of the region size-based scheme and the thresholds of the proposed scheme for different region sizes are worked out according to formula (5). The Table 1 shows their verdict accuracies, respectively for different approaches, which as the ratio of verdict results consist with the pre-flagged indicators to the total number of images in database. As indicated the numerical results, with different region sizes, the proposed scheme can achieve good accuracy than other schemes and the requirement region sizes has small effect on its accuracy.
 | |
| Fig. 5: | The curve of segmentation necessity metrics for all the images in the database |
| Table 1: | The verdict accuracies for different segmentation necessity schemes |
 | |
| Table 2: | Three typical images with low, medium and high values of segmentation necessity metrics |
 | |
Subsequently, the curve of segmentation necessity metric for all the images in the database is showed in Fig. 5, where the horizontal axis indicates the serial number of images in the database. In order to show the internal relation with the curve in Fig. 5, we check the several typical values with corresponding images in the followings. For the different size values of images with corresponding serial numbers are given in Table 2, where the given region size is 300 pixels. Several images with low, medium and high values of segmentation necessity metrics are also presented in Fig. 6, where the corresponding serial numbers are showed under these images. According to the results indicated in Table 2 and Fig. 6, the SNI values of these images are obviously consistent with their contents in terms of implicit meaningful regions. By this token, the values of curve in Fig. 3 at different location indicate the segmentation necessity of corresponding images and the proposed can describe the segmentation necessity accurately.
When the WTMM point density (Mallat and Hwang, 1992), the connectivity index (Dai et al., 2006), the intensity variance-based methods (Shao et al., 2007) and the region size-based schemes (Shao et al., 2007) are used to verdict the segmentation necessity of image 24 as showed in Fig. 6, their values are 0.27936, 0.84944, 0.21332 and 2243.5, respectively. According to their threshold in Table 2, the image 24 refuses to segmentation. However, its SNI values with 50, 100 region sizes are 5.86 and 6.3439, respectively and the image should avoid segmentation at region size 50 and further be segmented at region size 100. This case displays the adaptation of the proposed scheme with the requirement region sizes.
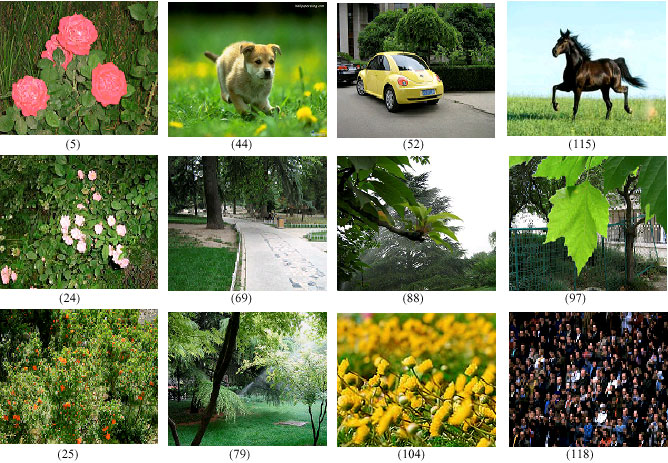 | |
| Fig. 6: | The typical images with different segmentation necessity metrics, where the first, medium and last rows are the those with low, medium and high values, respectively |
CONCLUSIONS
In order to figure out those images that refuse to segmentation in image analysis, several image complexity metrics were proposed in recent literatures, but they ignore the requirements of implicit region sizes in terms of meaningful region objects. So, a novel segmentation necessity metric is given in this study. As the pretreatment of content-based image analysis, the metric can describe the division degree of images in terms of semantic regions or complexity. According to the values, we could exclude those images with great complexity or without non-implicit regions and a great deal of computation and storage are saved. An image database with many categories is constructed to test the proposed segmentation necessity metric and other common approaches. Experiment results verify that the proposed scheme can achieve more verdict accuracy than other schemes and its results can keep consistent with the semantic segmentation of corresponding images.
REFERENCES
- Li, C., C. Xu, Y, C. Gui and M.D. Fox, 2005. Level set evolution without re-initialization: A new variational formulation. Proceedings of the International Conference on Computer Vision and Pattern Recognition, June 20-26, 2005, Washington, DC., USA., pp: 430-436.
CrossRef - Comaniciu, D. and P. Meer, 2002. Mean shift: A robust approach toward feature space analysis. IEEE Trans. Patt. Anal. Machine Intel., 24: 603-619.
CrossRefDirect Link - Zhang, K.D., H.Q. Lu and M.Y. Duan, 2006. Automatic salient regions of interest extraction based on edge and region integration. Proceedings of the International Symposium on Industrial Electronics, July 9-13, 2006, Montreal, Canada, pp: 620-623.
CrossRef - Felzenszwalb, P.F. and D.P. Huttenlocher, 2004. Efficient graph-based image segmentation. Int. J. Comput. Vision, 59: 167-181.
CrossRef - Fwu, J.K. and P.M. Djuric, 1997. EM algorithm for image segmentation initialized by a tree structure scheme. IEEE Trans. Image Process., 6: 349-355.
CrossRef - Haralick, R.M. and L.G. Shapiro, 1992. Computer and Robot Vision. Vol. 1, Addison-Wesley Longman Publishing Co., Boston, MA., USA., ISBN-13: 9780201108774, Pages: 672.
Direct Link - Shi, J. and J. Malik, 2000. Normalized cuts and image segmentation. IEEE. Trans. Pattern Anal. Mach. Intell., 22: 888-905.
CrossRefDirect Link - Larrabide, I., R.A. Feij, E. Taroco and A. Novotny, 2006. Configurational derivative as a tool for image segmentation. Proceedings of the ECCM 2006, June 5, 2006, Springer, Netherlands, pp: 188-188.
CrossRef - Mallat, S. and W.L. Hwang, 1992. Singularity detection and processing with wavelets. IEEE. Trans. Inform. Theor., 38: 617-643.
CrossRef - Montoya, M.D.G., C. Gil and I. Garcia, 1999. Load balancing for a class of irregular and dynamic problems: Region growing image segmentation algorithms. Proceedings of the 7th Euromicro Workshop on Parallel and Distributed Processing, February 12-14, 2007, Funchal, Portugal, pp: 163-169.
CrossRef - Shao, L., T. Kadir and M. Brady, 2007. Geometric and photometric invariant distinctive regions detection. Inform. Sci., 177: 1088-1122.
CrossRefDirect Link - Xue, D.Y. and V. Gupta, 1993. An improved threshold selection method for image segmentation. Proceedings of the Canadian Conference on Electrical and Computer Engineering, September 14-17, 1993, Vancouver, Canada, pp: 531-534.
CrossRef