
Ibrahim Sirkeci
European Business School London, Regent`s College, Regent`s Park, Inner Circle, London, NW1 4NS, United Kingdom
Asian Journal of Marketing
Year: 2009 | Volume: 3 | Issue: 1 | Page No.: 1-9
DOI: 10.3923/ajm.2009.1.9


ABSTRACT
This research presents an analysis of the ethnic breakdown of the population in England and Wales and show the potential of ethnic market segments. This study uses the data from 1991 and 2001 UK censuses and 2004 Annual Population Survey data to show the ethnic breakdown of the population in England and Wales. Since 1999, most of the increase in market value in terms of expenditures is likely to be generated by ethnic minorities in England and Wales. This study demonstrates that the ethnic minority market in England and Wales has rich opportunities to offer. Ethnic market in the UK is a fast growing market. This is a crude estimation of the market value but still indicates the broader trend. Further studies investigating both the customer expenditures and attitudes are needed to gain a comprehensive and insightful understanding of the ethnic market in the UK. This is the first analysis of the ethnic market potential in the UK based on the 2001 Census data which was released in 2004. The brief analysis could be helpful for practitioners who might be targeting ethnic segments in the UK. It is also a starting point providing a brief examination for those considering further research on the subject. This study offers the first ever review of the ethnic potential in England and Wales based on the 2001 Census data. It also highlights the potential of this data for marketing research.
PDF Abstract XML References Citation
How to cite this article
Ibrahim Sirkeci, 2009. Ethnic Marketing Potential in England and Wales: New Evidence from the 2001 UK Census. Asian Journal of Marketing, 3: 1-9.
DOI: 10.3923/ajm.2009.1.9
URL: https://scialert.net/abstract/?doi=ajm.2009.1.9
DOI: 10.3923/ajm.2009.1.9
URL: https://scialert.net/abstract/?doi=ajm.2009.1.9
INTRODUCTION
In marketing and consumer behaviour theories, ethnicity and religion has been a widely accepted factor and constituted a significant interest area in relation to cultural differences. Cultural and cross-cultural marketing practices are largely based on such differences. Cultural meanings, therefore, appear as crucial in understanding customers and responding to their needs, wants and interests. However, despite large ethnic minority populations, in many European countries including the UK, ethnic marketing has been underdeveloped if not neglected. This research present the revisit potential reasons for this neglect and present a broad demographic picture of the potential value of this market which may attract some interest among researchers and practitioners in the field. The UK as a whole will be referred sometimes, but for coherence and to avoid any inconsistencies which may arise from separate data collection processes in the censuses, Scotland and Northern Ireland will be excluded.
As socio-cultural differences are well-recognised in marketing literature, cultures are often associated with distinct rituals drawn from ethnic or religious characteristics. Recognizing such uniqueness is important for marketers to deliver a customized value to particular segments (Solomon et al., 2006). Ethnic groups are considered as subcultures with distinctive sets of beliefs and behaviours. Different ethnic contexts may come with distinct group membership structures as well as differences in reference group characteristics and their influences. Gender roles can also be different. Therefore, in market segmentation, race and ethnicity are believed to occupy an important place. Yet, in practice, many multi-ethnic national markets including the UK are lagging behind in addressing these differences.
Burton (2002) claims that, even with the recently increasing number of studies, ethnicity has not yet received enough attention in marketing theory and practice. The USA also suffers from a similar underperformance, where ethnic minorities represent a third of the market. Survey samples and published journal articles still have very small room for studies of ethnic markets (Stern, 1999; Cui, 2001; Burton, 2002). On the other hand, the value of ethnic marketing is clearly recognised. Organisations will face only a loss in competitiveness if they ignore these cultural differences. Marketing messages, along with products, need to be ethnicity sensitive. It is also necessary to note here that ethnicity should be considered with religion and ethno-religious categories will provide better, finer and more meaningful categories for marketers, at least in the UK context (Khattab et al., 2006 for details of ethno-religious categories). An earlier study using the distinctiveness theory revealed that minorities find advertisement messages communicated by their co-ethnics more trustworthy (Deshpande and Stayman, 1994). The same study also found that minority members are also likely to experience and express their identity as more salient compared to the majority. Therefore, not only tailoring the products according to ethno-religious differences, but also formulating the whole marketing mix accordingly and recruiting ethnic minority members are necessary. Organisations with ethnic minority members on board are more likely to better understand minority consumers and to better communicate with particular minority segments (Perkins et al., 2000).
In some sectors, ethnic information has been in use for some time. Specialist banking units have been created by HSBC, for example, to target Asian and Muslim segments. They have also been recruiting minority staff since 1997 for this purpose. Similarly, British Telecom has started campaigns since 2001 using ethnic media to target Asian, African and Jamaican segments. Boots, a major retailer of health and beauty products, introduced Halal baby food and collaborated with the Muslim Food Board to reach particular consumers. These indicate an emerging interest and awareness among businesses. Offering a variety of channels, the growing minority media is deemed to offer the necessary channels to reach particular ethno-religious consumer markets effectively. Among these channels, digital television, internet portals and specialty magazines, newspapers and sponsorship to community events can be considered.
Nevertheless, there are yet barriers for businesses keeping them away from the ethnic minority markets. Burton (2002) identifies four explanations to that: 1) negative perceptions about ethnic minorities in Britain describing them as underclass, so businesses are not free of these perceptions either, (2) absence of senior level managers of minority ethnic origin, who may lead the way to attract ethno-religious customers, (3) organizations’ lack of know-how for targeting minority markets, so they are not trying to do so and (4) population size of minorities is misperceived as small and therefore not economically viable to target. The fifth, or an expansion of the first explanation, could be increasing xenophobia and moral panic mainly created by frequent and negative representations of ethno-religious minorities in the UK by media and politicians, particularly since the 9/11 and the 7/7 London bombings. This adverse environment may lead businesses to communicate in a way in which ethnic and religious colours are hidden. The consideration from businesses’ point of view could be a potential backlash from majority native White customers, or worse it could be xenophobic blindness of the managers in charge. The following sections will focus on the fourth issue providing the current size of the ethno-religious populations with an emphasis on the geographical segregation that exists in England and Wales.
Ethnic Minorities in Britain
Despite being a very popular issue in media and politics, immigration into Britain is not a new phenomenon and it is the main source of multiethnic Britain’s wide variety of ethnic minorities today. Immigration-bound ethnic minorities in Britain are products of inflows of ethnically distinct populations over two hundred years, also coinciding with inflows of expatriates. The majority of those minorities are from former colonies and commonwealth countries, but there are also more recent groups of economic and political migrants who have contributed significantly to Britain’s ethnic mix.
| Table 1: | Major ethnic groups in the UK, 1991 and 2001 |
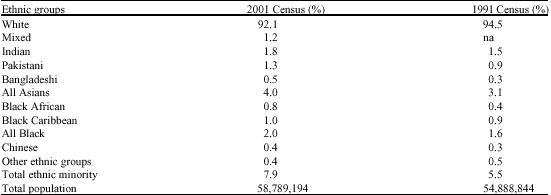 | |
| The 1991 UK Census and the 2001 UK Census (ONS, 2003) | |
Besides, a substantial group of undocumented migrants from a wide variety of backgrounds is believed to exist although figures are not available on those by definition. Also it needs to be mentioned that a significant number of foreign students and temporary migrants also exist and they are not normally represented in the censuses, which I am going to refer to in this study. Thus, the main ethnic groups in Britain are Irish, three Asian groups of Indian, Pakistani and Bangladeshi origin, two Black groups of Caribbean and Africans and Chinese (Table 1). A significant group of ethnically-mixed population has also become visible in the last census. However, this group is difficult to assess in terms of common practices, behaviours and expenditures, because it contains people with parents of white and another origin.
Opposite to the claims that ethnic minority population sizes are too small to target as posited by Burton (2002), according to the 2001 Census, the size of the minority population was 7.9% of the total population in the UK, that is the visible minorities. The term visible minorities is defined as persons, other than Aboriginal people, who are non-Caucasian in race or non-white in colour in Canadian Census and it refers to groups such as Chinese, South Asian, Black, South East Asian, Latin American and Japanese and so on (Statistics Canada, 1996). This seems also applicable to the UK context. This makes about 4.6 million and yet remains an underestimate when temporary migrants, students, visitors and other non-settlement categories are considered. Despite sizeable Asian and Black minority segments, there is little attention to these markets, which could also be related to the current adverse political environment in the UK. A mixture of heated debates among political parties, their reflections in the media, particularly over Muslims and asylum seekers coincide with stereotypical representations of ethnic minorities. As mentioned above, this could also be a reason for lack of interest in ethnic minority markets among researchers and practitioners as outlined by Burton (2002).
Table 1 shows the changes in ethnic composition of the UK population between 1991 and 2001. The share of ethnic minorities has increased by 2.4% in ten years. Some of this rise can be attributed to the introduction of the mixed category in the 2001 Census, but still there is a significant increase in Asian and Black populations. Equally important is the growth of immigrant populations. During the last decade or so, the UK witnessed a rapid increase in immigration and net-migration figures switched from zero in the early 1990s to over 170,000 at the end of the decade (ONS, 2004). However, immigration figures always accommodate a significant margin of error due to various types of flows including temporary and undocumented migration which makes it even harder to estimate any market potential on this ground.
Benefiting from the inclusion of the religion question in the 2001 Census, in an earlier study we have proposed ethno-religious categories to highlight differences between subgroups within major ethnic minority groups such as Asians (Khattab et al., 2006 forthcoming). While religious categories were significantly altering ethnic behaviour in the labour market, ethnicity was also found a significant marker crosscutting religious categories. Therefore, the use of ethno-religious categories can be extremely helpful in targeting some ethnic minorities for whom religion often dominates socio-cultural realms. For example, the lower level of labour market participation among Bangladeshi women is largely attributable to Islam rather than their South Asian origins. On the other hand, a religious-affiliation-based breakdown of the market may help marketers to identify larger and more viable segments to target: for example, many minority groups in Britain are Muslims (e.g., most Asians, some Black Africans and white minorities such as Turks) and they usually choose to consume Halal food. A recent research by Lindridge (2005) examined the relationship between religiosity and consumption patterns among Indians and Whites and described religion as an acculturation agent. According to this study, duration of stay for immigrant minorities was also found negatively correlated with diversity in consumption patterns (Lindridge, 2005). Thus, religious proximity and longer duration of stay are expected to speed acculturation and eventually erase consumption differences.
The residential segregation and concentration of ethnic minority populations in some areas are important for marketing purposes, as it may provide easy-to-target zones for some products. As shown in Fig. 1, per geo-demographic segmentation, we need finer assessment of different concentration levels in different countries and areas of the UK. England and Wales and major cities along with London have the highest proportions of minorities. Dorsett’s (1998) study found that ethnic minorities are concentrated in inner city areas of major cities and tend to live in deprived areas. For example, almost 80% of Black Africans and over 60% of Black Caribbean are living in London whereas mixed-race and Chinese communities are more evenly spread throughout the UK. Some recent studies also indicate high concentration levels for minorities (Khattab et al., 2006; Johnston et al., 2006).
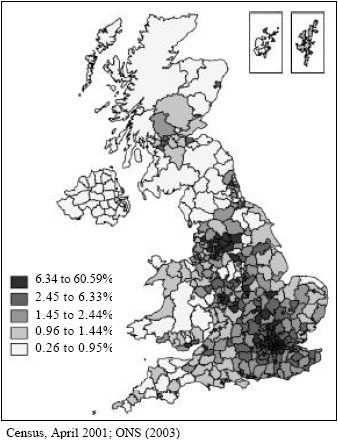 | |
| Fig. 1: | Geographic distribution of non-white populations in the UK, 2001 |
| Table 2: | Reported ethnic responses in the 2001 Census, England and Wales |
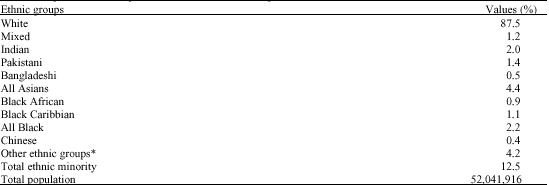 | |
| *: Including Irish and other whites who totals 3.8%. The 2001 UK Census (ONS, 2003) | |
Young and Growing Ethnic Minorities of England and Wales
The post-war era has been a period of rapid growth for immigration despite the long history of in-flows into Britain. The second half of the last century witnessed significant migration flows. Particularly during the last decade ethnic minority populations have been almost doubled. As can be shown Fig. 1, these minorities show a highly concentrated residential pattern today; most of them live in London and other major cities. Once Scotland and Northern Ireland is excluded, minority ethnic populations concentration in England and Wales becomes even stronger (Table 2). In the two countries, the total number of ethnic minority members is over 6.5 million and more than 4.5 million of them belong to non-white ethnic minorities. The minority segment comprises 2.3 million Asians, 1.1 million Blacks and about 2 million white minorities (ONS, 2003). The recent Annual Population Survey points to a further sharp rise in the ethnic minority population in England and Wales (ONS, 2006a). Non-white minorities rose to 9.8%, within which Blacks rose up to 2.4%, other ethnic groups to 2.4% and Asians to 4.1% between 2001 and 2004. This represents a total non-white minority population of over 5 million (over 7 million including White minorities).
The spatial segregation of ethnic populations may pose a danger in terms of integration and cohesion in the wider society, however, such segregation may also provide opportunities for marketers in terms of offering relatively easy access to distinct ethnic consumer groups. The greater the size of minority, it appears, the larger the number of channels available to reach them. Coinciding with spatial concentration, local media could be used and ethnicity-informed marketing mixes can be easily introduced without cross posting with the mainstream strategies. England and Wales have diverse populations with large ethnic (e.g., Asians and Blacks) and religious (e.g., Muslims) minorities, particularly in larger cities. Drawing upon previous studies, some recent analyses have reported that in Britain and elsewhere in Europe-immigrant minorities retained their ethnic identities while being assimilated into the economic and political life of the host society and they may wish to live in particular neighbourhoods where it can be easier to sustain their cultural distinctiveness (Khattab et al., 2006; Johnston et al., 2006). This clearly nullifies the acculturation theory as it implies that their consumption behaviour may not change easily as the duration of stay increases. Johnston et al. (2006) also showed that unlike the US where ghettoisation is widespread and assimilation into American identity is norm, in the UK there are hardly any such ghettos despite a few neighbourhoods with a high concentration of Asian minorities. It is, however, still the case that in large cities including London, Birmingham, Leeds and Sheffield, areas with very high ethnic concentrations exist. Such spatial concentration, however, as already underlined, can even be an opportunity for those seeking some way of easy targeting through available local (or ethnic) communication channels.
Curtis (2001) reported that ethnic communities in the UK account for 5.5% of the population and yet do not appear to be well targeted by companies. The Commission for Racial Equality (CRE) projected that by 2020, 10% of the UK population will be ethnic minorities with a possible spending power of over £ 15 billion (CRE, 2003). Before the last Census, Gooding (1998) intuitively estimated Britain’s ethnic population to be about 5.5 million with a spending power of around £ 12 billion per year (Khan, 2001). This would seem to be an underestimation even for England and Wales, where ethnic minorities already constitute 12.5% of the total population.
| Table 3: | Ethnic beauty market in the UK, 1995-1999 (US$m) |
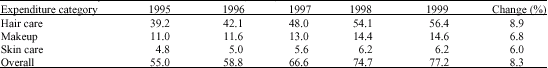 | |
| Source: Data monitor | |
Rarely do academic studies point out the existence of promising ethnic markets in the UK. However, some public organisations, in order to address different needs and concerns, are well-informed about ethnic and minority differences. These include local authority communications in minority languages as well as reports on appearance of ethnic members in media and ethnic minority responses to those (COI, 2003; IPA, 2001). Nwankwo and Lindridge (1998) claimed that the ethnic minority population in Britain is sizeable and represents a viable and untapped market segment. The growth of the ethnic beauty market in the UK during the second half of the 1990s can be taken as an example of how large the ethnic market could be and how fast it is growing. The ethnic beauty market today is worth possibly over £ 50 million. Considering the rapid growth of minority populations, one could and should expect a much larger size and a bigger change in the market growth rate (Table 3).
Similar growth tendencies can (and should) be expected in many other markets because of the rapid growth of ethnic populations in the country. In some cases, growth may mean a very sharp increase in the size of the market disproportionate to the size of the minority. This may even be more relevant in some sectors. In a US study on ATM usage, for example, it was found that ethnic minorities have a higher percentage of card ownership and they were more likely to use their cards than the white population (Burton, 2002).
Ethnic minorities display different demographic patterns. For example, Muslim families tend to have larger number of children, so do Pakistani and Bangladeshi families compared to Whites, whose birth rates are half those of the Muslim and Asian minorities. This is a contrast mainly coming from the tendency that White British people prefer to have fewer children or no children at all. Asians and many other minorities have a younger age profile compared to their indigenous counterparts.
One reason behind this is, surely, the age-selectivity of international migration. The likelihood of migration among younger age cohorts (of males, in particular) is much higher than that of children and elders. However, as mentioned above, different birth rates and hence different fertility patterns, also push for a younger age profile among minorities. This is also related to the stage in life of those immigration-bound minority members. As they immigrate in earlier, more productive, more adventurous stages, often before settling as families with children, it is more likely that they will build their families after arrival. Eventually these three inter-related features influence the age structure of minorities in England and Wales as in any other immigration country.
The younger age structure of the ethnic minority market compared to the White majority can be attractive for some goods and services markets (Pires and Stanton, 2000). The age structures of minorities, particularly Asian and Blacks, are quite different from the majority British Whites. The proportion of the population below 16 ranges from less than 5% for Irish to above 38% for Bangladeshis compared to 19% for British Whites (ONS, 2003). That refers to an ethnic youth market of around 1.5 million. More or less similar age dependency ratios can be expected for both minorities and the Whites but the latter having larger ratios for old-age dependency while the former have larger child dependency ratios. It is important to remember that for marketers, there will be generational differences in relation to acculturation and thus consumer behaviour diverse from or similar to the wider White native majority which need to be taken into account.
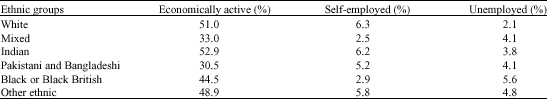
The income levels are significant indicators for marketers to determine viability of ethnic markets in terms of purchasing power of the ethnic pound. Instead of referring only to the, now outdated, 1994 PSI survey, I would like to outline economic activity patterns among wider ethnic groups in England and Wales, which may give some idea about the market potential compared to the White majority. It can also help to understand the value of small businesses where most minority self-employment is taking place. One explanation for the different economic activity patterns could be the different arrival periods of immigration-bound ethnic minorities: the longer the duration or earlier the arrival the smaller the differences. However, essential cultural differences must not be neglected here. The economic activity status can be used as a proxy determinant of purchase power given the lack of information on ethnic minorities income and expenditure levels. Despite large differences between the Mixed, Pakistani-Bangladeshi and White groups in terms of economic activity status, the employment patterns seem quite similar (Table 4). Therefore, unless future research into ethnic markets proves otherwise, it is possible to assume that their income level and purchase power will not be dramatically different than the majority, which in turn indicates a lucrative market potential.
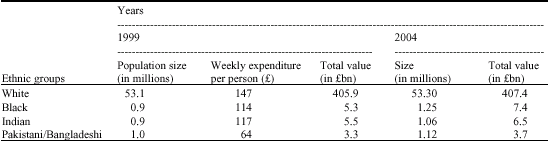
On the basis of changes in ethnic minorities’ share in the population, we can project the approximate potential value of the ethnic pound which may encourage more marketing research and action focusing on minority market potentials in the UK. The size of the ethnic market can be estimated on the basis of previous Social Trends data provided by ONS as the most recent reports did not present an ethnic breakdown (ONS, 2006a) of expenditure data. This projection is based on the assumption that weekly expenditure patterns have not changed. Thus it gives a rough idea of what would be the total value of expenditures by ethnic groups if they were the size of 2004 when exercising similar spending as in 1999. In other words, what would be the value if ethnic group sizes were larger than 6 years ago? It will give us a general idea about the market potential of ethnic minorities in terms of household expenditures per person.
A simple multiplication of weekly expenditures for each group gives us a total of a spending power of £ 14.1 billion a year for non-white ethnic minorities on the basis of the 1999 figures provided by the ONS (2000). In 2004, a projection of the same spending pattern would result in £ 17.6 billion per year proportionate to the increase in minority population size (Table 5). Yet another sum (possibly ranging between £ 8 to £ 12 bn depending on the level of spending per head) needs to be added to this figure for other minority and mixed race groups considering their 1.7 million strong population (1.1 m other minorities and 0.6 Mixed by the end of 2004). This total figure of up to £ 30 billion a year is not negligible even if we compare it with the Hispanic and African American market size in the USA of over £ 250 billion (Gentry and Holland, 1999).
| Table 4: | Economic activity differences by ethnicity in England and Wales (2001) |
 | |
| Annual Population Survey, 2004 (ONS, 2006b) | |
| Table 5: | Expenditure by major ethnic groups: change from 1999 to 2004 |
 | |
| Social trends (ONS, 2000) and Annual population survey, 2004 (ONS, 2006b) | |
Considering the younger age structure, it is very likely that the growth of the market value will be much higher than these conservative estimates. This is a strong evidence to support the claim that the ethnic minority market in the UK (largely concentrated in major cities of England) is rapidly expanding. This is due to different fertility behaviour, the younger age structure and high levels of immigration. These three demographic factors are key to an ever-increasing ethnic minority market size and potential.
CONCLUSION
Ethnicity-oriented targeting strategies and practices developed in the US markets are likely to spread into European markets simply due to global operations of TNCs that often pursue a balance between global and the local if nothing else. Another drive for this could be increasing multiculturalisation of Western European populations as a result of immigration into and within the European Union. Mixed populations and integrated European markets will come with sizeable and distinct ethnic customer groups that are viable to target economically and logistically. Residential segregation is a fact in the UK and in many other European countries. This appears as an advantage for marketers as it helps in geographical segmentation. Ethnic tensions and tensions between the locals and the immigration-bound minorities have posed a threat to these potential markets. These tensions may make especially commercial organisations reluctant to focus their marketing communications on ethnic distinctions because of a possible backlash effect among majority customers. More ethnographic marketing research is, however, yet needed to see the value of these assumptions.
Although ethnicity as a significant variable has been widely recognised in marketing literature (Pires et al., 2003), research is still limited. Nevertheless research on ethnic marketing is likely to grow in response to the increasing proportion and visibility of minorities in business, employment and consumer markets. In this endeavour, researchers will need to tackle new conceptual and methodological issues too. For example, simple ethnic group descriptions are not reflecting the real distinct classes we may find among minorities. In many cases, skin colour or geographic origin may not be enough to reflect different consumption, negotiation or lifestyle patterns. Thus, the ethno-religious categories we have proposed elsewhere might be at least a temporary cure to this issue (1668_con).
However, yet there will be difficulties in segmenting (or fragmenting) the market posed by the process of acculturation of ethnic minorities (Pires et al., 2003; Nwankwo and Lindridge, 1998). As rightly put by Raj in 2000 (Burton, 2002), many young people from ethnic minorities do not prefer to be called minorities as they develop a strong sense of belonging to the country of destination but not to their ancestors country. Therefore a delicate question is waiting for viable answers from marketers to see whether there is still different consumption patterns after any such close affiliation or integration of minorities have come to existence in Britain.
REFERENCES
- Burton, D., 2002. Incorporating ethnicity into marketing intelligence and planning. Market Intel. Plann., 20: 442-451.
CrossRefDirect Link - Johnston, R., M. Poulsen and J. Forrest, 2006. Ethnic residential segregation and assimilation in British towns and cities: A comparison of those claiming single and dual ethnic identities. Migration Lett., 3: 11-30.
Direct Link - Khattab, N., I. Sirkeci, T. Modood and R. Johnston, 2006. The impact of residential segregation and ethno-religious background on transition from school to work in Britain: A multilevel model. Proceedings of the Mobility, Ethnicity and Society Conference, March 16-17, 2006, Bristol: University of Bristol and University College London, pp: 1-31.
Direct Link - Lindridge, A., 2005. Religiosity and the construction of a cultural-consumption identity. J. Consum. Mark., 22: 142-151.
CrossRefDirect Link - Pires, G., J. Stanton and B. Cheek, 2003. Identifying and reaching an ethnic market: Methodological issues. Qual. Market. Res., 6: 224-235.
CrossRefDirect Link