

Ali Muhammad Ali Rushdi
Department of Electrical and Computer Engineering, Faculty of Engineering, King Abdulaziz University, P.O. Box 80204, Jeddah, 21589, Saudi Arabia
Alaa Mohammad Alturki
Department of Electrical and Computer Engineering, Faculty of Engineering, King Abdulaziz University, P.O. Box 80204, Jeddah, 21589, Saudi Arabia
Journal of Applied Sciences
Year: 2015 | Volume: 15 | Issue: 3 | Page No.: 431-443


ABSTRACT
A Threshold System (TS) is a reliability system whose success/failure is a threshold switching function in the successes/failures of its components. A Coherent System (CS) is one that is both monotone and with relevant components and hence its success function is expressible without any complemented literals. The Coherent Threshold System (CTS) is consequently described by strictly positive weights and threshold. It is a useful model for many decision or supply systems and being a natural generalization of the k-out-of-n system, it is typically called the weighted k-out-of-n system. This study lists fundamental properties of the CTS and presents two novel methods of deriving its weights and threshold. The first method is called the unit-gap method and proceeds by writing a set of 2n linear inequalities and then reducing this set utilizing symmetry and the elimination of dominated inequalities. The reduced set is then solved subject to the unit-gap restriction. The second method is called the fair-power method since it insists that the system weights be representative of component importance or voting power. This is achieved by making the weight of each component proportional to its Banzhaf index which is the weight of the Boolean derivative or difference of the system success with respect to the component success. The study further presents the recursive relations governing the success of the CTS, transforms these relations to the probability domain and then utilizes them together with appropriate boundary conditions to derive a recursive algorithm for computing the reliability of the CTS. The algorithm is given two pictorial interpretations in term of signal flow graphs and probability maps. An illustrative example demonstrates the implementation of the algorithm and the optimal order of the components to be followed during the algorithm implementation. The study is concluded with a general discussion of its findings compared to those of previously-published studies and an overview of potential future work.
PDF Abstract XML References Citation
Article History
Received: June 25, 2014;
Accepted: December 16, 2014;
Published: January 20, 2015
How to cite this article
Ali Muhammad Ali Rushdi and Alaa Mohammad Alturki, 2015. Reliability of Coherent Threshold Systems. Journal of Applied Sciences, 15: 431-443.
DOI: 10.3923/jas.2015.431.443
URL: https://scialert.net/abstract/?doi=jas.2015.431.443
DOI: 10.3923/jas.2015.431.443
URL: https://scialert.net/abstract/?doi=jas.2015.431.443
INTRODUCTION
A threshold system is defined as a system composed of n statistically independent 2-state components such that the success or failure of the system is a threshold (linearly separable) switching function in the successes or failures of the system components (Ball and Provan, 1988; Rushdi, 1990). By definition, a switching function S( ) = S(X1, X2, ……, Xn) is a threshold function (Muroga, 1971, 1979; Lee, 1978; Rushdi, 1990; Crama and Hammer, 2011) if there exists a set of real numbers W1, W2, ……,Wn, called weights and T, called a threshold, such that:
 | (1) |
A threshold function S() satisfying Eq. 1 will be denoted by H(n; ;  ; T). In Eq. 1, the magnitudes of the weights |Wi| were thought to give the relative importance of the respective values Xi in determining the values of the function (Hurst et al., 1985; Rushdi, 1990). However, we will demonstrate herein that this is not necessarily the case.
While a general switching function is characterized by 2n real coefficients (Hurst et al., 1985; Rushdi, 1987d), a threshold function is characterized by (n+1) real coefficients only (Muroga, 1971, 1979; Lee, 1978; Ball and Provan, 1988; Rushdi, 1990; Crama and Hammer, 2011).
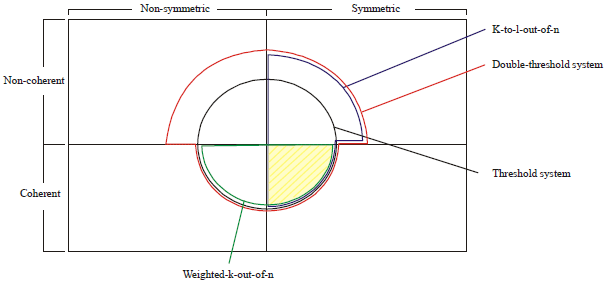 | |
| Fig. 1: | A Venn diagram depicting the relationships between symmetric systems, coherent systems, threshold systems and double-threshold systems and k-to-l-out-of-n systems. The k-out-of-n system is a special case of each of these systems |
The number Nh(n) of threshold functions of n variables grows very fast as n increases but the number Na(n) of all switching functions of n variables grows much faster (Hurst et al., 1985), e.g., Nh(2) = 14 and Na(2) = 16 while Nh(6) = 1.5×10⁷ and Na(6) = 1.8×10¹⁹. While the class of threshold functions is a somewhat restricted subset of all switching functions, it is still large enough to represent many systems of practical significance.
A normalization criterion usually employed in the selection of the weights of a threshold function involves the weight input summation:
 | (2) |
and sets to unity the difference or gap G between the minimum value of F when S() = 1 and its maximum value when S() = 0. For threshold functions with n≤8, this unit-gap leads to integer values for the weights (Hurst et al., 1985).
A threshold system can be neither symmetric nor coherent (Rushdi, 1990). However, threshold systems of significant practical utility are typically coherent. Therefore, we will deal herein with Coherent Threshold Systems (CTSs). A coherent system is causal  monotone and of relevant components (Rushdi, 2010). A monotone system is one whose reliability function is a non-decreasing function in each component reliability, i.e.:
 | (3) |
Component number m is relevant to the system if there exists a valid value for such  that
that  . Relevancy means that R() is not vacuous in (independent of) pm. If the reliability function R(p) of a coherent system with equal-reliability components is plotted versus p within the square 0.0≤p≤1.0, 0.0≤R(p)≤1.0, then it satisfies R(0.0) = 0.0 and R(1.0) = 1.0 and exhibits an S-shape, i. e., the curve R(p) versus p is monotonically non-decreasing and if it crosses the diagonal in (0.0, 1.0) (p versus p), it does so only once and from below.
A coherent system can also be defined by the nature of its success function in the switching domain, since such a function must be a monotone increasing switching function (Lee, 1978). Such a function S() enjoys the properties that:
| • | S = 0 for the all-0 cell, i.e., for = [0 0..…0]T |
| • | S = 1 for the all-1 cell, i.e., for = [11….1]T |
| • | Each of the prime implicants of S is a product of uncomlemeted literals and hence its loop covers the all-1 cell |
| • | Each of the prime implicates of  is a product of complemented literals and hence its loop covers the all-0 cell is a product of complemented literals and hence its loop covers the all-0 cell |
The coherent threshold system is typically referred to in the literature as the weighted k-out-of-n:G system (Wu and Chen, 1994; Higashiyama, 2001; Chen and Yang, 2005; Samaniego and Shaked, 2008; Wei and Zuo, 2008; Ursani, 2014). This means that the weighted k-out-of-n system should be visualized as a coherent non-symmetric threshold system of positive weights and a threshold equal to k. If further, all the weights are equal to 1, the weighted k-out-of-n:G system reduces to the ordinary k-out-of-n:G system (Rushdi, 1986a, 1991, 1993; Rushdi and Al-Hindi, 1993; Rushdi and Al-Thubaity, 1993; Rushdi and Al-Qasimi, 1994; Kuo and Zuo, 2003; Rushdi and Alsulami, 2007; Al-Qasimi and Rushdi, 2008; Amari et al., 2008; Rushdi, 2010). Therefore, the k-out-of-n:G system can be defined as a threshold system with a common positive weight for its components and a threshold equal to k multiplied by this common weight (Rushdi, 1990, 2010).
Figure 1 presents a Venn diagram depicting the relationship among symmetric systems, coherent systems, threshold systems, double-threshold systems (Rushdi, 1990), weighted-k-out-of-n systems, k-to-l-out-of-n systems (Rushdi, 1987b; Rushdi and Dehlawi, 1987) and k-out-of-n systems. It is clear from Fig. 1 that a threshold system can be either symmetric or non-symmetric and can independently be coherent or non coherent. If it is coherent, it is a CTS (a weighted k-out-of n system). If further it is symmetric, it reduces to the k-out-of n system which is a special case of each of the aforementioned systems.
The coherent threshold model can be successfully applied in the analysis or design of some practical real-life systems such as furnace systems (Zuo and Wu, 1996; Zuo et al., 1999) and static synchronous compensators (STATCOM) used in electric power systems (Lu and Liu, 2006). It is also applicable in the analysis and design of fleets of aircrafts (Cochran and Lewis, 2002), systems of pervasive computing (Hansen and Bronsted, 2010) and secure secret sharing (Shamir, 1979).
MATERIALS AND METHODS
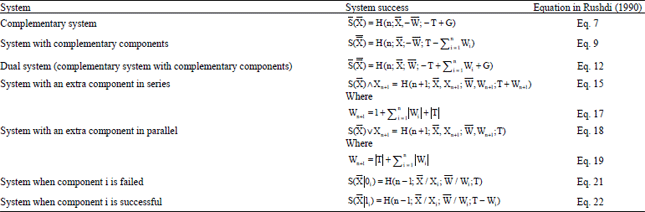
Fundamental properties of threshold systems: Threshold switching functions are studied extensively in the literature (Muroga, 1971; Rushdi, 1990; Crama and Hammer, 2011). Table 1 reproduces from Rushdi (1990) certain fundamental properties of threshold systems.
Classification of binary switching functions: Figure 2 displays the 16 binary switching functions:
 | (4) |
The figure identifies two non-threshold functions among them, namely, the odd-parity function (XOR) and the even-parity function (XNOR). Obviously, neither of these two functions is linearly separable. For the remaining 14 functions, Fig. 2 lists simplest integer weights and threshold. For 12 of these functions, the desirable unit gap (G = 1) is attainable while a zero gap (G = 0) is a must for the two constant functions of 0 and 1. These two functions, when viewed as system successes correspond to fictitious systems, that are always failed or always successful, respectively. Though these two systems are fictitious, they are very useful as boundary conditions for many recursive algorithms, including the one presented here. For the 12 unit-gap threshold systems, only four are coherent (the simplexes X1 and X2 and the series system (X1 AND X2) and the parallel system (X1 OR X2)) while the remaining eight systems are non-coherent. We will now cite a few practical examples of the above 2 component systems.
Examples of coherent and non-coherent threshold systems
Example 1: An airlines company employs an overbooking system for its flight reservation. Consider a flight that is already full, with two passengers X1 and X2 who have confirmed reservations and are still expected to come. The flight director will consider himself successful if neither X1 nor X2 shows up, i.e., his success is given by:
 | (5) |
where, we use Xi as an indicator variable for the arrival of passenger Xi. The success S is a non-coherent threshold function, namely the NOR function.
Example 2: There are only two passengers X1 and X2 in the waiting list for a certain flight, with priority given to X1. For the passenger X2 to succeed in joining the flight; he needs X1 to fail to show up in time while he himself should show up in time. Success from his point of view is:
 | (6) |
where, the success S is again a non-coherent threshold function, namely the X2-INHIBIT-X1 function.
| Table 1: | Threshold systems related to the threshold system with success S() = (n; , , T) |
 | |
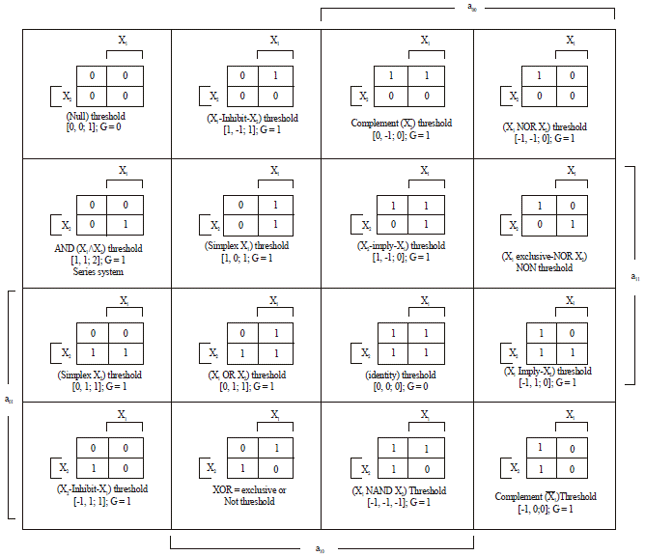 | |
| Fig. 2: | A display of the 16 binary switching functions  |
Example 3: The flight director considers himself successful if his flight departs with all available seats occupied. So far, there are two remaining vacancies with two passengers X1 and X2 still expected to come. The director’s success is:
 | (7) |
This is a series system, a special case of a CTS. Alternatively, if there is only one vacancy, with X1 and X2 still expected, then the director’s success is:
 | (8) |
This is a parallel system, again a special case of a CTS. Generally, if there are k remaining vacancies with n passengers still expexted to come (0≤k≤n), then the success to utilize all seats is the success of a k-out-of-n:G system (Rushdi, 1993, 2010). The series system in Eq. 7 is one for which k = n while the parallel system in Eq. 8 is one for which k = 1.
RESULTS
Derivation of weights and threshold: In this section, we present two methods for deriving the weights and threshold of a CTS. The first method is called the unit-gap method while the second method is called the fair–power method. We stress herein that the weights and threshold for a given threshold function or threshold system are not unique.
Unit-gap method: In the unit-gap method, we write 2n inequalities in the form  for the true vectors of the function for which f() = 1 and in the form
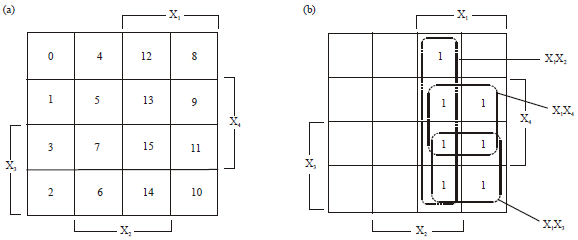
  for the false vectors of the function for which f() = 0. We reduce the number of inequalities by retaining only dominating inequalities for the CTS which are the inequalities corresponding to:
| • | The true cell within a prime-implicant loop that is farthest from the all-one cell (which is necessarily a true cell for the CTS, through which all the prime-implicant loops pass (Lee, 1978)) |
| • | The false cell within a prime-implicate loop that is farthest from the all-zero cell (which is necessarily a false cell for the CTS, through which all the prime-implicate loops pass (Lee, 1978)) |
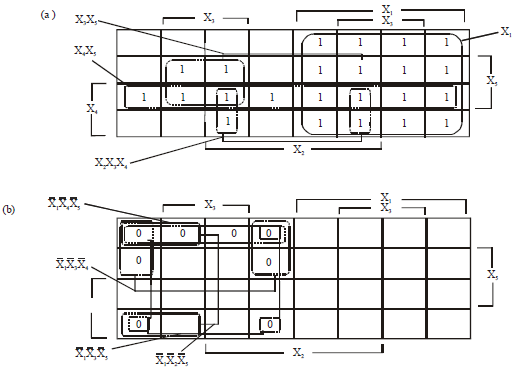 | |
| Fig. 3(a-b): | Prime (a) Implicants and (b) Implicates for the function f() in Eq. 9 |
Note that there is a single dominating inequality per prime implicant/implicate loop and if this inequality is satisfied, all inequalities pertaining to other cells of the loop are automatically satisfied. Therefore, the number of inequalities is reduced from 2n to the sum of the number of prime implicants and the number of prime implicates. The resulting set of inequalities is then searched for any further dominated inequality so as to delete it. Now, we change the non-strict inequalities of the true dominating cells into equalities  and replace the strict inequalities of the false dominating cells into equalities by using a certain gap
  , where typically G is taken as unity. We then solve the resulting system of equations. This system is typically under-determined and allows some arbitrary choices to be made. Symmetry should be utilized by arbitrarily using equal weights for variables in which the function f is partially symmetric.
Example 4: Consider the CTS described by the success function:
 | (9) |
Note that f is partially symmetric in X3 and X4, since:
 | (10) |
where, the function f is expressed as a complete sum, i.e., as a disjunction of all its prime implicants. Each prime implicant represents a minimal winning coalition, i.e., a coalition of components such that if they are all successful, then the system succeeds and if at least one of them fails, then the system fails. Figure 3 is a Karnaugh–map representation of the 5-variable function f while Fig. 4 lists the 25 = 32 inequalities governing and T for the CTS whose success is given by f. The locations of the dominating inequalities among these are shaded in Fig. 5. For example, the cell farthest from the all-one cell in the prime-implicant loop X1 is the true cell  or 10000 and corresponds to the non-strict inequality (W1≥T). The false cell farthest from the all-zero cell in the prime-implicate
  is the cell
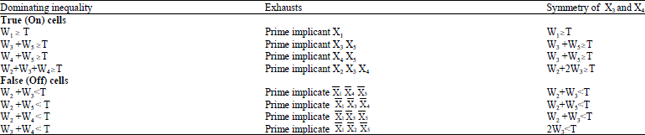
  or 01100 and corresponds to the strict inequality (W2+W3<T). Table 2 lists all the remaining dominating inequalities and demonstrates that they exhaust all 25 cells of the Karnaugh map for f, whether they are true cells within prime implicants or false cells within prime implicates. Table 2 also demonstrates that there is a short cut for writing the dominating inequalities that can avoid searching for the farthest cells within loops. The dominating inequality for a prime-implicant loop involves weights corresponding to the uncomplemend literals present in the loop expression. For example, the prime implicant X2 X3 X4 implies inequality {W2+W3+W4≥T}. On the other hand, the dominating inequality for a prime-implicate loop involves weights corresponding to the complemented literals missing in the loop expression. For example, the prime implicate
  implies the inequality {W3+W4<T}. Since the pertinent function f is partially symmetric in X3 and X4, we set W4 = W3 and end up with the inequalities in the rightmost column of Table 2. Here each of the inequalities {W3+W5≥T, W2+W3<T} appears twice and hence the extra instance of each of them is omitted.
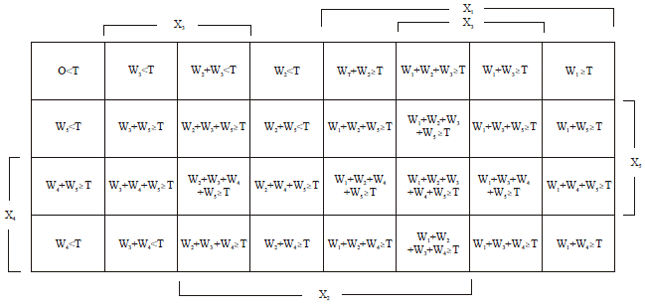 | |
| Fig. 4: | The 32 inequalities governing and T for example 4 |
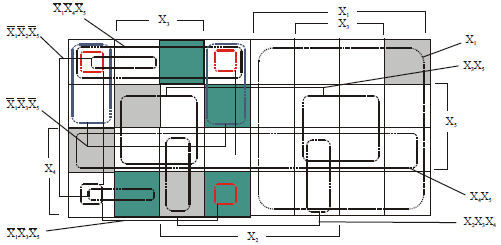 | |
| Fig. 5: | Locations of dominating inequalities within the prime implicants (grey) and prime implicates (green) of f in example 4 |
| Table 2: | Dominating inequalities for example 4 |
 | |
Also, we can combine the two inequalities {W3≥T-W5} and {T-W5>W2} to obtain {W3>W2} which means that {2W3<T} dominates {W2+W3<T} and hence, the latter inequality is deleted. Finally, we satisfy the remaining non-strict inequalities as equalities, namely:
 | (11a) |
and satisfy each of the strict inequalities as an equality by subtracting a unity gap from the right side, namely:
 | (11b) |
The two quantities (W2+2W3) and (2W3+1) are each equal to T and hence, W2 = 1. Equation 11 can be reduced to:
 | (12) |
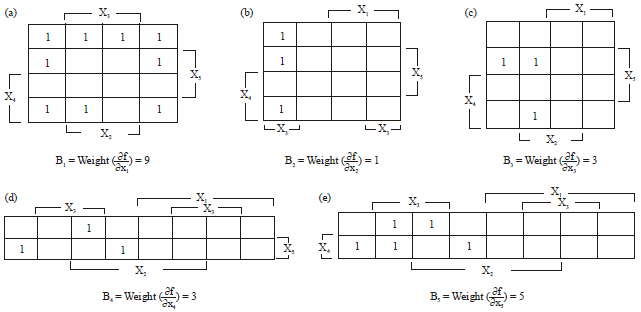 | |
| Fig. 6(a-e): | Calculation of the Banzhaf indices for the fuction f in Fig. 3 by folding of its Karnaugh map and XORing its entries |
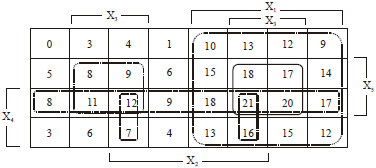 | |
| Fig. 7: | Pseudo-Boolean function F2( ) = 9X1+X2+3X3+ 3X4+5X5. Together with T = 7, a fair-power reformulation is obtained that recovers the original function in Fig. 3 |
Equality of (W3+W5) and (2+W5) means that W3 = 2 and hence, T = 1+2W3 = 5, W1 = T = 5, W5 = T-2 = 3. Finally, the CTS whose success is given by f in Eq. 9, has a threshold T = 5 and a set of weights = [5 1 2 2 3]T.
Fair-power method: This section remedies an earlier misconception that the weights of the components of a threshold system represent the relative importance of the respective components. In fact, a useful measure of components importance is the Banzhaf index (Banzhaf, 1965; Dubey and Shapley, 1979; Hammer and Holzman, 1992; Yamamoto, 2012) which is the weight of the Boolean derivative (Boolean difference) (Lee, 1978; Muroga, 1979) of the system success w.r.t., component success:
 | (13a) |
 | (13b) |
where,  and
and  are the subfunctions obtained by restricting the input of S such that Xi is a 1 or a 0, respectively.
In Eq. 13, the weight of the switching function ∂S/∂Xi is the number of its true vectors (Rushdi, 1987a, d), i.e., the number of vectors /Xi for which ∂S/∂Xi = 1 Note that each asserted cell (cell of 1 entry) in the map of (∂S/∂Xi) indicates a winning coalition in which Xi plays a pivotal role (a coalition that wins (ensures system success) if Xi joins it (if i is good) and loses (allowing system failure) if Xi defects from it (if i is failed)).
Example 4 (Revisited): Figure 6 illustrates a map method for computing the component importance or the Banzhaf indices for the function f in Eq. 9. The Karnaugh map for f in Fig. 3 is folded w.r.t., each variable Xi so that the cells  and coincide as a single cell whose entry is obtained by XORing the entries of the two original cells (Rushdi, 1986b). The final sets of indices obtained:
 | (14) |
can now serve as weights for the system. Figure 7 is a Karnaugh–map representation of the pseudo-Boolean function:
 | (15) |
which uses the indices  in Eq. 14 as weights . If we associate a threshold T = 7 with these weights, we recover the function f in Eq. 9.
The above example demonstrates that one can always reformulate the system representation using a component importance as its weight. An appropriate threshold is to be selected (that is not necessarily the original threshold). We call this reformulation the fair-power representation of the threshold system. This simple reformulation is not possible with restricted types of threshold systems such as certain voting systems in which the threshold and the sum of weights are fixed.
 | |
| Fig. 8(a-b): | (a) Karnaugh map for the pseudo- Boolean function F(x) = 8X1+4X2+2X3+X4 and (b) Success of the threshold system F(x) ≥ 9 |
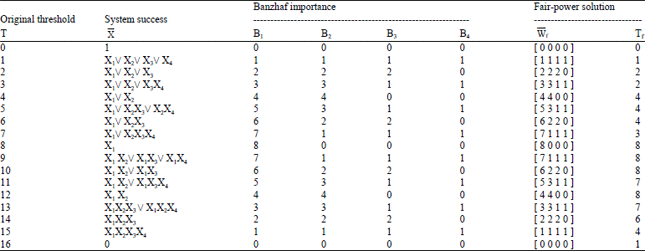
| Table 3: | Threshold system H (4;; 8, 4, 2, 1; T), a measure for its components importance and its fair-power reformulation |
 | |
For such systems, more involved algorithms exist for computing a vector of weights given a vector of Banzhaf indices (Aziz et al., 2007).
Example 5: Consider a 4-component CTS H (4; , 8, 4, 2, 1; T) of weights = [8 4 2 1]T. Figure 8a shows the pseudo-Boolean function:
 | (16) |
The system is successful for cells in Fig. 8a whose entry≥T. Figure 8b is a Karnargh map for system success () (for a threshold T = 9 and shows that:
 | (17) |
Table 3 shows all possible values for H (4; , 8, 4, 2, 1; T) with the threshold T varying in unit steps from 0-16. For each possible value of this original threshold T the table presents (a) A Boolean expression for system success, (b) Banzhaf importance indices and (c) A fair-power representation of the system employing a fair weight f and a fair threshold Tf. Note that it is possible to construct such a fair-power representation for the17 systems in Table 3. Note that f is the same for thresholds T and (16-T), 0≤T≤7.
Recursive relations and algorithm: Reliability analysis of a CTS is achieved herein by first formulating an expression for system success in the switching domain and then going to the probability domain. The Boole-Shannon’s expansion of system success S() about the variable Xi is (Rushdi and Goda, 1985):
 | (18) |
where, and i are the two subfunctions of system success obtained by restricting Xi to 0 and 1, respectively (Table 1).
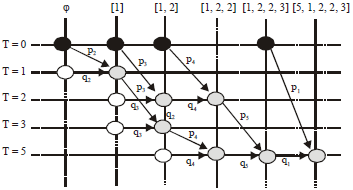 | |
| Fig. 9: | Best policy for the signal flow graph drawn on a grid of thresholds T and weights to represent nodes of R  when decomposition is with respect to components of the largest weights first when decomposition is with respect to components of the largest weights first |
Since Eq. 18 expresses S() in a disjoint sum-of-products (s-o-p) form, it is readily convertible (Rushdi, 1983b; Rushdi and Abdulghani, 1993; Rushdi and Ba-Rukab, 2004) into the following algebraic reliability expression:
 | (19) |
The recursive relation Eq. 19 is valid for n>0. It must be augmented by the nonrecurssive boundary conditions:
 | (20) |
The decomposition or recursion tree for the computation of R via Eq. 19 and 20 is a complete binary tree of (2n-1) nodes. Application of Eq. 19 contributes (2n-1-1) non-leaf nodes to this tree while execution of Eq. 20 adds 2n-1 leaves to it. Therefore, the temporal complexity of the present algorithm is exponential. To improve the efficiency of this algorithm, techniques for pruning the decomposition tree (Rushdi, 1990) must be introduced. For example, the recursion can be terminated at the level n = 1 (instead of the level n = 0) by using:
 | (21) |
Similarly, the recursion can be terminated at any node of n≥2 if it has a known reliability. For a CTS; the component weights are strictly positive and the boundary conditions Eq. 20 are replaced by:
 | (22a) |
 | (22b) |
So that, the decomposition tree is no longer a complete binary tree, though it still remains a strictly binary tree. If the CTS is also symmetric, the algorithm of Eq. 19 and 22 reduces to the quadratic-time algorithm given in (Rushdi, 1986b, 1991, 1993, 2010) for the k-out-of-n system.
Example 4 (revisited): Consider the CTS system H (5; ; 5, 1, 2, 2, 3; 5). Its reliability can be obtained by the recursive relations (Eq. 19) subject to the boundary conditions (Eq. 22). The best policy to implement these is to decompose the system success with respect to the component success of the largest weight first. The policy is demonstrated by the (Mason) Signal Flow Graph of Fig. 9, where black nodes are source nodes of value 1 and white ones are source nodes of value 0. Of course, these white nodes might be deleted, but they are retained to express boundary conditions explicitly. Note, that the black nodes are clustered together while the white nodes are clustered together, a feature always manifested in similar SFG’s for coherent systems (Rushdi, 1986b, 1990, 1991, 1993; Rushdi and Al-Hindi, 1993; Rushdi and Al-Thubaity, 1993; Rushdi and Al-Qasimi, 1994; Kuo and Zuo, 2003; Rushdi and Alsulami, 2007; Al-Qasimi and Rushdi, 2008; Rushdi, 2010) and always missing in similar SFG’s for non-coherent systems (Rushdi, 1987b; Rushdi and Dehlawi, 1987). The system reliability obtained from Fig. 9 is:
 | (23) |
Figure 10 is a probability map interpretation of Eq. 23. This map (Rushdi, 1983b) resembles a Karnaugh map with disjoint loops and with its map variables being the algebraic variables rather than the switching ones. Figure 11 demonstrates the worst policy of impleming recursion with respect to component successes of the smallest weights first. It produces the reliability expression.
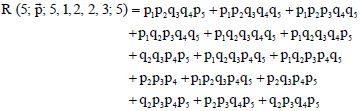 | (24) |
Which is interpreted by the probability map in Fig. 12. Correctness of the symbolic reliability expressions in Eq. 23 and 24 can be easily checked via the techniques by Rushdi (1983a).
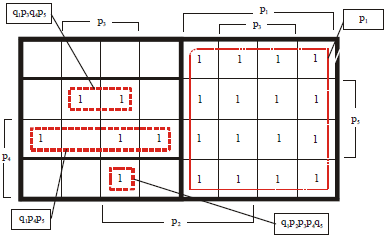 | |
| Fig. 10: | System reliability obtained by the best strategy of Fig. 9, when expressed on a probability map (Karnaugh map with disjoint loops) |
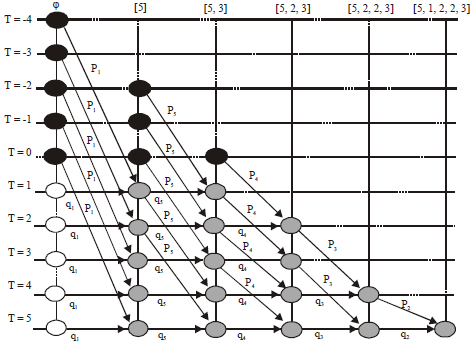 | |
| Fig. 11: | Worst policy for the signal flow graph drawn on a grid of thresholds T and weights to represent nodes of R when decomposition is with respect to components of the smallest weights first |
DISCUSSION
There are very few previously published studies on threshold systems such as the works of Ball and Provan (1988) and Rushdi (1990). This study differs significantly in scope and findings from these previously published studies.
This study concentrates on a wide class of threshold systems called Coherent Threshold Systems (CTSs).
It lists the fundamental properties and cites some examples of threshold systems. It also surveys the 16 two-component systems. Out of these, two systems are not threshold, two are fictitious, four are coherent threshold and eight are non-coherent threshold. The study also presents two methods for deriving the weights and threshold of a general CTS. The first method is called the unit-gap method and proceeds by writing a set of 2n linear inequalities and then reducing this set utilizing symmetry and the elimination of dominated inequalities. The reduced set is then solved subject to the unit-gap restriction. The second method is called the fair-power method since it insists that the system weights be representative of component importance or voting power. This is achieved by making the weight of each component proportional to its Banzhaf index which is the weight of the Boolean derivative or difference of the system success with respect to the component success. This study also employs a well-known paradigm of first formulating a reliability problem in the switching (Boolean) domain and then manipulating it in this domain before transforming it to the probability domain (Rushdi, 1983b, 1984; Rushdi and Goda, 1985; Rushdi, 1987c, 1988, 1993; Rushdi and Ba-Rukab, 2004, 2005). This is accomplished by introducing the recursive relations governing the success of the CTS, transforming these relations to the probability domain and then utilizing them together with appropriate boundary conditions to derive a recursive algorithm for computing the reliability of the CTS.
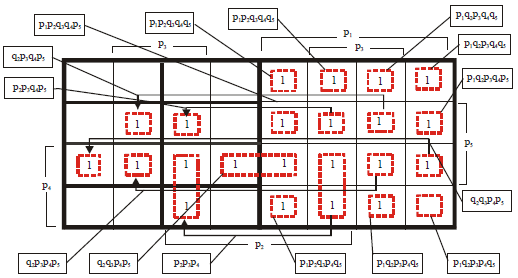 | |
| Fig. 12: | System reliability obtained by the worst strategy of Fig. 11, when expressed on a probability map (Karnaugh map with disjoint loops) |
The algorithm is given two pictorial interpretations in terms of signal flow graphs and probability maps. An illustrative example demonstrates the implementation of the algorithm and the optimal order of the components to be followed during the algorithm implementation. Results of this example satisfy all requirements for a valid symbolic reliability expression (Rushdi, 1983a).
In contrast with previously-published studies, this study has many pedagogical features and tutorial elements on threshold functions, their properties, two-dimensional recursive relations and the utilization of signal flow graphs and probability maps. The study has many novel contributions and findings including:
| • | A method for obtaining threshold and weights of a CTS by solving systems of linear inequalities with dominated inequalities deleted |
| • | A method of representing a CTS by fair- power weights and threshold |
| • | A comparison of ways for implementing recursion, in which decomposition with respect to a component success of a greater weight is found to result in more compact reliability expressions |
CONCLUSION
This study deals with Coherent Threshold System (CTSs) which are reliability systems that are synonymous with weighted k-out-of-n systems. The name difference reflects a paradigm shift. The CTSs name is a manifestation of the forceful paradigm of formulating a reliability problem in the switching (Boolean) domain, manipulating it therein and then transforming it back to the probability domain. By contrast, the alternative name of a weighted k-out-n system reflects total adherence to the probability domain without any utilization of the switching (Boolean) domain. As this study has repeatedly found and stressed, work in the switching (Boolean) domain offers many advantages including easy formulation, insightful conceptualization and powerful manipulation tools including heuristics and algorithms.
Immediate extension of the current study include double-threshold systems and non-coherent threshold systems (Rushdi, 1990). Investigation of possible application of the improved-disjoint-products (IMPD) method by Rushdi (1993) to a threshold system is very promising, especially when combined with the work by Higashiyama (2001), Higashiyama et al. (2009) and Higashiyama and Rumchev (2011, 2012). A special effort is also needed for the study of methods for solving linear inequalities (Ho and Kashyap, 1965; Mengert, 1970; Nagaraja and Krishna, 1974; Censor and Elfving, 1982; Yang and Murty, 1992). Another prospective direction for future work is to study the shellability aspects of threshold functions (which are known to be shellable (Ball and Provan, 1988; Crama and Hammer, 2011)).
ACKNOWLEDGMENTS
This article was funded by the Deanship of Scientific Research (DSR), King Abdulaziz University, Jeddah. The authors, therefore, acknowledge with thanks DSR technical and financial support.
REFERENCES
- Al-Qasimi, A.M. and A.M. Rushdi, 2008. A tutorial on how to efficiently calculate and format tables of the Binomial distribution. J. King Abdulaziz Univ.: Eng. Sci., 19: 3-17.
Direct Link - Aziz, H., M. Paterson and D. Leech, 2007. Efficient algorithm for designing weighted voting games. Proceedings of the IEEE International Multitopic Conference, December 28-30, 2007, Lahore, Pakistan, pp: 1-6.
CrossRef - Ball, M.O. and J.S. Provan, 1988. Disjoint products and efficient computation of reliability. Oper. Res., 36: 703-715.
CrossRefDirect Link - Banzhaf, III J.F., 1965. Weighted voting doesn't work: A mathematical analysis. Rutgers Law Rev., 19: 317-343.
Direct Link - Chen, Y. and Q. Yang, 2005. Reliability of two-stage weighted-k-out-of-n systems with components in common. IEEE Trans. Reliab., 54: 431-440.
CrossRefDirect Link - Cochran, J.K. and T.P. Lewis, 2002. Computing small-fleet aircraft availabilities including redundancy and spares. Comput. Oper. Res., 29: 529-540.
CrossRefDirect Link - Dubey, P. and L.S. Shapley, 1979. Mathematical properties of the Banzhaf power index. Math. Oper. Res., 4: 99-131.
CrossRefDirect Link - Hammer, P.L. and R. Holzman, 1992. Approximations of pseudo-Boolean functions: Applications to game theory. Zeitschrift Oper. Res., 36: 3-21.
CrossRefDirect Link - Higashiyama, Y., 2001. A factored reliability formula for weighted-k-out-of-n system. Asia-Pac. J. Oper. Res., 18: 61-66.
Direct Link - Higashiyama, Y., X. Cai and V. Rumchev, 2009. New algorithm for computing exact reliability formula of weighted-k-out-of-n system using SDP method. Proceedings of the 13th World Multi-Conference on Systemics, Cybernetics and Informatics, July 10-13, 2009, Orlando, FL., USA., pp: 92-97.
Direct Link - Higashiyama, Y. and V. Rumchev, 2012. New version of SDP method for weighted-k-out-of-n system. Proceedings of the 16th World Multi-Conference on Systemics, Cybernetics and Informatics, July 17-20, 2012, Orlando, FL., USA., pp: 120-125.
Direct Link - Ho, Y.C. and R.L. Kashyap, 1965. An algorithm for linear inequalities and its applications. IEEE Trans. Electron. Comput., EC-14: 683-688.
CrossRef - Nagaraja, G. and G. Krishna, 1974. An algorithm for the solution of linear inequalities. IEEE Trans. Comput., C-23: 421-427.
CrossRefDirect Link - Rushdi, A.M., 1983. Symbolic reliability analysis with the aid of variable-entered Karnaugh maps. IEEE Trans. Reliab., R-32: 134-139.
CrossRefDirect Link - Rushdi, A.M., 1983. How to hand-check a symbolic reliability expression. IEEE Trans. Reliab., R-32: 402-408.
CrossRefDirect Link - Rushdi, A.M., 1984. On reliability evaluation by network decomposition. IEEE Trans. Reliab., R-33: 379-384.
CrossRefDirect Link - Rushdi, A.M. and A.S. Goda, 1985. Symbolic reliability analysis via Shannon's expansion and statistical independence. Microelectron. Reliab., 25: 1041-1053.
CrossRefDirect Link - Rushdi, A.M., 1986. Utilization of symmetric switching functions in the computation of k-out-of-n system reliability. Microelectron. Reliab., 26: 973-987.
CrossRefDirect Link - Rushdi, A.M., 1986. Map differentiation of switching functions. Microelectron. Reliab., 26: 891-907.
CrossRefDirect Link - Rushdi, A.M., 1987. On computing the syndrome of a switching function. Microelectron. Reliab., 27: 703-716.
CrossRefDirect Link - Rushdi, A.M., 1987. Efficient computation of k-to-ℓ-out-of-n system reliability. Reliab. Eng., 17: 157-163.
CrossRefDirect Link - Rushdi, A.M., 1987. A switching-algebraic analysis of consecutive-k-out-of-n: F systems. Microelectron. Reliab., 27: 171-174.
CrossRefDirect Link - Rushdi, A.M., 1987. On computing the spectral coefficients of a switching function. Microelectron. Reliab., 27: 965-979.
CrossRefDirect Link - Rushdi, A.M. and F.M.A. Dehlawi, 1987. Optimal computation of k-to-ℓ-out-of-n system reliability. Microelectron. Reliab., 27: 875-896.
CrossRefDirect Link - Rushdi, A.M., 1988. A switching-algebraic analysis of circular consecutive-k-out-of-n: F systems. Reliab. Eng. Syst. Safety, 21: 119-127.
CrossRefDirect Link - Rushdi, A.M., 1990. Threshold systems and their reliability. Microelectron. Reliab., 30: 299-312.
CrossRefDirect Link - Rushdi, A.M., 1991. Comment on: An efficient nonrecursive algorithm for computing the reliability of k-out-of-n systems by A.K. Sarje and E.V. Prasad. IEEE Trans. Reliab., 40: 60-61.
CrossRefDirect Link - Rushdi, A.M. and K.A. Al-Hindi, 1993. A table for the lower boundary of the region of useful redundancy for k-out-of-n systems. Microelectron. Reliab., 33: 979-992.
CrossRefDirect Link - Rushdi, A.M. and A.O. Al-Thubaity, 1993. Efficient Computation of the sensitivity of k-out-of-n system reliability. Microelectron. Reliab., 33: 1963-1979.
CrossRefDirect Link - Rushdi, A.M. and A.A. Abdulghani, 1993. A comparison between reliability analyses based primarily on disjointness or statistical independence: The case of the generalized indra network. Microelectron. Reliab., 33: 965-978.
CrossRefDirect Link - Rushdi, A.M. and A.M. Al-Qasimi, 1994. Efficient computation of the P.M.F. and the C.D.F. of the generalized binomial distribution. Microelectron. Reliab., 34: 1489-1499.
CrossRefDirect Link - Rushdi, A.M. and O.M. Ba-Rukab, 2005. Fault-tree modelling of computer system security. Int. J. Comput. Math., 82: 805-819.
CrossRefDirect Link - Rushdi, A.M. and A.E. Alsulami, 2007. Cost elasticities of reliability and MTTF for k-out-of-n systems. J. Math. Stat., 3: 122-128.
CrossRefDirect Link - Rushdi, A.M., 2010. Partially-redundant systems: Examples, reliability and life expectancy. Int. Mag. Adv. Comput. Sci. Telecommun., 1: 1-13.
Direct Link - Samaniego, F.J. and M. Shaked, 2008. Systems with weighted components. Stat. Probab. Lett., 78: 815-823.
CrossRefDirect Link - Ursani, Z., 2014. Computing availability for redundant flow systems. Optim. Lett., 8: 715-725.
CrossRefDirect Link - Wei, L. and M.J. Zuo, 2008. Reliability evaluation of multi-state weighted k-out-of-n systems. Reliab. Eng. Syst. Saf., 93: 160-167.
CrossRefDirect Link - Wu, J.S. and R.J. Chen, 1994. An algorithm for computing the reliability of weighted-k-out-of-n systems. IEEE Trans. Reliab., 43: 327-328.
CrossRefDirect Link - Censor, Y. and T. Elfving, 1982. New methods for linear inequalities. Linear Algebra Applic., 42: 199-211.
CrossRefDirect Link - Yamamoto, Y., 2012. Banzhaf index and Boolean difference. Proceedings of the 42nd IEEE International Symposium on Multiple-Valued Logic, May 14-16, 2012, Victoria, BC., pp: 191-196.
CrossRef - Yang, K. and K.G. Murty, 1992. New iterative methods for linear inequalities. J. Optim. Theory Appli., 72: 163-185.
CrossRefDirect Link - Zuo, M., S. Chiovelli and J. Huang, 1999. Reliability evaluation of furnace systems. Reliab. Eng. Syst. Safety, 65: 283-287.
CrossRefDirect Link - Zuo, M.J. and Y. Wu, 1996. Reliability evaluation of a furnace system using the k-out-of-n and the consecutive-k-out-of-n reliability models. Proceedings of the IEEE International Conference on Systems, Man and Cybernetics, October 14-17, 1996, Beijing, China, pp: 3119-3123.
CrossRef - Lu, Z. and W. Liu, 2006. Reliability evaluation of STATCOM based on the k-out-of-n: G model. Proceedings of the International Conference on Power System Technology, October 22-26, 2006, Chongqing, China, pp: 1-6.
CrossRef