
Wichian Sittiprapaporn
Faculty of Medicine, Mahasarakham University, Maha Sarakham, Thailand
Journal of Artificial Intelligence
Year: 2012 | Volume: 5 | Issue: 3 | Page No.: 91-98


ABSTRACT
This study aims to review the fundamental concept of the clinical testing modalities in Evoked Potentials (EPs) recording strategies. The article starts from the terminology of EPs which means the electrical events specific to the brain’s receiving sensory input from the outside e.g., visual, auditory, somatosensory. EPs is a method to tune-in to one specific part of the sensory neuraxis from a primary sensory receptor. There are basically two distinct approaches or strategies to recording EPs, depending on the focus of interest in nervous system malfunctioning. Basic characteristics of EPs include, (1) they are time-locked to the stimulus, (2) short-latency EPs especially are deterministic, stereotyped or characterized by having the same latency, amplitude, polarity and waveform every time and (3) longer-latency EPs are somewhat less deterministic especially as regards displaying more latency jitter or variability, as well as being more subject to state variations e.g., drowsiness, sleep or coma. This article then concludes the usual clinical testing modalities in EPs.
PDF Abstract XML References Citation
Received: April 23, 2012;
Accepted: October 10, 2012;
Published: December 24, 2012
How to cite this article
Wichian Sittiprapaporn, 2012. Evoked Potentials: Electrical Events Specific to Brain’s
Receiving Sensory Input. Journal of Artificial Intelligence, 5: 91-98.
DOI: 10.3923/jai.2012.91.98
URL: https://scialert.net/abstract/?doi=jai.2012.91.98
DOI: 10.3923/jai.2012.91.98
URL: https://scialert.net/abstract/?doi=jai.2012.91.98
INTRODUCTION
The meaning of Evoked Potentials/Responses can be separated technical terminology as, (1) Evoked refers to “call forth, summon”, (2) Potentials refers to “electrical events” and (3) Responses refers to “answer to a call”, respectively. In other words, Evoked Potentials (EPs) means “the electrical events specific to the brain’s receiving sensory input from the outside e.g., visual, auditory, somatosensory” (Buchsbaum et al., 1982a, b; Chiappa, 1983; Clenney and Johnson, 1983; Celesia, 1985; Davis and Hiemoeller, 1968). EPs differ from Electroencephalogram (EEG) mainly in the sense that they are essentially a sub-set of the overall EEG activity, reflecting specifically short-latency sensory-evoked information processing by the central nervous system (CNS). Recording EPs is a method to tune-in to one specific part of the sensory neuraxis from a primary sensory receptor e.g., the retain in the back of the eyeball to its final destination the visual sensory cortex areas in the occipital lobes of the brain. This information is present in the raw, ongoing EEG all the time there is such sensory informational input but it is far too small to be seen and swallowed-up by the mass of other information processing going on in the brain at the same time (Dawson, 1947; Dolce and Waldeier, 1974; Duff, 1980; Duff et al., 1984; Federico, 1984; Epstein and Brickley, 1985). Beyond the standard EEG recording technology, recording EPs involves a spectral technique called signal averaging in order to extract the specific signal of interest from the on-going EEG activity in which it is embedded. Basic characteristics of EPs include: (1) they are time-locked to the stimulus, (2) short-latency EPs especially are deterministic, stereotyped or characterized by having the same latency, amplitude, polarity and waveform every time and (3) longer-latency EPs are somewhat less deterministic especially as regards displaying more latency jitter or variability, as well as being more subject to state variations e.g., drowsiness, sleep or coma (Goff, 1974; Halliday et al., 1977; Frances, 1989). This article then aims to point out the fundamental concept of the clinical testing modalities in evoked potentials recording strategies.
CLINICAL TESTING MODALITIES IN EVOKED POTENTIALS
The usual clinical testing modalities in EPs include, (1) Auditory such as Brainstem Auditory Evoked Response (BAER) and Long-Latency Auditory Evoked Potential (Long-Latency AEP), (2) Visual such as Flash Visual Evoked Potential (F.VEP) and Pattern-Shift Visual Evoked Response (Pattern-Shift VER) and (3) Somatosensory such as Median, Ulnar, Radial, Peroneal, Posterior Tibial and Trigeminal SEPs, respectively. Additionally, Cognitive Event-Related Potentials (ERPs) that record the brain’s task-related cognitive evaluation and decision-making processes following sensory input in various modalities are also performed and may be considered by some people to be just another kind of EPs, due to their utilizing technology designed for short-latency sensory EPs (Lehmann et al., 1969; Jewett et al., 1970; Jewett and Williston, 1971; Hjorth, 1973; Hassett, 1978; Hood and Berlin, 1986; Lehmann and Skrandies, 1979; Hjorth, 1982; Hallop, 1983; Sittiprapaporn et al., 2005).
Evoked Potentials (EPs) are still a relatively new field compared to Electroencephalogram (EEG). As yet, there is no standardization of nomenclature, stimulating and recording protocol or even a polarity convention. Some even insist on reviving the old arguments about monopolar vs. bipolar all over again with EPs as well as ‘how many electrodes where placed and what called’. Recent developments have begun to bring a certain degree of standardization to EPs which will almost certainly continue in the future. There are: (1) realization of the benefits afforded by multi-channel EPs recording for better localization and definition of scalp voltage field spread and (2) more full computerization including the application of Topographic Brain Mapping (TBM) technology to EPs in which the temporo-spatial progression of EPs response components can be followed on-line as the EPs is actually being recorded. In addition, EPs have a secure place in diagnosis, intra-operative O.R. monitoring and in various areas research. EEG’s firstborn has survived childhood and is an adolescent with a promising future (Petsche et al., 1970; Pfurtscheller and Aranibar, 1977, 1979; Morstyn et al., 1983a, b; Persson and Hjorth, 1983; Lehmann and Skrandies, 1984; Nuwer, 1985; Sittiprapaporn, 2011).
SIGNAL AVERAGING
It is normally known that everything starts with a trigger pulse from the computer. That does two things: (1) it signals the stimulus generator to send a stimulus to the patient/subject in either auditory, visual, somatosensory, external or missing mode and (2) it signals the computer itself to begin recording the patient’s/subject’s brain responses to the stimulus that come into it from the amplifiers. This response is then conditioned-amplified, filtered and digitized-and recorded for a pre-set period of time called an epoch, then stored in the computer’s memory banks called bins while the system waits for the next trigger pulse to repeat the procedure. This is done many times-how many depends on the size of the signal of interest relative to the ongoing EEG activity in which it is embedded. The smaller the signal buried in the noise, the more such signal averaging will be needed to resolve it. At the end, the result is averaged, displayed and saved to a permanent computer storage medium (e.g., a hard disk) (Dawson, 1947; Dolce and Waldeier, 1974; Duff, 1980; Duff et al., 1984; Epstein and Brickley, 1985; Federico, 1984).
The overall resolution of the signal average is primarily determined by two factors including: (1) the size of the A/D Converter measured in bits and (2) the number of addresses available in the temporary memory storage bin per channel of amplification. These affect two resolution capability of the recording and averaging system as follows:
The vertical (voltage) resolution: The size of the Analog-to-Digital Converter (ADC) in bits determines its’ ability to assign a different voltage level (a numerical value or digit) to minor variations in the height (voltage or amplitude) of the incoming continuously varying (analog) waveform. The greater the ADC size in bits, the more voltage levels are available to it to assign for the incoming recording, on a moment-to-moment basis, therefore the greater its’ power of resolution. This is of particular importance for every small voltage variations in the EP signal which might otherwise get lost (Buchsbaum et al., 1982a, b; Celesia and Cone, 1985; Chiappa, 1983; Clenney and Johnson, 1983; Davis and Hiemoeller, 1968).
The horizontal (time) resolution: The number of addresses in the memory bin per channel of amplification determines the averager’s ability to sample the incoming analog signal at an appropriate sample rate across the full duration of the recording epoch, sweep and window or analysis time. The higher the sample rate, the greater the averager’s ability to discern and characterize every fast (high frequency) components in the incoming EP signal which requires that each complete negative-positive cycle be represented by an absolute minimum of four data points and to reproduce them faithfully in the final, averaged waveform. Therefore, each time the computer sweeps through a stimulus/recording cycle, it adds the newly-recorded data to that previously stored in the appropriate memory bins, in strict chronological order, so that, e.g., new data recorded precisely 15.4 msec after the stimulus will be added to previously sampled data also recorded at the same 15.4 msec latency mark. At the end of ‘x’ number of successive sweeps or repetitions of the stimulus/recording cycle, the resultant data in the memory bins normalized or averaged by the number of repetitions performed (Goff, 1974; Halliday et al., 1977; Frances, 1989).
Because of the fact that especially for the relatively short-latency sensory EPs, these responses are essentially deterministic characterized by having the same latency, polarity, amplitude and waveform every time, as well as to the fact that they are time-locked to the stimulus while other EEG activities are random with respect to the stimulus, the signal averaging process will ultimately result in an averaging-IN of the specific response to the stimulus and averaging-OUT of the other, random EEG activities and the EP signal, even though it was initially very much smaller than the noise, will become clearly visible (Davis and Hiemoeller, 1968; Buchsbaum et al., 1982a, b; Chiappa, 1983; Clenney and Johnson, 1983; Celesia and Cone, 1985).
EVOKED POTENTIALS RECORDING STRATEGIES
Basically, there are two distinct approaches or strategies to recording EPs, depending on the focus of interest in nervous system malfunctioning: Central (CNS) and Peripheral (PNS) Nervous system. With the technical exceptions of electrooculogram (EOG) monitoring accompanying a Visual Evoked Potential (VEP) and Wave I of the Brainstem Auditory Evoked Response (BAER) which is essentially the acoustic nerve Action Potential (AP), the recording of peripheral nerve activity is fairly limited to the somatosensory EPs modality (Remond and Offner, 1952; Remond and Torres, 1964; Sato et al., 1971; Roth and Cannon, 1972; Pfurtscheller and Cooper, 1975; Sanley, 1975; Spehlmann, 1981, 1985; Tyner et al., 1983; Pockberger et al., 1985; Owen and Davis, 1985; Scherg and Von Cramon, 1985a, b) The descriptions for all types of EPs recordings are as follows:
Peripheral evoked potential recordings (somatosensory): Peripheral somatosensory EP recordings employ stimulation at the distal-most segment of either a nerve trunk or dermatome, with subsequent recordings of the ascending volley at various points along the neuraxis in transit up to an including the cerebral cortex. Some of these recording points simply lie along the route taken by the nerve and represent the recording of peripheral nerve Action Potentials (APs)---so-called travelling waves that vary in latency, depending on the location of the recording electrode site along the neuraxis but not in amplitude (given the same depth from skin to underlying nerve). Examples of peripheral somatosensory evoked potential include (1) Erb’s point (overlying the brachial plexus) for upper limb stimulation and (2) popliteal fossa (overlying the posterior tibial nerve at back of the knee) for lower limb stimulation (Remond and Offner, 1952; Remond and Torres, 1964; Roth and Cannon, 1972; Sanley, 1975; Pfurtscheller and Cooper, 1975; Pockberger et al., 1985; Owen and Davis, 1985).
Other recording points overlie synapses---synaptic or so-called standing potentials that very in amplitude, depending on the location of the recording electrode site (the closer to the synaptic epicenter, the higher the amplitude) but not in latency (as long as they are still close enough to the synapse to b recordable). Examples are (1) Cervical Spinal Column segments 2 (SC2)-Cervical Spinal Column segments 5 (SC5), overlying multiple synaptic inputs to the spinal cord from the median or ulnar nerves) for upper limb stimulation and (2) Thoracic Spinal Column segment 12 (ST12), overlying multiple synaptic inputs to the spinal cord from posterior tibial nerve roots that enter the spinal column at several lower lumbar levels, then run upwards within the cauda equine until they reach the lower end of the spinal cord for lower limb stimulation.
Conversely, a recording site at Lumbar Spinal Column segment 3 (SL3) would record mostly the AP (travel wave) from posterior tibial nerve entry into the spinal column, whereas a recording site at Lumbar Spinal Column segment 1 (SL1) would record both the above-mentioned AP seen at SL3, where it was recorded at a very slightly earlier latency and the synaptic or standing potential’s from the root entry zone activity a little bit higher up-at ST12. The latency of this second part of the compound wave recorded at SL1 would be the same as what would be recorded by an electrode at ST12 but the amplitude would be higher at ST12, due to its closer proximity to the synaptic event or the epicenter of the activity. Consequently, the information of clinical benefit derivable from a peripheral recording strategy is mainly related to determining the level of lesion, i.e., the discrimination between central (CNS) and peripheral (PNS) nervous system pathology. Their point of separation is the root entry zone synaptic potential that occurs as the peripheral nerve centers the spinal cord (Sato et al., 1971; Tyner et al., 1983; Spehlmann, 1981, 1985; Scherg and Von Cramon, 1985a, b; Pockberger et al., 1985; Owen and Davis, 1985).
Central evoked potential recordings (all modalities): Central EP recordings for all modalities focus on Scalp electrode site only, to discern the arrival of sensory stimulation messages at the cerebral cortex. Information of clinical benefit derivable from a central recording strategy is mainly related to determining the cortical arrival latency and its scalp topography. Unfortunately, the scalp topographic distribution of the voltage field gradient for somatosensory EP cortical arrival tends to be extremely variable compared to, e.g., auditory or visual cortex scalp topographies and is not of very much use, unless it is either severely reduced in size or absent entirely on one side or the other. This strategy is mostly for used for auditory and visual studies where it is much more helpful in identifying pathological cerebral functioning. An acceptably accurate computation of Sensory Nerve Conduction Velocities (SNCVs) from either of the two above-described recording strategies is possible, given both the latency (in millisecond) of the recorded potential at the recording site in question and that site’s distance (in centimeter) from the peripheral (distal) stimulating site (Remond and Offner, 1952; Remond and Torres, 1964; Roth and Cannon, 1972; Pfurtscheller and Cooper, 1975; Sanley, 1975; Pockberger et al., 1985; Owen and Davis, 1985).
SOME SAMPLE DATA OF EVOKED POTENTIALS
Following are some figures and illustrations showing examples of some of EPs recorded at the Clinical and Research Electro-Neurophysiological Laboratory, Neuro-Behavioral Biology Center, Mahidol University, Thailand. One of examples was the design and construction of a stimulator control unit and set of LED Goggles for Flash Visual EPs (F.VEPs). This unit was specially designed primary for Research work at the Clinical and Research Electro-Neurophysiological Laboratory and therefore contains some capabilities not normally seen in commercially available units designed for clinical work.
Figure 1 shows a F.VEP from a normal 26 yr-old male human subject, comparing the responses seen to differences in flash duration, as well as to varying the number of red LEDs actually lit-up in the Goggles, both of which affect the stimulus intensity.
Figure 2 shows F.VEP data from the same subject, comparing differences in the stimulus repetition rate, the epoch duration and the sensitivity (display) scale, respectively. Shorter recording epochs are sometimes useful for recording and visualizing fine, fast frequency details of a response that could be missed using longer Inter-Sample Intervals (ISI).
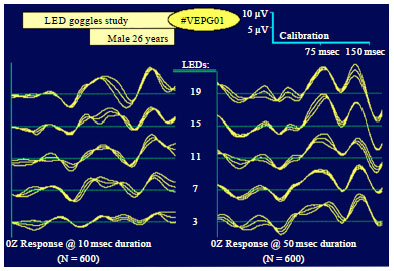 | |
| Fig. 1: | Example of the design and construction of a stimulator control unit and set of LED Goggles for flash visual EPs (F.VEPs) (Kotchabhakdi, 2005) |
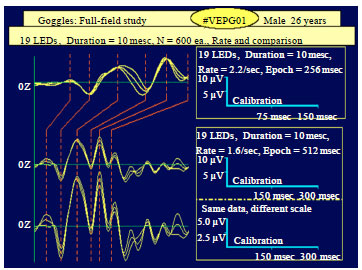 | |
| Fig. 2: | Example of the design and construction of a stimulator control unit and set of LED goggles for flash visual EPs (F.VEPs) from the same subject as in Fig. 1, comparing differences in the stimulus repetition rate, the epoch duration and the sensitivity scale (Kotchabhakdi, 2005) |
Visible are both the apparent differences that are seen when the data is displayed on either a different time scale (512 vs. 256 msec) or different amplitude/voltage scale (0-5 vs. 0-10 μV) (Fig. 2).
CONCLUSION
Evoked potentials means the electrical events specific to the brain’s receiving sensory input from the outside e.g., visual, auditory, somatosensory. EPs differ from EEG mainly in the sense that they are essentially a sub-set of the overall EEG activity reflecting specifically short-latency sensory-evoked information processing by the central nervous system. Recording EPs is a method to tune-in to one specific part of the sensory neuraxis from a primary sensory receptor. There are basically two distinct approaches to recording EPs, depending on the focus of interest in nervous system malfunctioning.
REFERENCES
- Buchsbaum, M.S., A.C. King, J. Cappelletti, R. Coppolla and D.P. van Kammen, 1982. Visual evoked potential topography in patients with schizophrenia and normal controls. Adv. Biol. Psychiatry, 9: 50-56.
Direct Link - Celesia, G.G. and S. Cone, 1985. Visual evoked potentials: A practical approach with the guidlines for clinical evoked potential studies. Am. J. EEG Technol., 25: 93-113.
Direct Link - Dawson, G.D., 1947. Cerebral responses to electrical stimulation of peripheral nerve in man. J. Neurol. Neurosurg. Psychiatry, 10: 134-140.
Direct Link - Dolce, G. and H. Waldeier, 1974. Spectral and multivariate analysis of EEG changes during mental activity in man. Electroencephal. Clin. Neurophysiol., 36: 577-584.
CrossRef - Federico, P.A., 1984. Evoked-Related Potential (ERP) correlates of cognitive styles, abilities and aptitudes. Personality Individual Differences, 5: 575-585.
CrossRef - Hjorth, B., 1973. The physical significance of time domain descriptors in EEG analysis. Electroencephal. Clin. Neurophysiol., 34: 321-325.
CrossRef - Hjorth, B., 1982. An adaptive EEG derivation technique. Electroencephal. Clin. Neurophysiol., 54: 654-661.
CrossRef - Jewett, D.L., M.N. Romano and J.S. Williston, 1970. Human auditory evoked potentials: Possible brain stem components detected on the scalp. Science, 167: 1517-1518.
CrossRefDirect Link - Jewett, D.L. and J.S. Williston, 1971. Auditory evoked far fields averaged from the scalp of humans. Brain, 94: 681-696.
PubMed - Lehmann, D., R.N. Kavanagh and D.H. Fender, 1969. Field studies of averaged visually evoked EEG potentials in a patient with a split chiasm. Electroencephal. Clin. Neurophysiol., 26: 193-199.
CrossRef - Lehmann, D. and W. Skrandies, 1979. Multichannel evoked potential fields show different properties of human upper and lower hemiretina systems. Exp. Brain Res., 35: 151-159.
CrossRef - Morstyn, R., F.H. Duffy and R.W. McCarley, 1983. Altered P300 topography in schizophrenia. Arch. Gen. Psychiatry, 40: 729-734.
PubMed - Morstyn, R., F.H. Duffy and R.W. McCarley, 1983. Altered topography of EEG spectral content in schizophrenia. Electroencephalogr. Clin. Neurophysiol., 56: 263-271.
CrossRef - Nuwer, M.R., 1985. A comparison of the analyses of EEG and evoked potentials using colored bars in place of colored heads. Electroencephalogr. Clin. Neurophysiol., 61: 310-313.
CrossRef - Persson, A. and B. Hjorth, 1983. EEG topogram-an aid in describing EEG to the clinician. Electroencephalogr. Clin. Neurophysiol., 56: 399-405.
CrossRef - Petsche, H., P. Rappelsberger and R. Tappl, 1970. Properties of cortical seizure potential fields. Electroencephalogr. Clin. Neurophysiol., 29: 567-578.
CrossRef - Pfurtscheller, G. and A. Aranibar, 1977. Event-related cortical desynchronization detected by power measurements of scalp EEG. Electroenceph. Clin. Neurophys., 42: 817-826.
Direct Link - Pfurtscheller, G. and A. Aranibar, 1979. Evaluation of Event-Related Desynchronization (ERD) preceding and following voluntary self-paced movement. Electroencephalogr. Clin. Neurophysiol., 46: 138-146.
CrossRef - Pfurtscheller, G. and R. Cooper, 1975. Frequency dependence of the transmission of the EEG from cortex to scalp. Electroencephalogr. Clin. Neurophysiol., 38: 93-96.
CrossRef - Pockberger, H., H. Petsche, P. Rappelsberger, B. Zidek and H.G. Zapotoczky, 1985. On-going EEG in depression: A topographic spectral analytical pilot study. Electroencephalogr. Clin. Neurophys., 61: 349-358.
CrossRef - Remond, A. and F. Torres, 1964. A method of electrode placement with a view to topographical research. Electroencephalogr. Clin. Neurophys., 17: 577-578.
CrossRef - Roth, W.T. and E.H. Cannon, 1972. Some features of the auditory evoked response in schizophrenics. Arch. Gen. Psychiatry, 27: 466-471.
Direct Link - Sato, K., H. Kitajima, K. Mimura, N. Hirota, Y. Tagawa and N. Ochi, 1971. Cerebral visual evoked potential in relation to EEG, Electroenceph. Clin. Neurophys., 30: 123-138.
CrossRef - Scherg, M. and D. von Cramon, 1985. Two bilateral sources of the late AEP as identified by a spatio-temporal dipole model. Electroencephalogr. Clin. Neurophysiol./Evoked Potentials Sect., 62: 32-44.
CrossRef - Scherg, M. and D. Von Cramon, 1985. A new interpretation of the generators of BAEP waves I-V: Results of a spatio-temporal dipole model. Electroencephalogr. Clin. Neurophysiol./Evoked Potentials Sect., 62: 290-299.
CrossRef - Sittiprapaporn, W., 2011. P300 topography maps of tone perception in the tonal speaker brain. Aust. J. Basic Applied Sci., 5: 1982-1987.
Direct Link - Sittiprapaporn, W., M. Tervaniemi, C. Chindaduangratn and N. Kotchabhakdi, 2005. Preattentive discrimination of vowel across-and within-category- change in consonant-vowel syllable. NeuroReport, 16: 1513-1518.
PubMedDirect Link