
Jaime A. Teixeira da Silva
Department of Horticultural Science, Faculty of Agriculture, Kagawa University, 2393, Miki-cho, Kita-gun, Kagawa 761-0795, Japan
International Journal of Botany
Year: 2005 | Volume: 1 | Issue: 1 | Page No.: 93-99


ABSTRACT
This study analyses the effectiveness of 12 previously published DNA extraction protocols (used for the extraction of DNA in various species) in contrast to 3 commercially available plant DNA extraction kits. In addition, an innovative, sonication-based, simple and efficient mini-prep to extract DNA from chrysanthemum, tobacco and Spathiphyllum were presented. DNA purity and quantification, EcoRI-restricted total genomic DNA and RAPD analyses using three separate 10-mer primers and 5 primer sets (5SP3/4, NT107-1/2, LFY3, trnh and trnK2R) show differences in the efficiency and applicability of the extraction method, even within the same clonal cultivar. Variation between explant source may be related to cytological endopolyploidy, 8C cells abundant in callus, with between 1-5% 16C cells. These factors should be carefully considered when selecting a DNA extraction protocol or source of plant material for somaconal variation or population genetic studies, or for transgene integration analyses.
PDF Abstract XML References Citation
How to cite this article
Jaime A. Teixeira da Silva, 2005. Effectiveness of DNA Extraction Protocols for Horticultural and Physiological
Model Plant Analyses. International Journal of Botany, 1: 93-99.
DOI: 10.3923/ijb.2005.93.99
URL: https://scialert.net/abstract/?doi=ijb.2005.93.99
DOI: 10.3923/ijb.2005.93.99
URL: https://scialert.net/abstract/?doi=ijb.2005.93.99
INTRODUCTION
There is increasing interest in new plant varieties produced through genetic engineering, but often there is little tissue available for DNA analyses. The number of chrysanthemum[1] genetic transformation studies as well as of tobacco are numerous. In the former, transformation is hampered by inconsistent regeneration protocols and a large genome size. In the case of Spathiphyllum, no studies on the DNA or genetic transformation exist. In almost every study of these three genera, without exception, the hexadecyltrimethylammonium bromide (CTAB) method of DNA isolation[2] or a slightly modified version[3] is used.
A good extraction procedure for the isolation of DNA should yield adequate and intact DNA of reasonable purity and also be simple, quick and cheap and if possible, should avoid the use of dangerous chemicals. Many members of the Anthemidaea (in which chrysanthemum lies) contain high levels of polyphenols and polysaccharides[4], which bind firmly to nucleaic acids during DNA isolation and interfere with subsequent reactions; the former is often removed by PVP, the latter by NaCl.
A total of 16 DNA Extraction Methods (EMs), previously used on different plant species, commercial or original (sonication), to extract chrysanthemum, tobacco and Spathiphyllum total genomic DNA, were tested. Their applicability in EcoRI restriction (for Southern analysis), Polymerase Chain Reaction (PCR) amplification and Random Amplified Polymorphic DNA (RAPD) analyses were tested. Moreover variability detected in RAPDs and PCR were related to endopolyploidy in in vitro cultures, detected by flow cytometry.
MATERIALS AND METHODS
DNA extraction and EcoRI digestion: DNA was isolated from in vitro leaves of Dendranthema grandiflorum Shuhou-no-chikara (chrysanthemum), Nicotiana tabacum Samsun NN (tobacco) and Spathiphyllum Merry, strictly following EMs as described by authors (Table 1) or companies (Qiagen DNeasy® (USA), Plant DNAZOL® Reagent (GibcoBRL, USA), Isoplant II® (Wako, Japan). DNA was quantified using a Shimadzu UV-1200 spectrophotometer and purity established from 260: 280 nm ratios.
For the sonication-assisted DNA extraction (SADE), leaf tissue (different mg; Table 1) was ground in liquid nitrogen, then added to 750 μL of [100 mM Tris-HCL (pH 8.5), 0.5 M EDTA, 10% sodium dodecyl sulphate, 5 M NaCl, 100 mg mL-1 Proteinase K 5% β-mercaptoethanol, 1% PVP (K30:K60:K90 = 1:1:1), 5 M potassium acetate (pH 5.2)] in a 2 mL Eppendorf tube, which was then placed in an Iuchi sonicator at constant 60 Hz for 1 h at 55°C. After samples were allowed to cool, 750 μL of [chloroform: isoamyl alcohol (24:1): phenol (1:1)] was added, briefly vortexed then spun at 8,000 rpm for 5 min.
| Table 1: | Comparison of different DNA extraction methods on purity, yield and cost |
 | |
EM = extraction method; SADE = sonication-assisted DNA extraction. *1-4 values as Dendranthema grandiflora cv. Shuhou-no-chikara : Nicotiana tabacum Cv. Samsun ‘NN’ : Spathiphyllum Cv. ‘Merry’; *2 purity (highest = 1.6-1.8) measured by the 260 nm: 280 nm ratio; *4 DNA not restrictable (-), weakly restrictable (+w), restrictable (+) or highly restrictable (++) by EcoRI. Shaded areas = best/highest values for that column. *5 cost (US$) calculated per extraction, based on an average of Sigma-Aldrich and Wako for EMs 1-12, 16; different letters within the column indicate significant differences at p<0.05. | |
Supernatant was added to ice-cold 750 μL isopropanol: 100% ethanol (1:1), placed at -20°C for 30 min. Tubes were then spun at 1,000 rpm for 2 min and the supernatant washed in 200 μL 80% ethanol + 3 M sodium acetate (pH 5.2) for 5 min under gentle shaking. Tubes were then spun at 1,000 rpm for 2 min, air-dried briefly and the DNA pellet resuspended in TE buffer.
In the case of chrysanthemum and tobacco, additional tests were conducted to see the effectiveness of EM in different tissues (leaf, callus and root with root tip).
DNA isolated from all EMs were digested to completion by EcoRI (Takara Shuzo, Japan) following manufacturer’s instructions, in a total of 50 μL.
PCR and RAPD analyses: Reactions for RAPD analysis were set up using the following 10-mer primers (Fasmac, Japan): A-18: 5'-AGGTGACCGT-3', B-10: 5'-CTGCTGGGAC-3' and C-2: 5'-GTGAGGCGTC-3', which were chosen from a comparative analysis of over 500 RAPD studies, inlcuding those of orchids and performed in a Perkin Elmer GeneAmp PCR System 2400 thermocycler. For A-18, 3 cycling reactions were compared: A-18a: 2 cycles of (94°C 1 min, 36°C 7 sec, 72°C 70 sec) then 55 cycles of (94°C 6 sec, 40°C 7 sec, 72°C 70 sec); A-18b: 40 cycles of (94°C 1 min, 37°C 1 min, 72°C 2 min) followed by 72°C 7 min; A-18c: 94°C 5 min, 45 cycles of (94°C 10 sec, 35°C 10 sec, 72°C 70 sec) followed by 72°C 2 min; A-18d: 92°C 4 min, 42 cycles of (92°C 1 min, 35°C 1 min, 72°C 2 min) followed by 72°C 6 min. For B-10, 2 cycling reactions were compared: B-10a: 40 cycles of (94°C 1 min, 37°C 1 min, 72°C 2 min) followed by 72°C 7 min; B-10b: 94°C 10 min, 35 cycles of (94°C 30 sec, 42°C 1 min, 68°C 30 sec) followed by 72°C 10 min. For C-2, 2 cycling reactions were compared: C-2a: 2 cycles of (94°C 1 min, 36°C 7 sec, 72°C 70 sec) then 55 cycles of (94°C 6 sec, 40°C 7 sec, 72°C 70 sec); C-2b: 94°C 4 min, 40 cycles of (94°C 1 min, 36°C 1 min, 72°C 2 min) followed by 72°C 8 min. All cycling conditions included a hot start.
The effect of three different PCR kits (Sigma-Aldrich JumpStart® ReadyMix® REDTaq® DNA Polymerase, In Vitrogen PCR SuperMix High Fidelity and Perkin Elmer GeneAmp® PCR Reagent Kit with AmpliTaq® DNA Polymerase). The in vitrogen reaction contained 66 mM Tris-SO4 (pH 9.1 at 25 °C), 19.8 mM (NH4)2SO4, 2.2 mM MgSO4, 220 μM of each dNTP, 1.1 units of recombinant Taq DNA polymerase. The Perkin Elmer reaction contained 100 mM Tris-HCl (pH 8.3 at 25 °C), 500 mM KCl, 15 mM MgCl2, 0.01% gelatin, 220 μM of each dNTP, 1.25 units of AmpliTaq® DNA polymerase. 50 μL reations were performed for all conditions and contained 20 μM of each primer and 10 μg of target/template DNA. The use or omission of light mineral oil (Sigma-Aldrich) overlay were also tested.
2 direct PCR amplification techniques from leaf tissue[5,6] were also tested.
Five primer sets were used: 5SP3: 5'-GAGAGTAGTACATCGATGGG-3' and 5SP4: 5'-GGAGTTCTGACGGGATCCGG-3' which amplifies a portion of the 5S-rRNA gene clusters[7]; NT107-1: 5'-CCATGGCGAACGAAGAGGTGATT-3' and NT107-2: 5'-TTACTCAAGTCCAAACTTTTGCC-3' which amplifies a portion of the GST stress-inducible gene[8]; LFY3 (5'-CTTTTACTAAAAGCACAACAA-3')[9], trnh (5'-CTACCACTGAGTTAAAAGGG-3')[10], trnK2R (5'-AACTAGTCGGATGGAGTAG-3')[11] which encode for a portion of the homeotic gene, LEAFY intron, the trnD-trnT or the matK-trnK loci of cpDNA, respectively. Amplification conditions for 5SP3/4 were: 1 cycle of (94°C 1 min, 50°C 30 sec, 72°C 3 min: preamplification denaturation) followed by 28 cycles of (94°C 30 sec, 50°C 30 sec, 72°C 3 min: annealing) and 1 cycle of (94°C 30 sec, 50°C 30 sec, 72°C 10 min: extension); for NT107-1/2: 40 cycles of (94°C 1 min, 55°C 1 min, 72°C 1 min) followed by a final extension at 72°C 5 min; for LFY3, trnh and trnK2R: 94°C for 1 min followed by 40 cycles of (94°C 30 sec, 56°C 2 min, 72°C 2 min: annealing) followed by a final extension at 72°C 7 min. In Vitrogen PCR SuperMix High Fidelity was used for all primers. Fifty microliter reations were performed for all reactions and contained 20 μM of each primer and 10 μg of target/template DNA.
A total of 15 μL of PCR products were analysed three times by agarose gel electrophoresis on 1% SeaKem® GTG® agarose (BioWhittaker Molecular Applications, USA)/TAE. Gels were run with 5 μg mL-1 ethidium bromide, DNA was visualized using a standard 320 nm UV transilluminator and photographed using Kodak 667 Polaroid film.
Flow cytometry: Nuclei were isolated from about 0.5 cm2 of the material (root, leaf or callus) by chopping in a few drops of Partec Buffer A (2 μg mL-1 4,6-diamidino-2-phenylindole (DAPI), 2 mM MgCl2, 10 mM Tris, 50 mM sodium citrate, 1% PVP K-30, 0.1% Triton-X, pH 7.5)[12]. Nuclear fluorescence was measured using a Partec® Ploidy Analyser (PA) after filtering the nuclear suspension through 30 μm mesh size nylon filter (CellTrics®) and adding five times of Buffer A for 1 min. Three samples were measured and relative fluorescence intensity of the nuclei was analyzed when the Coefficient of Variation was <4%. A minimum of 2500 nuclei were counted for any sample.
RESULTS AND DISCUSSION
DNA extraction and EcoRI digestion: DNA could be extracted from all three genera, but each EM resulted in differing purity, yield, restrictability with EcoRI and banding patterns, depending on the primer used.
Few EMs resulted in high purity DNA, with even fewer resulting in a simultaneously high DNA yield. Yield was genus-dependent, with individual EMs resulting in sometimes very different yields, in the most radical case, EM 7 yielded 124 times more DNA from tobacco than from chrysanthemum. EM 15 (Isoplant II®) resulted in high purity for chrysanthemum and tobacco, but in high yield and restriction ability by EcoRI in all three genera (Table 1). EM 15 and SADE resulted in consistently high yields, independent of the genus. Purity was defined as a 260:280 nm value of 1.6-1.8, with higher ratios due to RNA contamination and lower ratios due to the presence of protein (or phenol, if used), while yield was considered high if over 1 μg mg-1 leaf tissue.
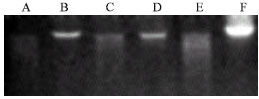 | |
| Fig. 1: | EcoRI digestion of chrysanthemum (A), tobacco (C) and Spathiphyllum (E) DNA after extraction with Qiagen DNeasy® kit. Control, undigested chrysanthemum (B), tobacco (D) and Spathiphyllum (F) DNA. DNA loaded at 1 μg μL-1, 15 μL per well |
Only a single commercial EM, EM 15 had consistently high purity independent of the genus, with only EM 5, 6 and 8 showing high purity for chrysanthemum, tobacco and Spathiphyllum, respectively.
Studies conducted on the effect of sound on DNA and protein synthesis revealed that the quanti- and qualitative change in DNA was minimal, despite heavy sound wave application to chrysanthemum seedlings[13]. In tobacco, numerous studies analyse the effect of stress and various factors on DNA dasmage and subsequent repair mechanisms, but no study analyzes the effect of extraction method on DNA analyses. Moreover, a review of recent literature reveals that even the EM, or details thereof, is surprisingly not mentioned any longer, e.g.[14], while most discussion on DNA refers to transgenic DNA following genetic transformation. An interesting study however investigated the differential DNA production cpacities of plastid- and mitochondrial-nuclei in response to various inhibitors, optimum assay conditions and template preferences, but all with a single EM[15].
Not necessarily all EMs that resulted in successful DNA extraction could result in complete cleavage of DNA by EcoRI. For chrysanthemum, despite only 13 successful EMs, DNA from 14 of the total of 16 EMs could be restricted with EcoRI; in tobacco 11 and 7 in Spathiphyllum (Table 1 and Fig. 1). Five EMs (4, 7, 9, 13 and 15) resulted in genus-independent restriction of DNA by EcoRI. Successful restriction with EcoRI indicates the suitability for Southern blot analyses.
Cost is always an important consideration when conducting DNA analyses of any type. Normally the need for purity, yield and the abundance of initial plant material would be the factors most influencing the choice of EM. Clearly the commercial EMs have a higher unit extraction cost, but this is counter-balanced by higher purity and yields. EMs 5, 6 and 8, which all boast relatively high purity, can be performed at ½-a cost of commercial EMs, while similar reduced costs can be obtained for EMs 1, 3, 4, 6 and SADE (for chrysanthemum), EMs 3 and 7 (for tobacco), or EM 7 (for Spathiphyllum) if a high yield is required.
Total genomic DNA could be extracted using 9 out of the 12 previously published EMs, very different but characteristic profiles depending on the cultivar and on the primer used (Fig. 2 and 3). All 3 commercial EMs produced clear and discernible banding patterns for 5s rRNA and A-18, B-10 and C-2 primers, for chrysanthemum, tobacco and Spathiphyllum, indicating their prime choice in DNA analytical studies. Two EMs 1 and 6 resulted in partial or weak banding for A-18, although clear banding could be obtained for 5S rRNA, for all of the genera (Fig. 3). Two other EMs, EM 9 and EM 11, could not result in any discernible banding patterns and profiles for any of the genera, nor for any of the primers used, indicating their inapropriateness for extraction of DNA.
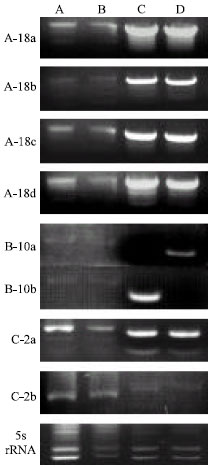 | |
| Fig. 2: | The effect of different parameters on the banding pattern of three 10-mer and a 5s rRNA primers. Sigma-Aldrich JumpStart® ReadyMix® REDTaq® DNA Polymerase without (A) and with mineral oil (B); In Vitrogen PCR SuperMix High Fidelity® without (C) and with mineral oil (D). Tobacco DNA (EM 15-derived) loaded at 1 μg μL-1, 15 μL per well |
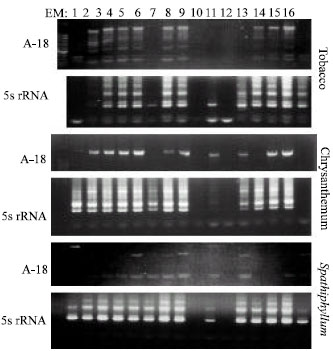 | |
| Fig. 3: | Banding pattern arising from tobacco, chrysanthemum and Spathiphyllum DNA (derived from 16 Extraction Methods (EM) amplification through PCR using primers A-18 and 5s rRNA |
Despite success having been achieved in oil seed rape, sugar beet and wild Brassica-more than tobacco or maize-when using the direct leaf EM of PCR amplification using primers of a conserved gene, 5S rRNA[6], in this study, in none of the orchids tested could direct PCR be successfully achieved using either the direct leaf disk EM[6], or PCR from tissue[5]. Due to the speed and usefulness of such an EM, ongoing trials will continue.
PCR and RAPD analyses: Different cycling programs resulted in different banding patterns for different primers, indicating that caution should be taken when establishing a protocol, since increased banding and clarification of banding patterns could signify an increase in heterogeneity and result in larger genetic distances, significant in population studies. For A-18, B-10 and C-2, Sigma-Aldrich JumpStart® ReadyMix® REDTaq® DNA Polymerase resulted in better and clearer banding patterns than the other two commercial PCR kits (Fig. 2); inversely, for 5S rRNA (and to a certain extent C-2), In Vitrogen PCR SuperMix High Fidelity was shown to be superior to the other two PCR kits (Fig. 2 C/D vs. 2 A/B). In all cases, a mineral oil overlay resulted in more smearing (Fig. 2 A and C vs. B and D) and less intense banding patterns than uncovered reactions, but this may be related to the choice of thermocycler. Moreover, mineral oil results in slightly more impractical loading of samples with the risk of cross-well contamination.
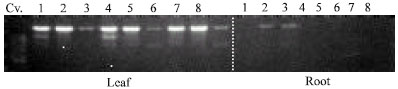 | |
| Fig. 4: | Banding pattern arising when A-18 is used to descriminate between 8 different chrysanthemum cultivars and their respective leaf and root tissues. * Leaf-specific markers which can be developed into SCARs. DNA (EM 15-derived) loaded at 1 μg μL-1, 15 μL per well |
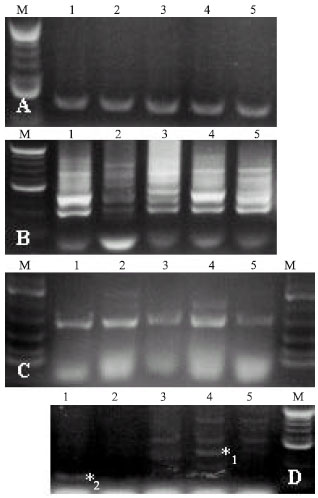 | |
| Fig. 5: | Tobacco RAPD banding from: A) A-18, B) 5s-rRNA, C) trnh and D) LFY3. M = 100 bp marker (In Vitrogen); Lanes: 1 = ex vitro leaf, 2 = ex vitro root, 3 = in vitro leaf, 4 = in vitro stem (high level of 8C and some 16C, i.e. endopolyploidy), 5 = in vitro callus (some 8C cells). *1 Root-specific marker; *2 PLB-specific marker which can be used as a SCAR. DNA (EM 15-derived) loaded at 1 μg μL-1, 15 μL per well |
A-18 could be used to differentiate between 8 chrysanthemum cultivars and was shown to give more banding patterns in leaf tissue than in PLB tissue, indicating the leaf-specific markers shown by A-18 (Fig. 4). This shows the applicability of RAPDs to test somaclonal variability and clonal differences.
The use of RAPD primers confirmed that different treatments result in genetic differences, which may or may not correspond to the same phenotypic differences observed in vitro and ex vitro (Fig. 5). A-18, B-10 and C-2, as well as 5s-rRNA are monomorphic (Fig. 5A and B), with no differences being displayed. But trnh and LFY3 primers, both chloroplast-related genes, result in different banding patterns between in vitro and ex vitro material, indicating possible differences in photosynthetic capacity and machinery (confirmed by photosynthetic results, data not shown).
Flow cytometry: Flow cytometry indicated that cells in callus are cytologically unstable, exhibiting (endo) polyploidy, with 8C (Fig. 6) or even 16C values sometimes occurring (data not shown). Callus contained high levels (=30%, relative %) of 8C cells (endopolyploidy) and between 1-5% 16C cells. In vitro or ex vitro leaves showed no endopolyploidy (i.e. only 2C and 4C cells), even if the origin was from endopolyploid callus.
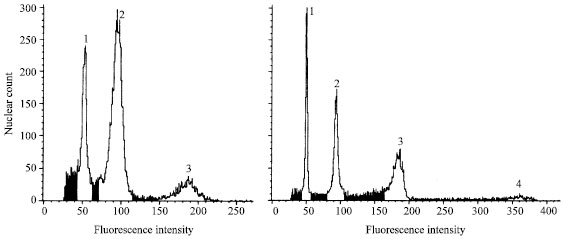 | |
| Fig. 6: | Histograms showing cytological differences in materials and treatments. Peaks: Peak 1 = Internal standard, diploid barley (Hordeum vulgare ‘Ryufu’ leaf), Peak 2 = tobacco in/ex vitro 2C (leaf, callus), Peak 3 = tobacco in/ex vitro 4C (leaf, callus), Peak 4 = tobacco in vitro 8C (callus). CV = 4-5%; minimum cell count = 10,000; flow rate = 12-15,000 cells mL-1 |
Appropriateness of DNA Ems: The usefulness of the CTAB method (EM 1) with an extended isopropanol precipitation step was shown[16] and the addition of PVP for the successful extraction of DNA from latex-containing plants.
DNA can be successfully extracted from chrysanthemum, tobacco and Spathiphyllum leaf, callus or root tissues using a wide range of EMs, most of which are suitable for EcoRI restriction and subsequent Southern analysis. In addition, primers for the conservative 5S rRNA gene, chloroplast trnh and LFY3 genes, as well as three 10-mer primers (A-18, B-10 and C-2) can produce clear and useful RAPD markers for differentiating genera, cultivars, different tissue and the same tissue of different ages. The choice of PCR reaction conditions, polymerase used, thermocycling program and inclusion or exclusion of mineral oil can influence the banding pattern and clarity of bands and subsequent results. These should all be standardized a priori to final banding analyses, such as genetic distances and dendograms.
ACKNOWLEDGMENTS
Thanks to Profs. S. Fukai, T. Takamura and M. Tanaka for valuable technical assistance.
REFERENCES
- Da Silva, J.A.T., 2003. Chrysanthemum: Advances in tissue culture, cryopreservation, postharvest technology, genetics and transgenic biotechnology. Biotechnol. Adv., 21: 715-766.
CrossRefDirect Link - Murray, M.G. and W.F. Thompson, 1980. Rapid isolation of high molecular weight plant DNA. Nucl. Acids Res., 8: 4321-4326.
CrossRefPubMedDirect Link - Doyle, J.J. and J.L. Doyle, 1987. A rapid DNA isolation procedure for small quantities of fresh leaf tissue. Phytochem. Bull., 19: 11-15.
Direct Link - Da Silva, J.A.T., 2003. Thin cell layer technology in ornamental plant micropropagation and biotechnology. Afr. J. Biotechnol., 2: 683-691.
CrossRefDirect Link - Klimyuk, V.I., B.J. Carroll, C.M. Thomas and J.D. Jones, 1993. Alkali treatment for rapid preparation of plant material for reliable PCR analysis. Plant J., 3: 493-494.
CrossRefPubMedDirect Link - Rogers, H.J. and H.C. Parkes, 1999. Direct PCR amplification from leaf discs. Plant Sci., 143: 183-186.
Direct Link - Cox, A.V., M.D. Bennett and T.A. Dyer, 1992. Use of the polymerase chain reaction to detect spacer size heterogeneity in plant 5S-rRNA gene clusters and to locate such clusters in wheat (Triticum aestivum L.). Theor. Applied Genet., 83: 684-690.
CrossRefDirect Link - Lim, J.D., W.H. Kang, C.Y. Yu and I.M. Chung, 2005. Expression of the glutathione S-transferase gene (NT107) in transgenic Dianthus superbus. Plant Cell. Tissue Organ Cult., 80: 277-286.
Direct Link - Oh, S.H. and D. Potter, 2003. Phylogenetic utility of the second intron of LEAFY in Neillia and Stephanandra (Rosaceae) and implications for the origin of Stephanandra. Mol. Phylogen. Evol., 29: 203-215.
Direct Link - Demesure, B., N. Sodzi and R.J. Petit, 1995. A set of universal primers for amplification of polymorphic non-coding regions of mitochondrial and chloroplast DNA in plants. Mol. Ecol., 4: 129-131.
CrossRefDirect Link - Hu, J.M., M. Lavin, M.F. Wojciechowski and M.J. Sanderson, 2000. Phylogenetic systematics of the tribe Millettieae (Leguminosae) based on chloroplast trnK/matK sequences and its implications for evolutionary patterns in Papilionoideae. Am. J. Bot., 87: 418-430.
Direct Link - Mishiba, K.I. and K. Mii, 2000. Polysomaty analysis in diploid and tetraploid Portulaca grandiflora. Plant Sci., 156: 213-219.
Direct Link - Xiujuan, W., W. Bochu, J. Yi, D. Chuanren and A. Sakanishi, 2003. Effect of sound wave on the synthesis of nucleic acid and protein in chrysanthemum. Coll. Surf. B: Biointerfaces, 29: 99-102.
Direct Link - Liu, H.K., C. Yang and Z.M. Wei, 2005. Heat shock-regulated site-specific excision of extraneous DNA in transgenic plants. Plant Sci., 168: 997-1003.
CrossRefDirect Link - Sakai, A., T. Suzuki, N. Nagata, N. Sasaki and Y. Miyazawa et al., 1999. Comparative analysis of DNA synthesis activity in plastid-nuclei and mitochondrial-nuclei simultaneously isolated from cultured tobacco cells. Plant Sci., 140: 9-19.
Direct Link - Michiels, A., W. van den Ende, M. Tucker, L. van Riet and A. van Laere, 2003. Extraction of high-quality genomic DNA from latex-containing plants. Anal. Biochem., 315: 85-89.
CrossRefPubMedDirect Link - Edwards, K., C. Johnstone and C. Thompson, 1991. A simple and rapid method for the preparation of plant genomic DNA for PCR analysis. Nucl. Acids Res., 19: 1349-1349.
Direct Link - Lim, S.H., C.F. Liew, C.N. Lim, Y.H. Lee and C.J. Goh, 1998. A simple and efficient method of DNA isolation from orchid species and hybrids. Biol. Planta, 41: 313-316.
CrossRefDirect Link - Carlson, J.E., L.K. Tulsieram, J.C. Glaubitz, V.W.K. Luk, C. Kauffeldt and R. Rutledge, 1991. Segregation of random amplified DNA markers in F1 progeny of conifers. Theor. Applied Genet., 83: 194-200.
CrossRefDirect Link - Clarke, B.C., L.B. Moran and R. Appels, 1989. DNA analyses in wheat breeding. Genome, 32: 334-339.
CrossRefDirect Link - Junghans, H. and M. Metzlaff, 1990. A simple and rapid method for the preparation of total plant DNA. Biotechniques, 8: 176-176.
PubMedDirect Link - Dellaporta, S.L., J. Wood and J.B. Hicks, 1983. A plant DNA minipreparation: Version II. Plant Mol. Biol. Rep., 1: 19-21.
CrossRefDirect Link - Laird, P.W., A. Zijderveld, K. Linders, M.A. Rudnicki, R. Jaenisch and A. Berns, 1991. Simplified mammalian DNA isolation procedure. Nucl. Acids Res., 19: 4293-4293.
PubMedDirect Link