
Ramkumar Thandiakkal Balan
Department of Mathematics and Statistics, University of Dodoma, Kikuyu Avenue, Dodoma, Tanzania
LiveDNA: 91.41235
ORCID: 0000-0001-5206-5226
Asian Journal of Mathematics & Statistics
Year: 2023 | Volume: 16 | Issue: 1 | Page No.: 9-18


ABSTRACT
Background and Objective: The candidate’s skill and mastery of competencies by the grades highly depend on the school’s performance. No studies were yet found in Tanzania dealing with the 5 significant variables together in a multivariate vector approach even though studies separately considering some of the variables were found. The general objective of the study was to cluster the secondary schools of Simiyu Region of Tanzania according to their performance. Materials and Methods: The study is based on data available from 44 secondary schools selected from the Simiyu Region of Tanzania. As 34 Government schools and 10 private schools were involved and 18/28 urban schools and 26/133 rural schools were considered. The performance of schools was analyzed by applying multivariate tools, descriptive statistics, discriminant function and Mahalanobis distance. The performance of schools considered five variables-Number of students who sat for the examination (Sat), number of students who passed the examination (Pass), Grade Point Average (GPA), regional ranking (RR) and national ranking (NR) of schools. Results: Linear discriminant function 1 is more appropriate to classify the schools as per their performance. Stacked histogram 1 is efficient to perform the disjointing of three groups of schools without duplication or omission. The GPA and RR are the most influencing factors leading to the performance of schools. Most of the private schools were classified as high performing while 2/3rd of government schools were lacking in moderate performance. The number of students enrolled and sitting in the examination affects the rate of performance. Conclusion: The GPA contributes a higher part to the assessment of performance. Among the 44 schools under consideration, 14 were classified as high performing. The authorities and education institutes can adopt strategies to improve GPA and RR to secure high rankings in performance.
PDF Abstract XML References Citation
Copyright: © 2023. This is an open access article distributed under the terms of the creative commons attribution License, which permits unrestricted use, distribution and reproduction in any medium, provided the original author and source are credited.
How to cite this article
Ramkumar Thandiakkal Balan, 2023. Multivariate Analysis of Performance of Secondary Schools in Simiyu Region, Tanzania. Asian Journal of Mathematics & Statistics, 16: 9-18.
DOI: 10.3923/ajms.2023.9.18
URL: https://scialert.net/abstract/?doi=ajms.2023.9.18
DOI: 10.3923/ajms.2023.9.18
URL: https://scialert.net/abstract/?doi=ajms.2023.9.18
INTRODUCTION
The candidate’s skill and mastery of competencies by the grades contribute to attaining the level of performance of a school performance1. By separating achievement and non-cognitive elements, Standards-Based Grading2 gives a clear means to assess school performance. Billett3, Brown and Knight4 studied several evaluation strategies used to assess student performance and school performance in work-integrated learning. These include validity and reliability criterion-referenced assessment (CRA) used for comparative assessment with specific criteria. One of the best predictors of educational performance is GPA5. Researchers generally found that, compared to other admission criteria, the GPA appears to be a better predictor of accomplishment in higher education6. The association between school performance and GPAs is moderate to high. The link between a student’s self-report and their actual GPA was moderately strong. The GPA and teacher effectiveness are both linked to student satisfaction7. Hence, the performance of the school and instructor’s assessments are highly correlated8.
From 2013 to 2015, the Tanzanian Government changed the secondary school grading system from total grading system (TGS) to a Grade Point Average (GPA) in order to include continuous assessment (CA) tests in students’ final national Form IV examination result. However, in 2016, the government changed the grading system from GPA to divisions due to political and other issues9.
Social and education status and educational results were highly associated in most of the schools in the US and continue to influence the educational achievement of institutions10. In the United Kingdom secondary schools have a separate impact on student achievement4. In Australia, many longitudinal studies on students have been conducted and found that the students attending private Non-Catholic schools are performing better than students of State Schools along with independent private school11.
A study conducted in Ethiopia concluded that students in non-government secondary schools outperformed students in government secondary schools. The environmental factors including school distances, family, social and economic status, lack of modern information and technology facilities, poor learning and teaching infrastructures, the poor professional status of facilitators and adequacy of teaching and learning materials contribute to the effect of academic performance of students in secondary schools. Furthermore, students from moderate socio-economic and educational backgrounds did better than those from higher socio-economic and educational backgrounds12. Eamon13 and Leonard14 studied on SE status of students and concluded that those students who came out from low socio-economic status showed low performance in studies and obtained low scores compared to those from well-off families and hence leading to poor performance in their schools.
Now-a-days, the government of Tanzania is collaborating with non-governmental institutions also to provide secondary education to all citizens to improve the quality of life. Education is offered free of cost up to Form VI and girls are encouraged to complete secondary education in the neighboring or even distant place of study from home. But overall performance of some rural and interior schools was dismal and their ranking in RR and NR are very poor. The GPA achieved by many students in some areas were low affecting the performance of schools. Laddunuri15 concluded that students in Tanzania pass at a low percentage leading to low school performance due to a lack of skilled teachers, poor infrastructural facilities in schools and insufficient books in the school library, as well as the economic circumstances and frequent changes in the curriculum. Teachers’ lack of interest, practice, desire and enthusiasm, as well as students’ view and attitude toward the topic and a paucity of trained subject teachers, all contribute to secondary school failure in Tanzania. Moreover, according to a study conducted in Dodoma Municipal, boys in both private and government schools performed better than girls in the schools with the presence of laboratories, teachers and classrooms. According to Cilliers et al.16, big results now (BRN) in education in Tanzania, the ranking effectiveness of learning and teaching was verified as well as the drawback of the system was analyzed. The effect of the size of students registered at Form IV and Form VI in the schools of Tanzania was well studied and found a correlation in the performance of schools. In a working paper by Research on Improving System of Education (RISE) the pass rate at the secondary level is different with different types of management of the school in Tanzania.
Letter grades, percentages and the 4.0 scale have typically been utilized in school grading and reporting systems because they are known and widely used by most educational institutions17. A grading system that provides a lot of information must be fair, precise, specific and speedy18 since fair does not mean equality rather than consistency, it's about equality of opportunity which classifies schools’ performance in different levels.
The link between a student’s self-report and their actual GPA was moderately strong. The reciprocity effect can be used to explain student grades and teacher evaluations19. Furthermore, academic self-efficacy and school academic motivation are also the best predictors of GPA.
Most of the studies on performance of schools or students in Tanzania are done with univariate data. One of the variables GPA, Pass or Sat was only considered to analyzed the performance of the schools. But it is insufficient to assess overall academic performance of a school as these variables are highly correlated. Multivariate data consider variables which are correlated between the variables and within the variables. Also multivariate analysis deals with variance covariance matrix which is describing possible dispersion among considered variables20. Along with them the position of schools in region and total is essential to evaluate the performance of schools as a whole. The use of multivariate data is important since any worthwhile treatment will have various effects on subjects and the researcher can work with a maximum amount of information for the study21,22.
This study is an eye-opener to parents, school management and education departments, how to achieve higher performance of schools and finally benefit students by improving the five variables considered and among them which will be given higher priority.
MATERIALS AND METHODS
Study area: The study area was the secondary schools in Simiyu Region with respect to the Form IV examination results of the year 2020.
A sample of 44 secondary schools was selected of which 34 government secondary schools and 10 private secondary schools were involved. 18 out of 28 urban secondary schools and 26 out of 133 rural secondary schools were selected in the sample.
Statistical analysis
Variance-covariance matrix: The matrix containing population variance -covariance exhibits the variation within and between variables in the variables of population characteristics.
Let D(X) represent the variance-covariance matrix, then:
Σ = D(X) = E[(y-μ) y'] = E(yy'-μμ') | (1) |
The covariance is the measure of the linear relation between two variables. The eigenvalue or characteristic root indicates the ratio of the sum of squares between groups to the sum of squares within groups. A good model should have hold a higher eigenvalue maximizing the likelihood function. In discriminant analysis the variable with high eigenvalue indicates that it contributed much to the discrimination of the groups.
Discriminant analysis: Johnson and Wichern23, defines discriminant analysis as a multivariate statistical approach for differentiating various sets of objects (observations) and assigning new objects to previously specified groups. The hypothesis that the group means of all the independent variables for two or more groups are equal is tested using discriminant analysis. A comparison of group centroids evaluates the separation between groups due to discriminant function.
The discriminant function is constructed using the unstandardized coefficients, which are then used to compute the discriminant score24.
Discriminant analysis as a multivariate statistical approach to differentiate a set of objects (observations) and assign new objects to specified groups already defined. Discriminant functions are linear combinations of factors that maximize the distance between mean vectors to best segregate groups. In discriminant analysis and classification analysis the three performance groups were formed by the researcher using the GPA. These are high group with GPA (1.0-2.5), moderate group with GPA (2.6-3.5) and low group with GPA (3.6-5.0). For discriminant function analysis, group membership must be mutually exclusive in which an observation does not belong to more than one group. The coefficients of discriminant functions are used to maximize group differences.
Zqr = ∂+∝1 X1r+∝2 X2r+⋯∝n Xnr | (2) |
where, Zqr is the discriminant function, q is the score for object r, ∂ is the intercept, Xnr is the nth independent variable of the object r, and ∝n is the discriminant coefficient for independent variable Xnr. Discriminant function separates the group and group centroid is a method to distinguish the groups25. Based on the distance score of group observations from group centroid different clusters were formed. Observing the overlapping the similarity and dissimilarity of groups were identified. Comparison of group centroids evaluates the separation between groups due to discriminant function. It also forecasts, to which group a given observation would belong to, based on the distance between the observation’s discriminant score and the group centroid. A little overlap means the discriminant function can effectively separate the groups, whereas a high overlap means the groups can’t be adequately separated.
Discriminant function: On school performance:
Performance = β1 Sat+β2 Pass+β3 GPA+β4 RR+β5 NR | (3) |
where, the performance was classified into three categories: Low, moderate, high, so two functions.
On school size:
School size = β1 Sat+β2 Pass+β3 GPA+β4 RR+β5 NR | (4) |
where, school size was classified into three categories-with candidates <50, between 50 to 100 and >100, so two functions.
On ownership of school:
School ownership = β1 Sat+β2 Pass+β3 GPA+β4 RR+β5 NR | (5) |
where, school was owned by government or private institution so only one function.
Linear discriminant analysis (LDA): Mahalanobis distance (MD) is used to scale each variable’s contribution to the distance value in accordance with its level of variability. Additionally, it considers the correlations between strongly linked variables. The MD is:
 | (6) |
A linear boundary such as linear discriminant analysis, (called Fisher’s Discriminant Analysis) is based on Mahalanobis distance (MD) in which all classes are assured to have single variance-covariance matrices26. The MD is a multivariate data metric that is based on the centroid, a base or central point that can be thought of as an overall mean. Bigger the MD, farther the data point from the centroid27.
The LDA is calculated using the Mahalanobis’ distance:
 | (7) |
where Cp is the pooled covariance matrix for the two classes (groups32):
 | (8) |
where, Ck (C1 and C2) is the corresponding variance-covariance matrix for that class.
Significance of statistical analysis: The results were established using Statistical analysis-Discriminant Analysis comprised by LD function, stacked histogram, variance covariance matrix and discriminant function plot. All statistical tests in the study was conducted at 5% level of significance.
RESULTS
Group statistics: Discriminant analysis was followed only by testing for equivalence of means and standard deviations from pooled mean and pooled standard deviation of the groups and they should be significantly different, otherwise discrimination of the groups is impossible. From Table 1, the means and standard deviations were significantly different for three groups from pooled means with a p-value equal to 0.043 indicating that discrimination of the group was possible.
Discriminant function
Eigenvalues: To determine the most discriminant function, the eigenvalue of it should be of highest value.
The eigenvalue for function 1 was 9.671 and 1.143 for function 2 and hence, function 1 was the best as shown in Table 2. The multiple correlations (canonical correlations) between the predictors and the discriminant function were 0.952 (95.20%) for function 1 and 0.730 for function 2 showing the high relationship between the variables and the independent variable. The higher discriminating power of the generated function is shown by a lower Wilks’ lambda value and a smaller p-value (<0.05) as shown in Table 2.
Standardized and unstandardized discriminant function coefficient: The stability of discriminant function was detected using standardized and unstandardized coefficients and given in Table 3.
The RR has the highest coefficient of 10.942 and -11.894 for function1 and 2, respectively, implies that the regional ranking was the highest discriminating variable that discriminate the schools into their performance groups as shown in Table 3. The positive coefficient of Pass, GPA and RR ensures the increase of performance for the first function as a good discriminant function and its power of discrimination is 87.95%, while for the second function, it is only 12.05%:
LD1 = -0.165Sat+0.183Pass+1.892GPA+10.942RR-3.416NR LD2 = 0.123Sat-0.128Pass+3.309GPA-11.894RR+4.159NR |
The power of discriminant function is determined by the standardized coefficients in which the constants are eliminated to reduce the scale effects and size effects.
| Table 1: | Group Statistics | |||||||
| Means for groups | Standard deviations for groups | |||||||
| Pooled | Pooled | |||||||
| Mean | Low | Moderate | High | Standard Deviation | Low | Moderate | High | |
| Sat | 50.3 | 83.85 | 87.214 | 50.30 | 38.81 | 37.44 | 45.57 | 30.02 |
| Pass | 72.068 | 74.60 | 84.000 | 50.30 | 36.15 | 33.31 | 43.31 | 30.02 |
| GPA | 3.3512 | 3.832 | 3.3628 | 2.373 | 0.2309 | 0.147 | 0.1769 | 0.390 |
| RR | 0.40929 | 0.708 | 0.24105 | 0.047 | 0.1329 | 0.159 | 0.1352 | 0.032 |
| NR | 0.27908 | 0.432 | 0.21413 | 0.064 | 0.1382 | 0.195 | 0.0616 | 0.035 |
| Table 2: | Eigenvalues and Wilk’s Lambda | ||||||
| Function | Eigenvalue | Variance (%) | Canonical correlation | Wilks’ Lambda | Chi-square | Degrees of freedom | Significant |
| 1 | 9.671 | 89.4 | 0.952 | 0.044 | 122.061 | 10 | 0.000 |
| 2 | 1.143 | 10.6 | 0.73 | 0.467 | 29.727 | 4 | 0.000 |
| Table 3: | Standardized and unstandardized discriminant function coefficients |
| Standardized function | Unstandardized function | |||
| Variable | 1 | 2 | 1 | 2 |
| 1Sat | -0.165 | 0.123 | -0.048 | -1.033 |
| 2Pass | 0.183 | -0.128 | 0.061 | 0.033 |
| 3GPA | 1.892 | 3.309 | 2.788 | 3.925 |
| 4RR | 10.942 | -11.894 | 7.92 | -9.198 |
| 5NR | -3.416 | 4.159 | -4.334 | 2.899 |
| Constants | -12.086 | -10.156 | ||
| Proportion of trace | 0.8795 | 0.1205 | ||
| 1Sat: Number of students sat for examination, 2Pass: Number of students passed the examination, 3GPA: Grade point average, 4RR: Regional ranking and 5NR: National ranking | ||||
| Table 4: | Structure Matrix |
| Function | ||
| Variable | 1 | 2 |
| 1GPA | 0.805 | 0.447 |
| 2RR | 0.686 | -0.499 |
| 3NR | 0.359 | -0.132 |
| 4Pass | 0.073 | 0.259 |
| 5Sat | 0.100 | 0.223 |
| 1GPA: Grade point average, 2RR: Regional ranking, 3NR: National ranking, 4Pass: Number of students passed the examination and 5Sat: Number of students sat for examination | ||
Structure matrix: The standardized discriminant coefficient of the discriminant function does not tell us which variable is the most influencing variable on discrimination, rather than the structure matrix does. The canonical discriminant functions and significant discriminating variables of pooled within-group correlations were shown by the structure matrix on Table 4. It is clearly seen that GPA and RR are mostly closely associated with both functions 1 and 2.
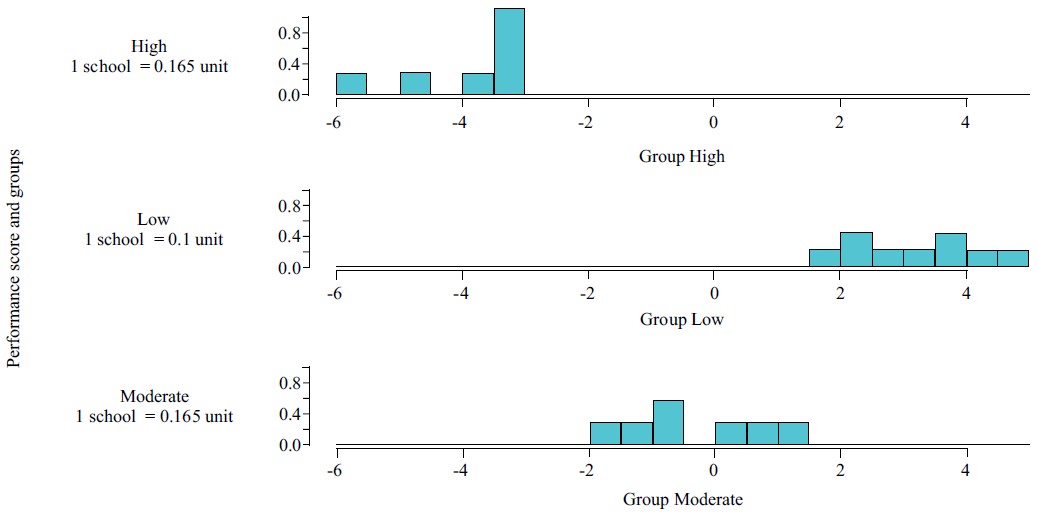
Stacked histograms of the discriminant functions: The stacked histogram is a graphical measure of the discriminant function to separate the groups with a linear combination of the independent variables. There are many as the number of the discriminant functions available for discrimination.
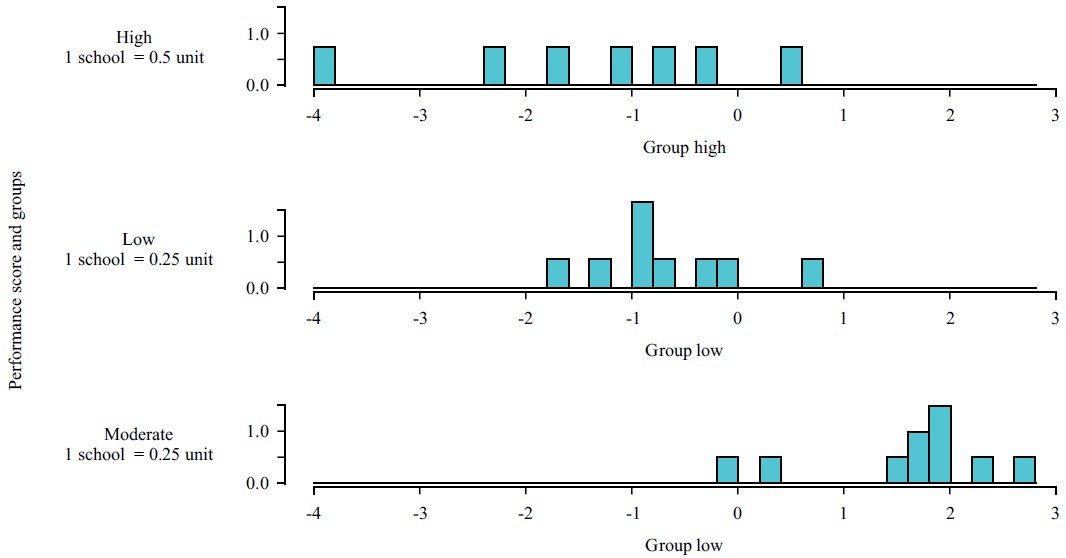
Stacked histogram of discriminant function 1: The group separation can be observed directly through the stacked histogram of the discriminant functions. In the stacked histogram, high, moderate and low groups were well separated by the first discriminant function. For the high, values vary from -6 to -3, for moderate the values were between -2 and 1.5 and for low it was 1.5 to 6. These are distinguishable maximum expanded values between (-6, 6) so that the stacked histogram for discriminant function 1 is ideal to discriminate the performance groups-high, moderate and low. Due to this separation of groups, the discriminant function predicts group membership of the schools by increasing the group distance among them. There are 12 schools of high performance, 18 schools of low performance and 14 schools of moderate performance in Fig. 1. Also the split of schools in three disjoint intervals show the frequencies were mutually exclusive so that the discriminant function 1 accurately discriminate the performance of schools Fig. 1.
Stacked histogram of discriminant function 2: The classifications on linear discriminant function 2 over the performance is not accurate as there are many overlapping in the three groups as shown in Fig. 2.
 |
| Fig. 1: | Stacked histogram for LD1 |
 |
| Fig. 2: | Stacked histogram for LD2 |
Number of schools vs performance: The classification on linear discriminant function 2 over the performance is not accurate, as there are many overlapping in the three groups as shown in Fig. 1. As per split of disjoint performance group, Fig. 1 showed that there are only 7 schools in high performance group (1 school = 0.33 unit) 17 schools in low performance group (1 school = 0.25 unit) and 20 schools in moderate performing group (1 school = 0.25 unit). But this classification is not perfect as there are colluding frequencies in all the three performance groups.
Discriminant function plot: A discriminant function plot represents the discriminant functions as they discriminate the data point into their groups with regard to centroids Fig. 3 showed canonical discriminant functions of the groups with their group centroids. Function 1 discriminate mostly the groups of performance of high, moderate and low combined. High performance data fall around the centroid mean of group 1, moderate group data fall around the centroid mean of group 2 and low performance group data fall around group mean 3.
 |
| Fig. 3: | Canonical discriminant function Plot |
| Table 5: | Posterior probability of group prediction |
Predicted group membership | ||||||
| Group | Observation/school category | Low | Moderate | High | Total | Accuracy of prediction (%) |
| School ownership | Government school | 26 | 5 | 3 | 34 | 95.5 |
| Private school | 1 | 1 | 8 | 10 | 92.8 | |
| School size | School with students less than 50 | 0 | 3 | 11 | 14 | 97.3 |
| School with students greater than 50 and less than 100 | 10 | 3 | 1 | 14 | 96.7 | |
| School with students greater than 100 | 12 | 3 | 1 | 16 | 92.7 | |
Function 2 has a slight trend of discrimination between high and low and it discriminates only moderate. This indicated that function 1 has high power of discrimination compared to function 2.
Posterior probability: The discriminant function uses the posterior probability for predicting the observation into required group of membership. In making prediction the discriminant function considers the posterior probability with the highest value. Table 5 provides the posterior probability for prediction of the group membership. In Table 5, out of 34 government schools, 26 schools were predicted in low performance group with an accuracy of 95.5% and 8 out of 10 private secondary schools were predicted in the high performance group with 92.8% of accuracy. Moreover, 11 out of 14 secondary schools with students less than 50 were predicted in high performance group and 22 out of 30 secondary schools with students greater than 50 were accurately predicted in low group of performance. Hence, in Table 5 every observation was predicted into its group of origin.
DISCUSSION
The multivariate descriptive statistics is an ample evidencing of significance of the variables. Coefficient of variation is minimum in GPA (6.2%) and then in RR (30.1%) indicating the significance of the measures used for performance evaluation. The SDs are high in high performing group (comparing CV) in all variables indicating that the performance of high group is much differing from school to school. In many studies percentage performance of schools was found in Tanzania but the accuracy of prediction is not realized. Also studies were mainly on GPA and number of students sitting for examination is neutralized on percentages.
It is only a study on basic descriptive statistics and no innovative models on performance is developed. Cliffordson et al.6 in their studies considered GPA with students sat for examination or passed in the examination. So correlation on GPA with these variable is additionally gained and GPAs significance explained in their study is undue as no covariance analysis is done in detail. Thus multivariate study with discriminant analysis and clustering of schools according to performance using Mahalanobis distance is scientifically more accurate and applicable in a wide spectrum.
Schools’ performance are provided with regard to students grades by Guskey27 and O’Connor28 and grades upgrade students by O’Connor29 and classify student into different classes by Vatterott30, gives way forward into Universities or Colleges, according to Reeves31 and gives a room for student sponsorships. Lowering or rising grades can be used to manage a student’s conduct, also because of the lower grade, the school performance can be low as well described by Carifio and Carey32, however, high grade leads to high school performance. Here this study also upholds the significance of grades on school performance with the highest significant variable among the 5 variable considered. Structure matrix absolutely studying the significance of variable in the vector upholds a highest coefficient 0.805 in LD1 and 0.447 in LD2 exhibiting the importance of GPA and reliability of the study.
Guskey and Bailey33 and Simon et al.34 recommend that, grading systems based on standard-based grading (SBG) differ in terms of relevance. By separating achievement and non-cognitive elements, SBG equivalently GPA gives a clear means to assess school performance described by Gatta et al.2. In this study a school which does not meet the minimum requirements of GPA 3.5 and above is considered to have had a low academic performance. But it was also found that GPA at secondary final examination is not correlating high with GPA scored in higher studies and over all GPA is lower in private schools even though the pass rate is high in Tanzania government studies.
Laska and Juarez35 in their study contend that the use of pass/fail basis of performance evaluation achieved an increase of 11.4% above the mean of semester GPA. Merva36 assert that a grading system is more informative compared to the pass or fail reporting technique. Furthermore, when students’ work is judged in percentages or letter grades rather than the pass/fail system, they become more motivated. So both grading effect and percentage pass and volume of students were accounted in this study and it was verified the contribution of such variables in performance analysis. This give the significance of using two variables Sat and Pass to identify the performance. The significant coefficients shown in LD1 and LD2 for Sat and Pass again justifies the study. Also in structure matrix this two variables contribute positive values.
There are two significant values greater than one but the first hold 90% variation information with very high canonical correlation indicating the sufficiency of the first discriminant function. The GPA is weighted with 1.892 and RR is multiplied by 10.942 ensures the relative significance of the considered variable in the performance analysis. As 0.8795 trace of performance is achieved by the variables with respective coefficients. The exact significance of each variable in multivariable vector is identified by structure matrix, there GPA and RR is far ahead of other variable. Finally stacked histogram with non-overlapping frequencies in the divided disjoint groups of low medium and high performing categories for discriminant function 1 with posterior probability greater than 0.9.
The study findings agreed with Jimenez et al.37, Jimenez et al.38 and Psacharopoulos39, who concluded that schools in the private sector are often more efficient in performance than those in the public sector, at both the primary and secondary levels. The findings of this study shows that urban secondary schools (including private schools) perform better compared to rural secondary schools, this concurs with the study of Kantabutra and Tang40, who concluded that in terms of school accessibility and performance, urban schools outperform rural schools. Furthermore, the findings disagree with most of literatures, that if all the necessary requirements for learning are available the performance of the schools in rural and urban government schools is the same.
In discriminant analysis the group means determine the level of group in performance since the mean is the pooled mean for the entirely group. From Table 4, 22 groups mean for Sat in government schools was 85.2727 and for pass was 78.7727 less than Sat average. For private schools Sat average and pass average were the same 33.400. The GPA for government was 3.6342 and GPA for private schools was 2.3178 showing that the performance in government schools was lower compared to private schools. The RR for government schools was 48% in position and for private schools was 95.36% in regional position showing that most of private schools occupied higher position region wise. Moreover, NR for government schools was 63.41% while for private schools was 93.61% showing that private schools were higher in position national wise compared to government schools.
CONCLUSION
This paper described the analysis of multivariate data on school performance with the use of discriminant analysis. Under this study schools were classified into three groups of performance, high, moderate and low and each school is assigned to one of the categories with probability theory. More than 90% of accuracy on detecting the schools into their performance level is realized by the study. As 26/34 schools of government sector are low performing while 8/10 of private schools were high performing. As 10/14 and 12/16 schools having more than 50 students enrolled are performing low. This study is an eye opener to authorities and government on improving the government school performance and introducing more secondary schools to reduce size of the student enrollment for Form IV.
SIGNIFICANCE STATEMENT
This is a pioneer study in Tanzania on the performance of schools considering multiple variables taken together. So far many studies were found using univariate tools which is inadequate as some of the variables are correlated. Also, school performance is a conclusion of many factors and many studies were conducted mainly on GPA. So this study incorporates 5 important factors like the volume of students, their success rates, GPA, etc., simultaneously. The schools were classified into three Low, medium and high performance and each school is identified into one of the categories. The outcomes of the study are very important to improve the status of many schools by changing their course of treatment on such factors.
REFERENCES
- Aspelmeier, J.E., M.M. Love, L.A. McGill, A.N. Elliott and T.W. Pierce, 2012. Self-esteem, locus of control, college adjustment and GPA among first-and continuing-generation students: A moderator model of generational status. Res. Higher Educ., 53: 755-781.
CrossRefDirect Link - Olsen, B. and R. Buchanan, 2019. An investigation of teachers encouraged to reform grading practices in secondary schools. Am. Educ. Res. J., 56: 2004-2039.
CrossRefDirect Link - Billett, S., 2008. Emerging Perspectives on Workplace Learning. In: Emerging Perspectives on Workplace Learning, Billett, S., C. Harteis and A. Eteläpelto (Eds.), Brill, Leiden, Netherlands, ISBN: 978-90-8790-645-0, pp: 1-15.
CrossRefDirect Link - Brown, S. and P. Knight, 1994. Assessing Learners in Higher Education. 1st Edn., Routledge, London, ISBN: 9780203062036, Pages: 164.
CrossRefDirect Link - Peters, M., B. Kethley and K. Bullington, 2002. The relationship between homework and performance in an introductory operations management course. J. Educ. Bus., 77: 340-344.
CrossRefDirect Link - Cliffordson, C., 2008. Differential prediction of study success across academic programs in the Swedish context: The validity of grades and tests as selection instruments for higher education. Educ. Assess., 13: 56-75.
CrossRefDirect Link - Grayson, J.P., 2004. The relationship between grades and academic program satisfaction over four years of study. Can. J. Higher Educ., 34: 1-34.
CrossRefDirect Link - Tang, T.L.P., 1997. Teaching evaluation at a public institution of higher education: Factors related to the overall teaching effectiveness. Public Personnel Manage., 26: 379-389.
CrossRefDirect Link - Lillian, N.G. and L. Josephat, 2018. Towards O-level students’ performance in mathematics: Do teaching and learning environment factors matter? J. Educ. Prac., 2: 1-18.
CrossRefDirect Link - Cox, K.B., 2011. Putting classroom grading on the table: A reform in progress. Am. Secondary Educ., 40: 67-87.
Direct Link - Portes, A. and D. MacLeod, 1996. Educational progress of children of immigrants: The roles of class, ethnicity, and school context. Sociol. Educ., 69: 255-275.
CrossRefDirect Link - Eamon, M.K., 2005. Social-demographic, school, neighborhood and parenting influences on the academic achievement of Latino young adolescents. J. Youth Adolescenc, 34: 163-175.
CrossRefDirect Link - Leonard, J., 2013. Maximizing college readiness for all through parental support. School Commun. J., 23: 183-202.
Direct Link - Laddunuri, M.M., 2012. Status of school education in present Tanzania and emerging issues. Int. J. Educ. Res. Technol., 3: 15-20.
Direct Link - Cilliers, J., I.M. Mbiti and A. Zeitlin, 2021. Can public rankings improve school performance? Evidence from a nationwide reform in Tanzania. J. Hum. Resour., 56: 655-685.
CrossRefDirect Link - O’Connor, K., L.A. Jung and D. Reeves, 2018. Gearing up for FAST grading and reporting. Phi Delta Kappan, 99: 67-71.
CrossRefDirect Link - Clayson, D.E., T.F. Frost and M.J. Sheffet, 2006. Grades and the student evaluation of instruction: A test of the reciprocity effect. Acad. Manage. Learn. Educ., 5: 52-65.
CrossRefDirect Link - Keselman, H.J., C.J. Huberty, L.M. Lix, S. Olejnik and R.A. Cribbie et al., 1998. Statistical practices of educational researchers: An analysis of their ANOVA, MANOVA, and ANCOVA analyses. Rev. Educ. Res., 68: 350-386.
CrossRefDirect Link - Stevenson, J., 1993. Multivariate statistics VI. The place of discriminant function analysis in psychiatric research. Nord. J. Psychiatry, 47: 109-122.
CrossRefDirect Link - Stevens, J.P., 2012. Applied Multivariate Statistics for the Social Sciences. 5th Edn., Routledge, England, UK, ISBN: 9781136910692, Pages: 664.
Direct Link - Johnson, R.A. and D.W. Wichern, 2002. Applied Multivariate Statistical Analysis. 5th Edn., Prentice Hall, Hoboken, New Jersey, ISBN: 9780130925534, Pages: 767.
Direct Link - Huberty, C.J. and S. Olejnik, 2006. Applied MANOVA and Discriminant Analysis. 2nd Edn., John Wiley & Sons, Hoboken, New Jersey, ISBN: 9780471789468, Pages: 528.
Direct Link - Verma, J.P., 2013. Application of Discriminant Analysis: For Developing a Classification Model. In: Data Analysis in Management with SPSS Software, Verma, J.P. (Ed.), Springer, India, ISBN: 978-81-322-0785-6, pp: 389-412.
CrossRefDirect Link - Dixon, S.J. and R.G. Brereton, 2009. Comparison of performance of five common classifiers represented as boundary methods: Euclidean distance to centroids, linear discriminant analysis, quadratic discriminant analysis, learning vector quantization and support vector machines, as dependent on data structure. Chemom. Intell. Lab. Syst., 95: 1-17.
CrossRefDirect Link - Guskey, T.R., 2015. On Your Mark: Challenging the Conventions of Grading and Reporting. 3rd Edn., Solution Tree Press, Bloomington, Indiana, ISBN: 9781935542773, Pages: 134.
Direct Link - O'Connor, K., 2011. A Repair Kit for Grading: 15 Fixes for Broken Grades. 2nd Edn., Pearson, New York, ISBN: 9780132488631, Pages: 162.
Direct Link - O'Connor, K., 2009. How to Grade for Learning, K-12. Corwin Press, Thousand Oaks, California, ISBN: 9781412953825, Pages: 296.
Direct Link - Vatterott, C., 2015. Rethinking Grading: Meaningful Assessment for Standards-Based Learning. ASCD, United States, ISBN: 9781416620525, Pages: 130.
Direct Link - Reeves, D., 2011. Elements of Grading: A Guide to Effective Practice. Solution Tree Press, Bloomington, Indiana, ISBN: 9781935543503, Pages: 210.
Direct Link - Carifio, J. and T. Carey, 2009. A critical examination of current minimum grading policy recommendations. High School J., 93: 23-37.
CrossRefDirect Link - Guskey, T.R. and J.M. Bailey, 2001. Developing Grading and Reporting Systems for Student Learning. Corwin Press, Thousand Oaks, California, ISBN: 9780803968547, Pages: 216.
Direct Link - Simon, M., R.D. Tierney, R. Forgette-Giroux, J. Charland, B. Noonan and R. Duncan, 2010. A secondary school teacher’s description of the process of determining report card grades. McGill J. Educ., 45: 535-554.
CrossRefDirect Link - Laska, J.A. and T. Juarez, 1992. Grading and Marking in American Schools: Two Centuries of Debate. Charles C. Thomas, Springfield, United States, ISBN: 9780398058067, Pages: 151.
Direct Link - Merva, M., 2003. Grades as incentives: A quantitative assessment with implications for study abroad programs. J. Stud. Int. Educ., 7: 149-156.
CrossRefDirect Link - Jimenez, E., M.E. Lockheed, E. Luna and V. Paqueo, 1991. School effects and costs for private and public schools in the Dominican Republic. Int. J. Educ. Res., 15: 393-410.
CrossRefDirect Link - Jimenez, E., M.E. Lockheed and V. Paqueo, 1991. The relative efficiency of private and public schools in developing countries. World Bank Res. Obs., 6: 205-218.
CrossRefDirect Link - Psacharopoulos, G., 1987. Public versus private schools in developing countries: Evidence from Colombia and Tanzania. Int. J. Educ. Dev., 7: 59-67.
CrossRefDirect Link - Kantabutra, S. and J.C.S. Tang, 2006. Urban-rural and size effects on school efficiency: The case of Northern Thailand. Leadership Policy Sch., 5: 355-377.
CrossRefDirect Link