
M. Ghorbani
Department of Agricultural Economics Ferdowsi University of Mashhad, P.O. Box 91775-1163, Mashhad, Iran
H. Zare Mirakabad
Department of Biotechnology, Agricultural College, Ferdowsi University of Mashhad, P.O. Box 91775-1163, Mashhad, Iran
Trends in Agricultural Economics
Year: 2010 | Volume: 3 | Issue: 1 | Page No.: 19-27


ABSTRACT
This research carried out to study of factors influencing on trout production in Khorasan Razavi Province using a cross sectional data of 105 trout producers and estimation of trout production function in 2008. Results showed that farms' area, number of fry, feed, fish farming period and water flow have positive effect on trout production and water temperature and fish losses have negative effect on it. Farms area, water temperature degree, number of fry, feed, fish farming period, water flow, water source, labor and fish losses elasticities are 0.282, -1.428, 0.216, 0.422, 1.641, 0.430, -9.19x10⁻⁴, -1.407 and -0.157, respectively. The highest positive effect is due to fish farming period that shows trout producers harvest earlier of economic harvesting time and supply to market. The highest negative effect is due to water temperature that shows it is high. Use of farms' area, number of fry, water flow and feed are at stage 2. Water temperature and fish losses are at stage 3. Effect of Farms area, water temperature degree, number of fry, feed, fish farming period, water flow, water source, labor and fish losses on fish production are 15.46, -78.30, 11.85, 23.14, 89.99, 23.58, -5x10⁻², -77.15 and -8.60 kg, respectively. Fish cost price is 23518.16 rial kg-1 that sale 30000 rial kg-1 at market. Cost, revenue and gross revenue of trout estimated 49.13, 62.67, 13.54 rial/day/fish, respectively. Gross margin (income) is 6481.84 rial kg-1. Regard to results, fish feed management, supplying of farms water from river and spring, try to decrease of water temperature to 15-16°C, fish harvesting in income maximization time and farm environmental management suggested.
PDF Abstract XML References Citation
How to cite this article
M. Ghorbani and H. Zare Mirakabad, 2010. Factors Influencing on Trout Production in Khorasan Razavi Province. Trends in Agricultural Economics, 3: 19-27.
DOI: 10.3923/tae.2010.19.27
URL: https://scialert.net/abstract/?doi=tae.2010.19.27
DOI: 10.3923/tae.2010.19.27
URL: https://scialert.net/abstract/?doi=tae.2010.19.27
INTRODUCTION
Fish is an important source of supplying the animal protein that plays a major role in feed basket of households. It is a good replacement for supplying of feed and protein needs in conditions that other sources of animal protein have high price. Regard to this, cold and warm water fishes farming beside of sea fishing in internal fresh water as a new industry form to optimum use of internal being resources and respond to increasing demand of protein resources. Rather, it acts as an important source of income and employment in rural regions. Now, about 67% of world aquatics supply through fishing of seas and oceans (salty water). Because of boundless fishing in last years, growth of it stopped or declined (Jihad Agriculture Organization of Khorasan Razavi Province, 2008). This problem is a reason of investment justification of fish production in fresh water. Regard to role of fish for supplying of individual needs, must increase demand of it through a dynamic programming in consumption of fish. Although, aquatics per capita consumption increased from 5 kg in 2001 to 7.7 kg in 2006 in Khorasan Razavi Province because of high price of other protein sources and advertising but fish per capita consumption is low. One reason of this problem is unaware to high nutritious value of fish and necessity of it in households' feed basket. Rather, habit to consumption of red meat and chicken influence on time outcomes. Then, necessity dictates that consider marketing, increasing of demand and awareness of households to fish consumption.
Trout is one of cold water fishes that can produce in internal water with well, ghanat (subterranean), river water sources of Khorasan Razavi Province. This fish is one of the best farmed fishes that have good demand in this Province. Although, Khorasan Razavi Province has water constraint, but this province with 27 farm of cold water fishes farming is one of the most region of trout production that supply the local fish demand and demand of other Provinces (Jihad Agriculture Organization of Khorasan Razavi Province, 2008). Fish farming industry is one of the major sources of regional income. Although, the share of this industry is low in national and local economy but its' effects on supplying of protein sources and feed security in local and national economy is high. Although, the share of agricultural and fishery sectors of Khorasan Razavi Province from total value added of these sector in Iran were 6.41% in 2005 but fishery share is very low. Total value added of these sectors has reported 10900 billion rials and share of these sectors of total gross domestic product based on market price presented 11.91%.
The study of Khoshakhlagh and Kiani (1999) on trout farmers in Chahar Mahal and Bakhtiari Province showed that elasticity of feed inputs and fish child are 0.7 and 0.18, respectively. Therefore, these inputs use in stage 2. Also, elasticity of temperature, water flow, drug and labor estimated -2.85, -1.034, -0.02 and -0.19, respectively. These elasticities show that presented inputs use in stage 3 (irrational use). Optimum values of feed and fry are 0.7 kg/m/day and 207 g m-2, respectively. These optimum values are more than average use of these inputs (i.e., 0.04 kg and 115 g). Optimum values of labor, drug and water flow are 1.1 people, 10 kg and 156 L sec-1, respectively.
These optimum values are less than average use of these inputs (i.e., 2.8 people, 44 kg and 17.18 L-1). Zeranejad and Rezaei (2004) in Kohkiloyeh and Boyerahmad Province showed that feed, water flow and temperature have positive effect on trout fish, production. Other inputs i.e., labor and initial piece number of fish has negative effect on fish production. El- Nagger et al. (2006) showed that high prices of fish feed, declining fish prices and lack of finance are serious constraints facing fish farmers in Egypt. Feed costs of fish is 3.87 LE kg-1 that representing 58.9% of the production costs. The break-even analysis showed that average production costs of 6.57 LE kg-1 of fish while the sale price is 7.5 LE kg-1. Correlation matrix showed that there is high positive relationship between the level of generated income and feed costs, other costs, quantity of fish seeds, cost of fuel, cost of extra labor, permanent staff salary and cost of transportation except cost of fertilizer. Also, results of production function estimation showed that quantity of fish seeds is an important factor influencing on revenue of fish farming farms. Other factors such as farm size and age of farmers have positive but non-significant effect on revenue of fish farming farms.
Othman and Sadek (2004) found that fish feed prices rise from 800 LE t-1 in 1992 to 1800 LE t-1 in 2003 while prices of fish from 1995 to 2002 declined. Olagunju et al. (2007) showed that there is a significant relationship between total revenue and cost of feed, years of farming experience and labor. The study also showed that the sum total of elasticities of variable was less than unity, which indicates that fish production in Nigeria is in stage two i.e., economical stage of production. Hinshaw et al. (1990) showed that small farm budgets are for estimating establishment and operating costs for trout farms producing up to 100000 pounds year-1. The labor values included in the establishment costs assume that most of the construction has been completed by contracted labor rather than the owner. Any construction the farm owner can reduce the total cost proportionately. The water flow required for this system would be a minimum of 3,800 gallons min-1 (8.3 cubic feet sec-1). The average loading rate would be 6.5 pounds/gallon/min and the average stocking density would be approximately 4.5 pounds cubic-1 foot of water volume. Savings in construction of this facility come primarily from efficiencies gained by building larger tanks. The total estimated cost for this system would be $99, 556.02.
Petr and Swar (2002) indicated that the application of prevailing technology can produce 100-200 t ha-1 in a 14-15 month period, starting with free-swimming larvae, but depending on water supply and culture practices and quality of the feed. The result showed that it costs about NRs 255 to produce 1 kg of trout, which is selling for NRs 300 kg-1. The analysis gives a profit of NRs 45 kg-1 of fish and gives 19.5% rate of return on initial cost. The rate of return on operating cost is 17.6%. It showed that rainbow trout would be a profitable export if produced commercially. Bozoglu et al. (2007) indicated that the partial percentage of the feed-use variable was 99%, whereas that of all other variables was 1%. The education level of operators, feed use and capital use positively affected trout production, whereas the stocking density and pond size negatively affected trout production. Technical assistance and extension programs concerning stocking, feeding and disease control that resulted in decreased stocking density and increased feeding efficiency may increase trout production by approximately 20%.
There are some problems in scope of cold water fishes especially trout that must study. Lack supply of quantity and quality fish child that affect production capacity of it, surface water pollution and in some condition ground water pollution that tend to losses of trout because of high sensitivity of this type of fish, power outage and problems of this scope have to fishing the trout before of economical weight and supply to market or losses the total of trout fishes, lack of information about market demand that limit the production, low production, high production costs especially labor, lack of optimum size minimization of production costs and lack of government support of production especially farm expansion are the major problems in trout farming scope. Regard to these problems, this paper was carried out to study of factors influencing on trout fish production in a quantitative model. Results of this study can help to policy makers and trout producers to management of production inputs regard to computed inputs elasticities and outputs to achieving high efficiency and productivity and then to high profit at farm level. Also, this study will try for creating of small and medium scale farms of fish farming. In fact, fish farming in fresh water because of need to partial capital and short run return of investment have high utility and profitability to justification of investment.
MATERIALS AND METHODS
Data Collection
This study was conducted based on a sampling survey on the trout producers in 2008. In fact, the data used in this study come from a primary survey. Number of sample (farmers) selected by using the simple random sampling (Cochran, 1977). The survey covered 16 cities. From the selected cities a list of trout farm was prepared and these farms were selected at random. The survey thus covered 105 trout producers from 16 cities. Detailed information pertaining to costs, production and other needed data collected. The data were collected in Khorasan Razavi Province of Iran using interview technique and filling of questionnaires by author.
Data Analysis
Trout fish production function is estimated by using of a sample of 105 trout farmers in Khorasan Razavi province in 2008. The choice of functional form for the trout production function (1) is a matter of empirical question. The choice depends on flexibility, computational ease, relevance for the study and comparability with previous studies. This paper experimented with two functional forms- Cobb-Douglas and Transcendental. However, after estimation of two models and use of restricted F test, Cobb-Douglas production function selected for evaluating the effect of inputs on trout production in Razavi Khorasan Province. The Cobb-Douglas production function of trout can be written as:
| (1) |
where, Y is the quantity of trout output (kg), Xi (I = 1, 2,..., 8) is the variable inputs such as number of entrance fish child to farm (piece), labour (man-day), water flow (L sec-1), farm area (m2), water temperature degree (°C), number of fish losses (piece), feed (kg), fish farming period (day), D is a dummy variable for water sources of trout farming farms (dummy takes the value of one if the farmer use the wells and zero otherwise i.e., river and ghanat), u is random error term. Ln is logarithm, α, β and γ are parameters of the production function to be estimated. βi shows the elasticity of inputs. Model (1) is estimated by Ordinary Least Square (OLS) method (Gujarati, 2003).
RESULTS AND DISCUSSION
Production Condition in Khorasan Razavi
Based on Jihad Agriculture Organization (JAO) of Khorasan Razavi Province (2008), this province has 1695 spring (sources), 6284 ghanats, 10088 wells and 42 rivers that apart of these waters can use for trout farming. These water can use in agricultural farm and increase agricultural production. Regard to potential of this Province, about 1239.8 tone of different cold water fishes that trout form the major of it produce in 127 farms or 106356 m2 (Table 1).
Characteristics of Trout Production
Table 2 shows that average production in trout farming farms of Khorasan Razavi Province is equal 5483.78 kg in each production period. Average yield of trout fish is 5.07 kg m-2. Regard to this yield, there is a potential for increasing of yield in unit of area (m2). Optimum water temperature degree for trout production is 15-16°C. The survey data of trout farming farms show that average water temperature degree of farms is in presented range. Fish losses are function of environmental, managerial conditions and disease. Table 2 shows that average rate of trout losses in farming farms of Khorasan Razavi Province is 7.84%. Average period of fish farming is 164 days. Estimates show that average used labor in fish farming period is equal 142 man day-1. These inputs have major role in fish farming, control of environmental water conditions, feed and fishing. Average growth of fish is 2.37 g day-1. Average weight of fry in entrance time to farms is 24.13 g.
| Table 1: | Cold water fishes production in fish farming farms of Khorasan Razavi Province |
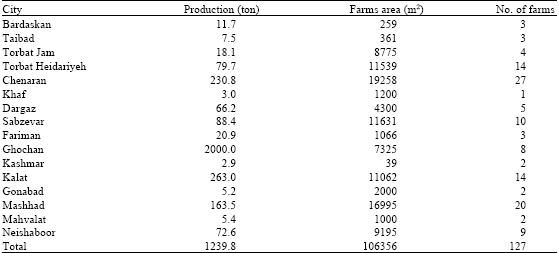 | |
Source: JAO of Khorasan Razavi Province ( 2008) | |
| Table 2: | Characteristics of the important variables of trout production for one period in Khorasan Razavi Province |
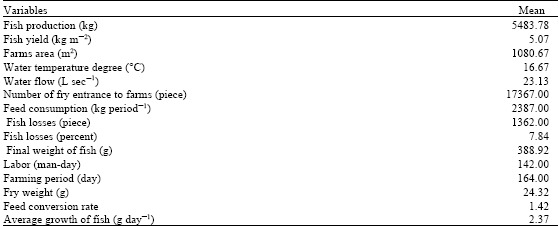 | |
Production Costs and Profit
Trout production costs consist fry, feed, plant oil, vitamin, drug, labor, water price (fee), power (electricity), fuel (energy) and other costs that allocate 15.53, 42.12, 0.4, 0.74, 11.36, 0.52, 1.67, 3.76, 4.43, 8.65 and 10.81% of total production costs, respectively. Total production costs in each period (for 5483.78 kg) are 128968447 rial (23518165.75 rial t-1). Average daily cost and average cost of each fishing fish (final fish) are 786392.97 and 8085 rial, respectively. Regard to total fish cost price is 23518.16 rial kg-1. Sale price to retail sale representatives is 30000 rial kg-1. Therefore, gross revenue (margin) is 6481.84 rial kg-1. Total revenue of saling the trout in each period (for 5483.78 kg) is 164513400 rial. By subtracting the costs, total gross revenue derive equal 35544953 rial. Cost, revenue and gross revenue of trout estimated 49.13, 62.67, 13.54 rial/day/fish, respectively (Table 3).
Trout Production Function
Table 4 shows that farms area, water temperature degree, number of fry, feed, fish farming period, water flow and fish losses are statistically significant. These variables justificate 56.8% of dependent variable (fish production) variation. Two variables i.e., labor and types of water source aren't statistically significant. Farms area, number of fry, feed, fish farming period and water flow have positive effect and number of fish losses and water temperature degree have negative effect on trout production.F statistic shows that regression is significant at 1% level.
| Table 3: | Average costs and profit of trout production in Khorasan Razavi Province |
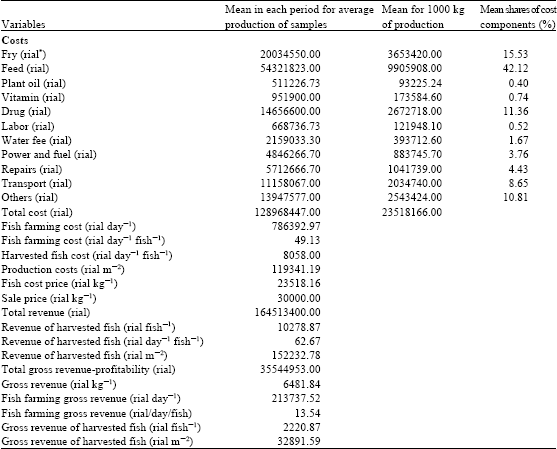 | |
*9960 rial=1$ | |
| Table 4: | Trout production function in Khorasan Razavi Province |
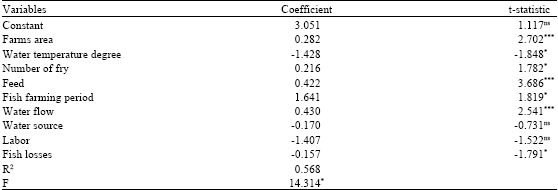 | |
*Significant at 10% level, ***Significant at 1% level, ns: Non significant | |
Farms area of fish farming is one of the important variables influencing on trout production that share (elasticity) of it on fish production is 0.282. In the other words, by increasing 1% in farms area (10.8 m2), trout production will increase 0.282% i.e., 15.46 kg (Table 5). Regard to this variable, it reveals that expansion the farms of fish farming can increase trout production but increasing rate is not high and it is less than current average harvest i.e., 5.07 kg m-2.
| Table 5: | Share of different factors on trout production |
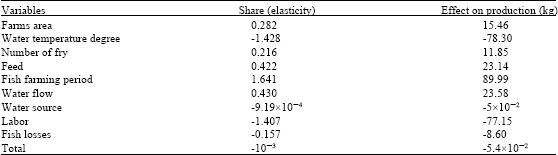 | |
Water temperature degree is one of the major factors of trout production (cold water fishes). In the other words, water temperature degree has positive effect on trout production. Trout can produce in water with 8-18°C. The best and optimum temperature for feed and growth of trout is 15-16°C. Needed water for farming of trout must be full of oxygen and without of noxious gasses. Agricultural wells are without sufficient oxygen and have noxious gasses for trout farming. Estimated production function shows that temperature degree of used water to produce of trout in current condition is high (in stage 3) such that it has negative effect on trout production. Regard to estimation coefficient (elasticity), it revealed that by increasing 1% in water temperature degree, trout production will decrease 1.848%. It represents the important role of water temperature degree in trout production. In reality, this fish is very sensitive to water temperature degree and increasing in temperature degree more than acceptable range would have negative effect on growth of fish and the on farm production. Results of Khoshakhlagh and Kiani (1999) study confirms this result but this result is not consistent with findings of Zeranejad and Rezaei (2004). Regard to Table 5, by increasing 1% in water temperature degree, trout production will decrease 78.3 kg. This value is considerable and has a high effect on trout producers' revenue.
Fry is major input of trout production that has a positive and direct effect on fish production. Trout production function revealed that by increasing 1% in number of entrance fry to farms (i.e., 173.67 fish), production of trout in farms (output or final harvesting) will increase 0.216% i.e., equal 11.85 kg (Table 5). This result is consistent with Koshakhlagh and Kiani (1998) and El-Naggar et al. (2006) studies but is not consistent with findings of Zeranejad and Rezaei (2004). It is necessity that sufficient fry enter to farms due to area and farm capacity for achieving to estimated fish production.
Feed is an important input of trout production that directly affects fish production. Table 3 shows that after fish farming period and water flow, feed has the highest elasticity equal 0.422. By increasing 1% of this input, quantity of trout production will increase 0.422%. Regard to Table 4, it revealed that feed share (0.422%) in trout production is equal 23.14 kg in each fish farming period. Therefore, fish feeding can increase trout production 23.14 kg (Table 5). Table 4 shows that after fish farming period and water flow, feed has the highest elasticity equal 0.422. This result confirms findings of Khoshakhlagh and Kiani (1999) and Olagunju et al. (2007) but it is not consistent with results of Zeranejad and Rezaei (2004).
Fish farming period is an important factor of trout production with high affecting degree so that it has the highest elasticity or share in production. Table 4 shows that by increasing 1% in fish farming period, trout production will increase more than 1% i.e., about 1.641%. In the other words, by increasing 1.64 days in fish farming period, quantity of trout will increase 89.99 kg (Table 5). Table 1 represents that average growth of trout in farms is 2.37 g day-1. Regard to number of entrance fry to farms and losses, increasing in average weight of fish would be 75.86 kg for two days. This value is consistent with calculated value through production function.
Water flow is a variable that can effect on quantity of entrance water to farms and speed of water depletion and consequently on quantity of transferable oxygen. Therefore, predicts that its' effect on trout production would be positive. Estimated production function showed that water flow has the highest positive effect on trout production-after fish farming period- so that by increasing 1% of this variable, trout production will increase 0.43% (Table 4). Table 5 shows that by increasing 1% in water flow (i.e., 0.2413 L sec-1 or achieving to flow 24.37 L sec-1), trout production will increase 23.58 kg. This result is not consistent with KoshaKhlagh and Kiani (1999) but confirms results of Zeranejad and Rezaei (2004) study.
Water supplying source of farms is a factor that has special effect on quantity of trout production. In reality, water quality because of lack of noxious gasses, having sufficient oxygen and lack of pollution can directly affect trout production. Wells water have less oxygen and more noxious gasses than other sources. Therefore, it is necessary to promote oxygen and decrease noxious gasses. Based on Table 4, coefficient of water source-dummy variable-shows that quantity of produced trout with wells water is 0.17 less than other sources. This effect is not significant and its effectiveness is low because managers of these farms solve existent problems of water.
Labor is a key and managerial variables of trout production. Trout farming farms use fixed labor and use variable labor in special situation. Regard to existent fixed labor in fish farming period, these farms over use of this input. Estimated production function shows that labor is not significant but its' sign indicates that these farms use labor in stage 3. In fact, effect of this input on trout production will be diminishing (-1.407%). Table 5 shows that by increasing 1% in labor, trout production will decrease 77.15 kg in each fish farming period. This result is consistent with Khoshakhlagh and Kiani (1999) and Zeranegad and Rezaei (2004).
Fish losses are an influencing factor of trout production that has negative effect in production process. Table 4 confirms that by increasing 1% in fish losses, quantity of trout production will decrease 0.157% i.e., 8.6 kg.
This study is unique as methodology and variables that enter in production function. In fact, very limited studies have been conducted to optimize production using quantitative models. Rather, this study used some combined index and new index to analysis of economics of trout. Also, this study calculates the quantity effect of all important variables on trout production in quantative model (Table 5). Therefore, some results of this study can not compare to other studies (Hinshaw et al., 1990; Petr and Swar, 2002; Bozoglu et al., 2007). Some results of this study is differ from previous studies because of type of quantative model (model selection), type of variables and number of it.
CONCLUSION
This research tried to study of management of trout production in Khorasan Razavi Province using a cross sectional data of 105 trout producer and production function approach in 2008. Results showed that farms' area, number of fry, feed, fish farming period and water flow have positive effect on trout production and water temperature and fish losses have negative effect on it. Farms area, water temperature degree, number of fry, feed, fish farming period, water flow, water source, labor and fish losses elasticities are 0.282, -1.428, 0.216, 0.422, 1.641, 0.430, -9.19x10⁻⁴, -1.407 and -0.157, respectively. The highest positive effect is due to fish farming period that shows trout producers harvest earlier of economic harvesting time and supply to market. The highest negative effect is due to water temperature that shows it is high. Use of farms' area, number of fry, water flow and feed are at stage 2. Water temperature and fish losses are at stage 3. Effect of farms area, water temperature degree, number of fry, feed, fish farming period, water flow, water source, labor and fish losses on fish production are 15.46, -78.30, 11.85, 23.14, 89.99, 23.58, -5x10⁻², -77.15 and -8.60 kg, respectively. Fish cost price is 23518.16 rial kg-1 that sale 30000 rial kg-1 at market. Cost, revenue and gross revenue of trout estimated 49.13, 62.67, 13.54 rial/day/fish, respectively. Gross margin (income) is 6481.84 rial kg-1. Regard to results, fish feed management, supplying of farms water from river and spring, try to decrease of water temperature to 15-16°C, fish harvesting in income maximization time and farm environmental management suggested.
ACKNOWLEDGMENTS
The authors gratefully acknowledge the contributions of Ferdowsi University of Mashhad (FUM) for financial support of project No. 236P-22-09-2009
REFERENCES
- Bozoglu, M., V. Ceyhan, H. Avni Cinemre, K. Demiryurek and O. Kilic. 2007. Important factors affecting trout production in the Black Sea Region, Turkey. Czech J. Anim. Sci., 52: 308-313.
Direct Link - Gujarati, D.N., 2003. Basic Econometrics. 4th Edn., McGraw-Hill, United States, ISBN-10: 0-07-112342-3, Pages: 1002.
Direct Link - Hinshaw, J.M., L.E. Rogers and J.E. Easley, 1990. Budgets for Trout Production: Estimated Costs and Returns for Trout Farming in the South. SRAC., UK.
Direct Link - Petr, T. and D.B. Swar, 2002. Cold Water Fisheries in the Trans-Himalayan Countries. Feed and Agriculture Organization of the United Nations, Rome.
Direct Link - Olagunju, F.I., I.O. Adesiyan and A.A. Ezekiel, 2007. Economic viability of cat fish production in Oyo State, Nigeria. J. Hum. Ecol., 21: 121-124.
CrossRefDirect Link