
S.M. Nazmul Alam
Integrated Tropical Coastal Zone management, School of Environment, Resource and Development, Asian Institute of Technology, Thailand
Journal of Fisheries and Aquatic Science
Year: 2007 | Volume: 2 | Issue: 1 | Page No.: 56-62


ABSTRACT
Between January and August 2002, a study was undertaken in 69 shrimp farms of three major ownership (individual, group and outside lease) categories to determine the extent of use of biological and chemical products in extensive shrimp farming system in southwest Bangladesh. Farmers in the study area used on an average 5 different biological and chemical products. The most commonly used products were soil and water treatment products (lime and cow dung) to improve culture conditions. Farmers under individual category used an average of 67.34 kg ha ‾ 1 lime, which was lower than the farmers under group category (96.71 kg ha ‾ 1) and the farmers under outside category (74.39 kg ha ‾ 1) respectively. The maximum application of cow dung was 1,058.72 kg ha ‾ 1 used by the outside shrimp farmers. Farmers spent 0.1-0.3% in chemicals, 0.6-1.0% in lime, 1.3-1.4% in organic fertilizer, 0.2-1.4% in inorganic fertilizer respectively of their total production cost in the system. Average farm size, production and cost contribution of the used products are described. Drugs and antibiotics and therapeutants for disease control were not available in the study area.
PDF Abstract XML References Citation
How to cite this article
S.M. Nazmul Alam, 2007. Biological and Chemical Products Use in Extensive Shrimp Farming in Southwest Bangladesh. Journal of Fisheries and Aquatic Science, 2: 56-62.
DOI: 10.3923/jfas.2007.56.62
URL: https://scialert.net/abstract/?doi=jfas.2007.56.62
DOI: 10.3923/jfas.2007.56.62
URL: https://scialert.net/abstract/?doi=jfas.2007.56.62
INTRODUCTION
Shrimp farming in earthen ponds has become an important economic enterprise in the world. In shrimp aquaculture, as in all food production sectors, the external inputs required for successful crop production are fertilizers and chemicals. These have a great influence on the production efficiency and reduce the waste of the resources. In extensive system of shrimp farming this may be limited to fertilizers while in more intensive system a wide range of natural and complex chemical compounds may be used. As in agriculture, chemicals are essential ingredient to successful aquaculture, which have been used in various forms for centuries (Subasinghe et al., 2000). Fertilizing the pond has assumed an important role to supplement nutrient deficiency and augment biological productivity through autotrophic and heterotrophic pathways (Das and Jana, 1996; Schroeder, 1974). On the other hand, lime is used to enhance the effect of fertilizer, neutralizing the pond acidity and increasing both alkalinity and hardness (Wurts and Masser, 2004).
The shrimp farming industry has been subject to criticism from an environment point of view. Concern has been expressed regarding the use of chemicals in shrimp farms and its potential impacts on the environment and human health (Subasinghe et al., 2000; Graslund and Bengtsson, 2001; Hopkins et al., 1995). Some of the issues including destruction of mangrove (Hopkins et al., 1995), salinization of the soil (Begum and Alam, 2002), eutrophication (Boyd and Clay, 1998) and dispersion of chemicals in the environment (Kautsky et al., 2000) have expedited the shrimp farming industry a negative image in countries that import shrimp. A number of studies have been conducted on chemicals and biological products used in semi-intensive and intensive shrimp farms in Southeast Asia and expressed concern regarding the potential impact on the aquatic environment, adjacent terrestrial ecosystems and human health. There is a lack of information about the quantities of biological and chemicals used in extensive shrimp farming system. The present study aimed to list biological and chemical products used in extensive shrimp farming system in southwest Bangladesh.
MATERIALS AND METHODS
Study Area
Geographically the study area is situated at 22 ° 11/-22 ° 17/N and 89 ° 03/-89 ° 12/E, in brackish water area of southwestern Bangladesh (Alam et al., 2002). Administratively it is in the Munshiganj Union under Shyamnagar Upazila of Satkhira District. The study was based on primary data sources collected during January to August 2002.
Farm Ownership Category and Sampling
The major categories of shrimp farm ownership as defined by Caritas (1997) according to the land tenure arrangements are:
| • | Individual owner: In which the land in the farm is owned and operated by one person. Thirty five individual farms were brought under the study. |
| • | Farmers group: In which the land in the farm is owned by a number of persons who pay active roles in operating the farm and share the income. Thirty one such farms were interviewed during the study. |
| • | Outside lease: In which the land in the farm is leased out by the owners to a person or persons living outside the polder area. Only three farms were sampled for the study. |
Random sampling method was employed for selecting the sample population from scatteredly set up shrimp farms in the study area. A questionnaire covering information on basic production data, management practices with focusing use of biological and chemical product was developed for the purpose. Most of the respondents were the owner (66.4%) of the farm, followed by the responsible head (24.5%) and manager (9.1%) respectively and all of them had a long-term engagement in their respective farming practices.
Products Category
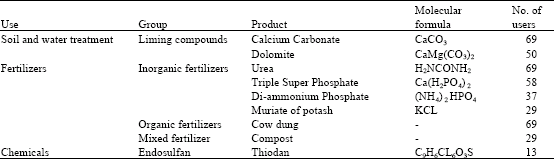
The biological and chemical products documented in this survey were sorted into the following groups: Liming materials, fertilizers, chemicals and other soil and water treatment compounds.
Cost Estimation
The detail cost of production of the surveyed shrimp farms was analysed to determine the cost contribution of the biological and chemical products. The main inputs used by the farmers were pond preparation, lease rent, fry, labour and fertilizers. All the inputs and their cost were calculated on per hectare basis.
RESULTS AND DISCUSSION
Management Practices
Rarely there has a unique design for shrimp farms been followed by any category of shrimp farmers. One hundred percent of the respondents had open system, with no treatment ponds.
Bottom topography of the surveyed farms was irregular. The average area of the surveyed shrimp farm was 8.81 ha (Table 1). Farms under the individual category were generally smaller in size (2.28 ha) followed by the group category (4.59 ha). The largest size of the farm was found under the outside lessee category. The mean size of the farm under this category was 19.56 ha with the largest farm being 36.44 ha.
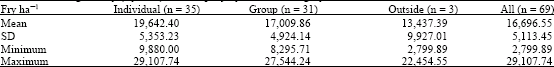
The majority of the farms maintained a water depth lower than 1 m. All the farms routinely exchanged water volume for 4-6 days during every lunar cycle. In case of unwanted occurrences farmer exchanged water at any time. The majority (65.45%) of the surveyed farms stocked wild fry as their first preference. A few stocked farms with fry from wild and hatchery sources. Shrimp farmers under different category were found to stock with varied number of fry. Table 2 showed the stocking density by all categories.
The study revealed that the smaller farms stocked at higher number/ha than did the larger sized farms. The individual shrimp farmers preferred to stock the farm with more fry (19,642 fry ha‾1) than did the other categories. The outside farmer holding the largest amount of farming area stocked only 13,437.39 fry ha‾1. Overall the average stocking density in the study area is 16,696.55 fry ha‾1 (16.76 fry m‾2).
All farms relied on natural food. The farmers experienced an average 76% loss of their post stock fry. The large farm under outside category had the highest survivability of the fry (45%) while the lowest survival rate was experienced by the individual (24%) and the group farmers (26%) respectively. The findings from the surveyed farms suggested a variable yield of Penaeus monodon ranging from 146.39 to 153.12 kg ha ‾ 1 with a mean yield of 150.45 kg ha ‾ 1, indicating a lower productivity (Fig. 1). Among the total yield of the shrimp farms, 51% of the total weight came from only Penaeus monodon while the rest 18 and 31% came respectively from other shrimp and fin fish (Alam, 2004).
Use of Biological and Chemical Products
Only 9 types of products were identified in the present study (Table 3). Farmers in the study area used 5 (average) different biological and chemical products. This figure is far lower than the findings of Primavera et al. (1993) and Graslund et al. (2003).
| Table 1: | Size of the shrimp farm by different category |
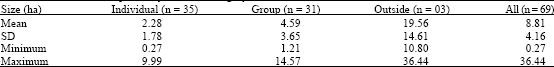 | |
| Table 2: | Stocking density (fry ha ‾ 1) of shrimp fry by different category |
 | |
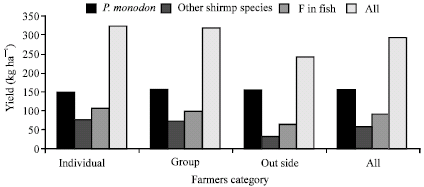 | |
| Fig. 1: | Yield from shrimp farms by different category |
| Table 3: | List of products used by the surveyed shrimp farmers |
 | |
Primavera et al. (1993) found that 40 chemicals and biological products were used in intensive shrimp farms in the Philippines while Graslund et al. (2003) found that 70 different substances or types of products were used in semi-intensive shrimp farming in Thailand. The very common products used in different shrimp farming systems (extensive, semi-intensive and intensive) are fertilizers and liming materials. Disinfectants, antibiotics, algaecides, herbicides, probiotics, feed additives, vitamins are widely used in semi-intensive and intensive shrimp farming in Southeast Asia to improve production efficiency.
Use of Liming Materials
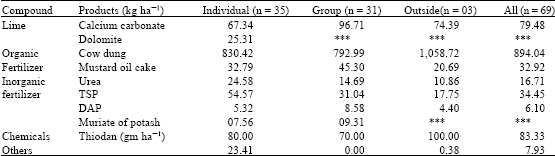
Lime materials are applied to neutralize acidity and increase total alkalinity to farm water and soil (Boyd and Tucker, 1998). Some calcium and magnesium from the liming materials are absorbed by the pond biota to become normal constituents of plants and animals, absorbed by the soil, or dissolved in the water (Boyd and Massaut, 1999). The most commonly used compound is lime to treat the soil and water, respectively. All (100%) the surveyed farmers used agricultural lime (CaCO3) with varied proportion throughout farm management. Limestone is rather safer to use than lime, often cheaper and considered to be the most effective liming material for farms under normal circumstances (Boyd and Tucker, 1998).
The liming materials are the first biological input during preparation of shrimp farms. This is applied after drying and filling the farm with water. The limestone was made wet with water in a drum over night and sprayed over the farm on the following day. Farmers in the survey used varied doses of lime. The individual category of shrimp farmers used lower application rates of lime (67.37 kg ha ‾ 1) compared with the group farmers (94.71 kg ha ‾ 1) and the outside farmers (74.39 kg ha ‾ 1), respectively (Table 4). In addition, 5 individual farmers used dolomite (25.31 kg ha ‾ 1) as a water treatment agent while their farms were attacked with a viral disease. None of the liming materials are known to be any of hazards for food safety (Boyd and Massaut, 1999).
Use of Fertilizers
Fertilizers have a wide spread use in shrimp farms to increase the growth of natural food (GESAMP, 1997; Boyd and Massaut, 1999). There is normally no need to fertilize the farms if the shrimp are given commercial feed, and there is an inverse relation between the amount of feed added, and the amount of fertilizer used (Boyd, 1995; GESAMP, 1997). The studied shrimp farms did not use supplementary feed and relied on natural food that came from using fertilizers. Two groups of fertilizers (organic and inorganic) used by the surveyed shrimp farms.
The most common inorganic fertilizers are nitrogen and phosphorus compounds. These may be applied as a single compound or mixed fertilizer with two compounds. All the farmers used Urea, Triple Super Phosphate (TSP) and Di-ammonium Phosphate (DAP) with varied proportions. Among the inorganic fertilizers TSP was applied in large quantities, which was almost double the use of Urea, by all category of shrimp farmers in the study (Table 4). The application rate of DAP was also lower (average 6.1 kg ha ‾ 1) among the used inorganic fertilizers. Muriate of Potash is also used by the individual farmers (7.56 kg ha ‾ 1) and group farmers (9.31 kg ha ‾ 1), respectively. The outside shrimp farmers used lower application rates of inorganic fertilizers in all cases.
The most commonly use of organic fertilizers is manure (cow dung). Manures have much lower concentrations of nutrients than inorganic fertilizers. Because of its low nutrient content, manure application rates usually are much higher than those for chemical fertilizers. The outside category farmers used the maximum application rates of cow dung (1,058 kg ha‾1) than did the other two categories of farmers. On average farmers applied 894.04 kg ha‾1 cow dung into their shrimp farms. The farmers also applied mustard oil cake at 32.92 kg ha‾1 (average).
A combination of inorganic fertilizers (Urea + TSP + DAP) with organic materials (cow dung + agriculture by-products + mustard oil cake) was commonly used with no proper ratio to make compost in shrimp farms. All the materials are placed in a hole at the periphery of the dike but in contact with pond water and kept for 1-2 months. In the pit, the composting mixture decomposes slowly to release nutrients into the pond that stimulate phytoplankton growth that serve direct and indirect sources of food for fish and shrimp. The waste production and contamination as a consequence of the use of those inputs was very low (Alam et al., 2005).
Fertilizer nutrients are absorbed by plants and enter the food web of aquaculture ponds. More than 25% of the nutrients added to ponds as fertilizers are recovered in aquatic animals at harvest (Boyd and Tucker, 1998). These nutrients occur as constituents of biomass such as protein, calcium phosphate in bones and minerals. The fraction of the fertilizer nutrients not harvested in aquaculture products can be found in other pond organisms, dead organic matter and sediment or lost in out flowing water. Nitrate can be converted to nitrogen gas by denitrification and ammonia may be lost to the air by diffusion (Gross et al., 1999). If few days are left between fertilizer application and water discharge to the surrounding environment, most fertilizer nutrients will have been absorbed by the pond organisms, adsorbed by sediments or lost to the atmosphere through denitrification or ammonia volatilization. Thus, none of the chemical fertilizers are known to be of any hazard for food safety.
Use of Chemicals
Like the semi-intensive and intensive shrimp farming systems, there was no wide use of chemicals in extensive shrimp farming in Bangladesh. Of the farmers affected by disease, most extensive farmers did not use chemicals. Shrimp farmers occasionally use chemicals to disinfect their farms. Drugs and antibiotics were not available in the study area. Only 13 (18.84%) farmers used Thiodan (Endosulfan 35% and emulsifiers 65%) during preparation of pond to kill crabs, wild shrimp and fish and appearance of diseases. But the doses varied (70-100 gm ha ‾ 1) between farmers of the different categories, as they did not know the exact application rate from the sources of the product (Alam et al., 2005).
| Table 4: | Application rate (kg ha ‾ 1) of the products used by the surveyed shrimp farmers |
 | |
| Table 5: | Cost contribution (taka ha ‾ 1) of the products in farming system |
 | |
| a1 US $ = 58.5 Taka in August 2002 | |
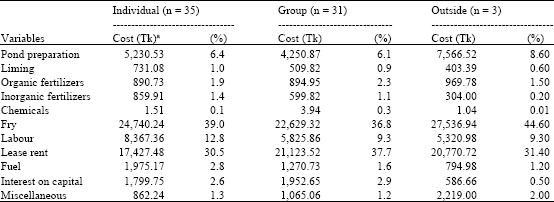
Cost Contribution of the Products
The amounts spent for fertilizers and chemicals are generally very low in the extensive shrimp farming systems. It appeared that the cost of fertilizers and the chemicals contributed less than 5% of the total cost. The majority cost of shrimp farming was the cost of fry, which accounted 39% by individual farmers, 36.8% by group farmers and 44.6% by the outside farmers, respectively. The second highest cost was lease rent and the third was labour. The total production costs are relatively lower for the extensive shrimp farming than for more intensive farming. The liming costs accounted by the different categories also varied. Liming costs for the individual farm type in this case accounted for 1% of total costs; for the group farmers 0.9%; while for the farm outside farmers it accounted only for 0.6%. For the total cost of fertilizers (organic and inorganic), the individual farmers spent 3.3%, the group farmers 3.2% and the outside farmers 1.7% of the total costs respectively. In contrast to the cost of fertilizers; the cost contribution of chemicals to extensive shrimp farming was insignificant and ranged 0.01-0.3% of the total cost (Table 5).
ACKNOWLEDGMENTS
The study was performed in alliance with Integrated Tropical Coastal Zone Management at the Asian Institute of Technology, Thailand. The author gratefully acknowledges the research grants provided by DANIDA and expresses heartfelt thanks to many people who paid very much attention and valuable time during the study period.
REFERENCES
- Begum, A. and S.M.N. Alam, 2002. Social and Economic Impacts of Shrimp Disease among Small-scale, Coastal Farmers and Communities in Bangladesh. In: Primary Aquatic Animal Health Care in Rural, Small-Scale, Arthur, J.R., M.J. Phillips and R.P. Subasinghe (Eds.). Aquaculture Development. FAO Fisheries, UK., pp: 191-200.
- Graslund, S. and B.E. Bengtsson, 2001. Chemicals and biological products used in South-East Asian shrimp farming and their potential impact on the environment: A review. Sci. Total Environm., 280: 93-131.
Direct Link - Graslund, S., K. Holmstrom and A. Wahlstrom, 2003. A field survey of chemicals and biological products used in shrimp farming. Mar. Pollut. Bull., 46: 81-90.
CrossRef - Kautsky, N., P. Ronnback, M. Tedengren and M. Troell, 2000. Ecosystem perspectives on management of disease in shrimp pond farming. Aquaculture, 191: 145-161.
CrossRef - Primavera, J.R., C.R. Lavilla-Pitogo, J.M. Ladja and M.R. Dela Pena, 1993. A survey of chemical and biological products used in intensive prawn farms in the Philippines. Mar. Pollut. Bull., 26: 35-40.
Direct Link