
O. Dhaimat
Associate Professor in ISRA University, Jordan
T. Shawabkeh
Geologist in Royal Jordanian Geographic Centre, Jordan
Journal of Applied Sciences
Year: 2006 | Volume: 6 | Issue: 10 | Page No.: 2231-2237


ABSTRACT
Urban community is one shape of human kind settlements. Its growth represents specific response to economic, demographic and environmental conditions. Rapid urbanization and industrialization have resulted in sharp land cover changes due to grow of built up area and dismiss of green region and other land uses. The urban development study needs certain methodology, technique and model in order to follow and evaluate the variation of such phenomenon and its side effect towards mankind, land, nature and social and economic activities. The proper tools of data survey of natural and artificial features above earth surface are remote sensing, aerial photography and maps. The most suitable technique of analysis and represent complicated features is geographic information system, where various components are shown layer by layer. The present study was carried out for madaba city in Jordan including built up and surround areas using topographic maps, aerial photographs and satellite images as a collecting, analyze and output require data among half century and make it a guide for future of other cities in the country or region through its technical aspects, deep analysis and precise results.
PDF Abstract XML References Citation
How to cite this article
O. Dhaimat and T. Shawabkeh, 2006. Monitoring of Madaba City Growth by RS and GIS Technique. Journal of Applied Sciences, 6: 2231-2237.
DOI: 10.3923/jas.2006.2231.2237
URL: https://scialert.net/abstract/?doi=jas.2006.2231.2237
DOI: 10.3923/jas.2006.2231.2237
URL: https://scialert.net/abstract/?doi=jas.2006.2231.2237
INTRODUCTION
Normally, urban growth depends much on a number of natural and artificial parameters. Such as climate, hydrology, geology fauna, flora and human activities. Also, land use and land cover play major role on local, regional and global conditions through their matching or differences between each other.
Besides that, urbanization is considered a development shape of human settlements in certain ways such as villages, towns, or cities. But these communities have side effects toward land cover and land use if they don’t be selected properly here and there. Therefore, rapid urbanization and industrialization are considered key factors for both social and economical development of various areas and regions. In addition to that, they are responsible for further changes of environmental situation.
Based on that, the monitoring of land cover changes needs new technology in order to introduce, consistent and repetitive various conditions which relevant to the climate, hydrology and water resources management. Examples of these techniques are Remote Sensing (RS) and Geographical Information System (GIS). The former is a proper tool of obtaining special data from satellites within certain ways of resolution to represent national, regional and global aspects. While, the latter is responsible for input, analysis and output data in number of layers related to the specific subjects, then introduce that to the researchers, planners and decision makers. In other words, RS is considered an attribute of GIS (Banerjee, 2000; Chatanya, 2000).
In order to express the role of previous tools, it needs to select model or case study for applying this technique and to make it acceptable or attractive for people at different positions and periods.
The scope of the present research is to study the urban development of Madaba city in Jordan between 1953 and 2001 by using RS and GIS as tools of collecting, analysis and output data and then makes it a good example for other cities in the country to be followed or imitated in the future.
DESCRIPTION OF STUDY AREA
As shown in Fig. 1, Madaba city has population 100,000 person, 14 km2 urban buildings and it is located at site of 800 m above sea level and 30 km2 south west of Amman city (capital of Jordan).
This city and its surrounded area is considered one of the historical and cultural sites in the country due to its ancient shines and ruins, such as old moziac map of Jerusalem and Mediterranean sea, Nebo mountain, Husban hill, seyaghah church and Mukhayat village (Anonymous, 2001; M. Municipal, 2001).
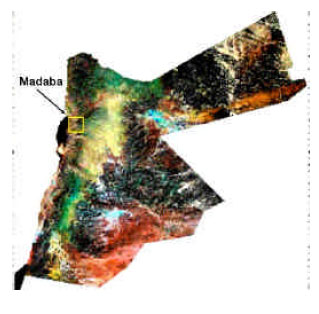 | |
| Fig. 1: | Site of Madaba city |
 | |
| Fig. 2: | Geological features of Madaba city |
 | |
| Fig. 3: | Soil classification of Madaba city |
The domain type of the climate of the area is Mediterranean one, where the average of temperature around 1-14°C in winter and 18-23°C in summer and average rainfall about 220 mm/year (Abed, 2000; Anonymous, 2001).
In addition to that, the study area is covered mainly by rock units, Balqa group and partly by Ajloun group. The former includes limestone, sandstone, phosphate and marle. The latter involves econdial lime stone, massive lime stone and endular lime stone. Sixty percent of the area cover is related to the geological ages of upper cretaceous and quaternary and 40% is covered by thick soil and other deposits (Abed, 2000; Ministry of Agriculture, 2001) (Fig. 2).
Besides that, the soil of the study area is yellow red and deep red of Mediterranean type, which is suitable for field crops growth, such as wheat and barley. Figure 3 shows the classification of the soil of the study area (Anonymous, 2001; Ministry of Agriculture, 2001).
MATERIALS AND DISCUSSION
The present study deals with the urban expansion of Madaba city through 48 years (1953-2001) by using aerial photographs, satellite images and maps as tools of investigations and analysis. Aerial photographs were related to 1953 and 1978, while images were referred to 1985, 1992 and 2001(Anonymous, 2001; Green et al., 1994; Ming-Chih, 2002).
Comparing with the topographic map of Madaba city, aerial photographs and images were scanned and corrected geometrically, but the former was rectified. According to Jordan transverse mercator (JTM) coordinates only, while the images were processing further to overcome the radiometric and geometric errors, then compared with existing land use maps to examine its conducted and classification (Banerjee, 2000; Chatanya, 2000; Green et al., 1994).
Two main classes were recorded at each date to represent the settlements and surrounding areas by analyzing the nature, rate and the location of the urban changes. Estimates of the urban areas growth were obtained by using multiple-date classification map of Madaba city which extracted from images and the Built up area was computed from aerial photographs as (Daghastani, 2003; Pradeep, 2000) shown in Fig. 4 and 5, respectively.
Besides that, the spread nature of the urban land use changes was obtained from images of classified urban built up land, then the extracted images were overlaid and recorded to obtain an urban expansion image and further overlaid with major roads to find the urban land change information as urban development (Daghastani, 2003; Shigenobu and Tran Hung, 2003). This sequence of events was shown in Fig. 6-8, respectively.
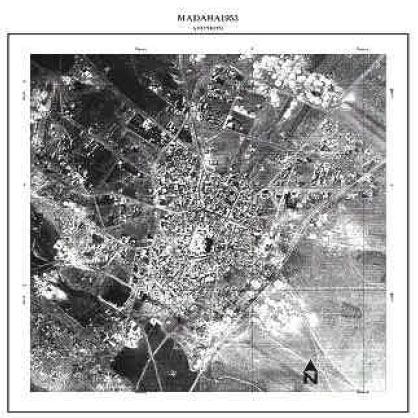 | |
| Fig. 4: | Aerial photographs of Madaba city in 1953 |
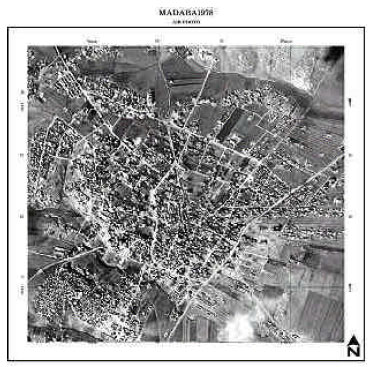 | |
| Fig. 5: | Aerial photographs of Madaba city in 1978 |
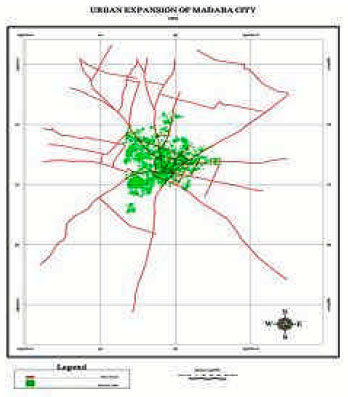 | |
| Fig. 6: | Images of Madaba city in 1983 |
Based on that, the built up area was estimated mathematically at different year as 1.5 km2 in 1953, 3.5 km2 in 1978. 4.8 km2 in 1983. 7.2 km2 in 1992 and 12.8 km2 in 2001. These values were plotted graphically in Fig. 9 and it was shown that the incremental of the built up area was slowly in early years, but I increased sharply in late years. This variation happened due to the incremental of population growth, immigration and life standard.
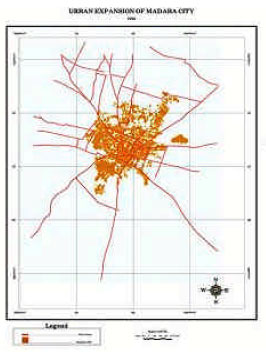 | |
| Fig. 7: | Images of Madaba city in 1992 |
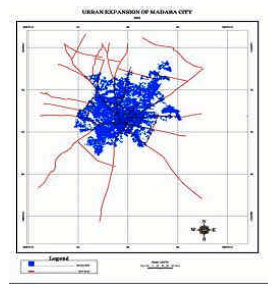 | |
| Fig. 8: | Images of Madaba city in 2001 |
 | |
| Fig. 9: | Incremental of built up area of Madaba city |
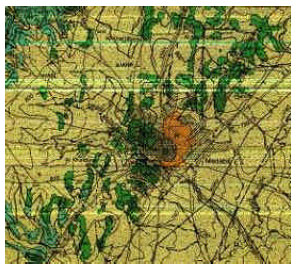
Furthermore, the estimated built up areas were verified by comparing them with cadastral plan as shown in Fig. 10 and it was shown that the urban direction was towards the south and south east in 1985 consuming agricultural land, then became towards north in 1993 where area is rocky and extended more towards north and north east in 2001.
Finally, the previous images were overlaid on a recent panchromatic spot image acquired on 2004 to identify the spread of urban expansion and it was found that the spread direction of built up area was more towards north east and south west. Figure 11 summarized that variation (Ming-Chih, 2002; Shigenobu and Tran Hung, 2003).
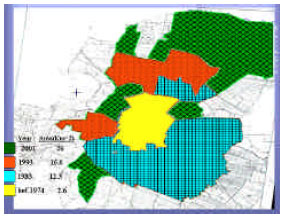 | |
| Fig. 10: | Cadastral plan of Madaba city |
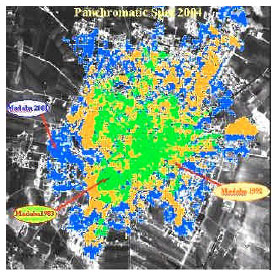 | |
| Fig. 11: | Panchromatic image overlaid other images of Madaba area |
CONCLUSIONS
According to the available data, Madaba city is located within agricultural land and its built up growth consumed the green area during previous years and it will do so in the future, if there is no planning and controlling for its development.
Topographic maps, aerial photographs and satellite images are useful tools of collecting data as shown in the study. But it is necessary to establish data bank for these information in order to save time, effort and economy in the future for this city or other cities.
Planning is necessary for selection proper method, real evaluation and decision making in order to determine the permissible zones of the built up areas without side effect on agricultural land or other uses of land, ecology parameters and human activities.
REFERENCES
- Green, K., D. Kempka and L. Lackey, 1994. Using remote sensing to defect and monitor land cover and land use. Photogram. Metric Eng. Remote Sens., 60: 331-337.
Direct Link