
N. Jafari Ghavzan
Not Available
V.R. Gunale
Not Available
D.M. Mahajan
Not Available
D.R. Shirke
Not Available
Asian Journal of Plant Sciences
Year: 2006 | Volume: 5 | Issue: 5 | Page No.: 871-880


ABSTRACT
Riparian plants are excellent indicators of river condition for many reasons including their relatively high levels of species richness, rapid growth rates and direct response to environmental change. Many human-related alterations to the environment that act to degrade rivers ecosystems cause shifts in plant community composition. In the present study the phytosociological analysis of ten sampling stations of Mula, Mutha and Pavana rivers flowing through the Pune city (Mahareshtera-India) were investigated. Some of the species like Eichhornia crassipes, Pistia stratiotes, Lemna perpusilla, Azolla pinnata in the upstream sampling stations were absent or very low value of frequency index, relative frequency, density and abundance. This is indicating very rare occurrence of this species in clean water or less polluted water body. Wherever, the above species associated with Alternanthera sessilis, Persicaria glabra, Cyperus compressus, Amaranthus tricolor were observed with highest frequency index, relative frequency, density, relative density and abundance at downstream sampling stations of study area. Results obtained indicate that due to various developmental activities in and around banks of Mula, Mutha and Pavana rivers the dominance of weed species are more common than natural vegetation. It clearly indicates the human activities influence in riverine vegetation.
PDF Abstract XML References Citation
How to cite this article
N. Jafari Ghavzan, V.R. Gunale, D.M. Mahajan and D.R. Shirke, 2006. Effects of Environmental Factors on Ecology and Distribution of Aquatic Macrophytes. Asian Journal of Plant Sciences, 5: 871-880.
DOI: 10.3923/ajps.2006.871.880
URL: https://scialert.net/abstract/?doi=ajps.2006.871.880
DOI: 10.3923/ajps.2006.871.880
URL: https://scialert.net/abstract/?doi=ajps.2006.871.880
INTRODUCTION
Vegetation is perhaps the most conspicuous feature of rivers ecosystems and has been used extensively as an indicator of the presence of rivers themselves, their boundaries and as a basis for many rivers classification schemes. River plants are commonly defined as those growing in water or on a substrate that is at least periodically deficient in oxygen as a result of excessive water content (Cowardin et al., 1979). This term includes both herbaceous (vascular and nonvascular) and woody species. Riverine plants may be floating, floating-leaved, submerged, or emergent and may complete their life cycle in still or flowing water, or on inundated or noninundated hydric soils (Cronk and Fennessy, 2001).
They have been used effectively to distinguish environmental stressors including hydrologic alterations, excessive siltation, nutrient enrichment and other types of human disturbance (Moore and Keddy, 1989; Kantrud and Newton, 1996; Philippi et al., 1998).
Riparian plants are excellent indicators of river condition for many reasons including their relatively high levels of species richness, rapid growth rates and direct response to environmental change. Many human-related alterations to the environment that act to degrade rivers ecosystems cause shifts in plant community composition that can be quantified easily. Individual species show differential tolerance to a wide array of stressors. Thus as environmental conditions vary, community composition shifts in response. Plant communities have been shown to change in response to hydrologic alterations (Squires and van der Valk, 1992); nutrient enrichment (Kadlec and Bevis, 1990); sediment loading and turbidity (Sager et al., 1998) and metals and other pollutants. These patterns can be interpreted and used to diagnose rivers impacts. Because they represent a diverse assemblage of species with different adaptations, ecological tolerances and life history strategies, the composition of the plant community can reflect the biological integrity of the river.
Aquatic macrophytes function in several ways in aquatic environment. Aquatic macrophytes are known to suppress the development of wind wave in shallow waters. Reduced wave height leads to the reduction of the resuspension of bottom sediments. This function that aquatic macrophytes may have seems important in deciding the water quality of rivers. Macrophytes can play an important role in improving the water quality of rivers and other water bodies by suppressing the resuspension of bottom sediments (Van den Berg et al., 1998; James, 2004; Scheffer, 1998).
Riverine vegetation is at the base of the food chain and, as such, is a primary pathway for energy flow in the system. They provide critical habitat structure for other taxonomic groups, such as epiphytic bacteria, phytoplankton and some species of algae, periphyton, macroinvertebrates, amphibians and fish. A study of the diversity, density and distribution of aquatic plants is an essential component of understanding a river due to the important ecological role of aquatic vegetation and the ability of the vegetation to characterize the water quality.
MATERIALS AND METHODS
Pune city, at the south west of India is situated on the banks of the confluence of the Mula and Mutha Rivers, at an altitude of over 585 m above the sea level (Fig. 1). The archaeological relics prove that Pune was established as a township in eighth century. Presently the city is under continuous stress due to population growth, industrial growth and waste generation. Phytosociological analysis of ten sampling stations of Mula, Mutha and Pavana rivers flowing through the Pune city (Mahareshtera-India) were investigated and for the herbaceous species quadrat method was employed by following the methods of Raunkaier (1934) and Stromberg (1993). The identification of aquatic plants was done with the help of standard books and monographs like, Singh and Karthikeyan (2000, 2001) and Biswas and Calder (1953). For the analysis of the vegetation some analytical quantitative characters have been analyse from the following procedure.
| • | Lay down a quadrat of 1m wide and 1 m long (1m2) quadrats were laid on the riparian areas along the bank of rivers. |
| • | The quadrats to be lead with the help of nails and rope. |
| • | Count the number of species occurring in each quadrat and record the observations in field note. |
| • | Count the number of individuals of each species and record the observation in field note. |
From each quadrats number of individuals, total number of species is measured. From those characters, Frequency, Relative frequency, Density, Relative density, Abundance, Diversity index and Important value were calculated by following formula:
 |
Shannon-Weaver (1949) index assumes that individuals are randomly sampled from the sample.
Where Pi is the proportional abundance of ith species = (ni/N).
Simpson (1949) gave the probability of any two individuals drawn at random from an indefinitely large community belonging to different species as;
Where:
ni = the number of individuals in the ith species.
N = the total number of individuals.
This index is referred to as dominance index since it weighted towards the abundance of the commonest species rather than providing a measure of species richness. As D increases, diversity decreases and Simpson index is therefore usually expressed as 1-D or 1/D. The presence or absence of plant species was recorded.
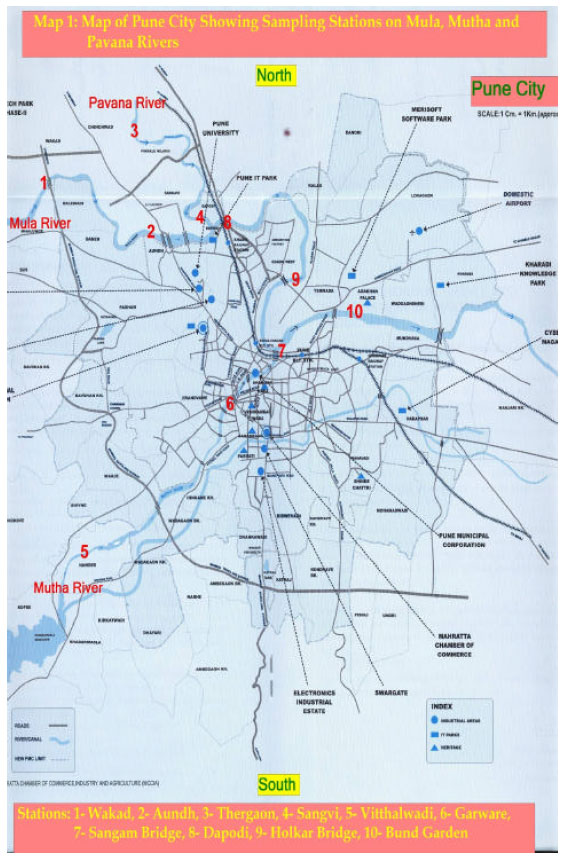 | |
| Fig. 1: | Map of Pune City showing sampling station on mula, Mutha and Pavana Rivers |
This data was also used to determine the homogeneity/heterogeneity of the vegetational stand of the study area. The species types are divided into five frequency classes depending on Raunkier=s (1934) frequency classification as below.
Class-A = 1 to 20%, Class-B = 21 to 40%, Class-C = 41 to 60%, Class-D = 61 to 80% Class-E = 81 to 100%
Each species is classified in above-mentioned classes. A histogram was drawn with percentage of the total number of species on Y-axis and frequency classes A to E on X axis. It is compared with the law of frequency as follows. A>B>C≥ or ≤D<E.
RESULTS AND DISCUSSION
Of the 81 species of plants found in the present study on Mula, Mutha and Pavana rivers flowing through the Pune City (Mahareshtera-India), were 47 Herb species, 10 were Shrub species, 23 were tree species and only 1 Climber species was recorded (Table 1). In the present study maximum plants species were observed at sampling station 4 (Sangvi) follows in station 8 and 1 (Dapodi and Wakad), while minimum plants species were recorded in Bund Garden (station 10 ). All the Phytosociological investigations are presented station wise in Table 2.
Frequency is a measure of the commonness and distribution of a species within a study area. Frequency is expressed as a percentage of sample plots in which a species occurs. It is defined as the chance of finding a species in a particular area in a particular trial sample (Goldsmith et al., 1992). The frequency of individual species or structural type is the number of times the species or structural type occurs in the sampling quadrats. Alternanthera sessilis, Phyla nodiflora, Persicaria glabra, Azolla pinnata, Pistia stratiotes, Amaranthus sp. were having the highest percentage frequency index. The species, which have minimum frequency index, includes Phyllanthus reticulates and Eclipta alba.
Frequency not only shows the importance of species, but also the evenness of spatial distribution in community (Deng et al., 2000). The highest percentage of frequency class A, B, C, D and E was observed 12.5, 41.66, 54.54, 57.14 and 28.57 at sampling station 7, 1, 5, 8 and 10, respectively. Based on Raunkier=s frequency classes, the vegetation represented heterogeneous nature at all sampling stations which are observed noticeably in high polluted area (Sangam Bridge and Dapodi). Raunkier=s (1934) frequency classes for different sampling stations are represented graphically in Fig. 2. Simply, frequency index or relative frequency alone cannot determine the dominant plant community.
 | |
| Fig. 2: | Raunkiaer’s frequency classes in study area |
For the determination of plant community abundance and density values needs to be measured. Few species like Alternanthera sessilis, Phyla nodiflora, Persicaria glabra, Pistia stratiotes, Azolla pinnata exceed all other species not only in frequency index but also in abundance, density and relative density.
In the present study some species like Eichhornia crassipes, Pistia stratiotes, Lemna perpusilla, Azolla pinnata in the upstream sampling stations were absent or very low value of frequency index, relative frequency, density and abundance. This is indicating very rare occurrence of this species in clean water or less polluted water body. Wherever, the above species associated with Alternanthera sessilis, Persicaria glabra, Cyperus compressus, Amaranthus tricolor were observed with highest frequency index, relative frequency, density, relative density and abundance at downstream sampling stations of study area.
In the present study an attempt has been made to understand the patterns of species diversity and human impact on vegetations diversity. On the basis of quantitative estimate, overall species number rank order is station-1>station-2<station-3<station-4>station-5>station-6 = station-7<station-8>station-9 >station-10. This is because diversity is relative to spatial scale, temporal scale and taxocene spectrum (Patil et al., 1997). The Shannon-Weaver and Simpson diversity indices were calculated for all the ten sampling stations. One of the best diversity indices is species richness i.e the number of species present in the area. Figure 3 gives the values of above indices for these stations. Based on the Shannon-Weaver index the sequence among the stations is, from highest to lowest diversity, station 6>station 9>station 3>station 1>station 5>station 4>station 2>station 7>station 10>station 8>. The rank has been changed because Simpson=s index is heavily weighted towards the most abundant species in the sample while being less sensitive to species richness (Magurran, 1988).
| Table 1: | Higher plants species along the 10 sampling stations of Mula, Mutha and Pavana rivers course |
 | |
 | |
| Stations: 1- Wakad, 2- Aundh, 3- Thergaon, 4- Sangvi, 5- Vitthalwadi, 6- Garware, 7- Sangam Bridge, 8- Dapodi, 9- Holkar Bridge, 10- Bund Garden | |
| Table 2: | Phytosociological analysis in different sampling stations of mula, mutha and pavana rivers |
 | |
 | |
In the present study amongst all the study area, station 5 and 9 (Vitthalwadi Holkar Bridge) were represented as most diverse. It has highest species richness due to relatively less human intervention, whereas station 6 and 8 (Garware and Dapodi) were having the least species Shannon diversity index as a result of reasonably high population pressure, apparently patchy vegetation due to biotic interfence involving farming practices, habitat destruction and domestic livestock.
 | |
| Fig. 3: | Shannon-weiner and simpson=s diversity indices for various sampling stations |
Shannon-Weaver and Simpson=s diversity indices have interpreted no significant difference in between the various stations. It suggests that the species were somehow distributed rather evenly. However, there were significant differences in species relative abundance and density. For rivers and aquatic environments, in general, low species diversity is correlated with permanent or long-term periods of inundation and generally in wetlands, seasonally-variable water levels enhance diversity (Mitsch and Gosselink, 2000). The results also indicated that some unnatural species were not distributed uniformly, rather appearing in a thicket. The distributions of these species were found to be depending upon the human interference in the natural vegetation.
The above enumeration indicates the relative range of distribution of various species in the study area. Species like Ipomoea carnea, Amaranthus viridis etc. are restricted in distribution but are abundant locally. Plants like Acalypha ciliata, Ageratum conyzoides, Solanum indicum are restricted in their distribution and rare in occurrence. The species having wide range of distribution and abundant in occurrence include Alternanthera sessilis, Ludwigia octovalvis, Eichhornia crassipes, Parthenium hysterophorus etc. in rivers bed is quite remarkable particularly in urban areas.
Riparian zones are subjected to many different influences that may affect the plants that grow there. There are regional factors such as land cover and climate; local factors such as sunlight, soil type and pH, nutrient availability, micro-topography; and moisture, biotic factors such as competition and both natural and anthropogenic disturbance factors. All of these factors can affect a plant species ability to persist. The hypothesis tested in this study concerns the local anthropogenic disturbance created from different land cover types. The regeneration of natural plant communities within riparian zones is vital to the protection of entire stream systems. Because different disturbances associated with land cover might affect plant communities and individual species differentially, it is important to study community level responses as well as species-specific responses to a land cover disturbance gradient. The responses of the vegetation community and the individual species to external land cover disturbances will potentially determine the future structure and composition of the riparian communities.
The results obtained from our study indicate the presence of Alternanthera sessilis, Ludwigia octovalvis and Amaranthus spinosus are the most commonly growing known to adapt wider range of environmental conditions. Upstream stations showed weeds like Commelina forsskalaei and Ammannia baccifera is commonly growing plants on the bank of rivers. As we go downstream species like Eichhornia crassipes and Pistia stratiotes is more dominant followed by Lemna perpusilla and Amaranthus spinosus this area is more disturbed due to dumping of solid waste and also other debris arising from urban activities.
Overall it indicate that due to various developmental activities in and around banks of Mula, Mutha and Pavana rivers the dominance of weed species are more common than natural vegetation. It clearly indicates the human activities influence in riverine vegetation. Some of earlier records (Vartak, 1957, 1961) show a mixed unique type of vegetation. Vegetation along the bank of rivers is slowly taken over by plants like, Alternanthera, Parthenium, Ludwigia, Amaranthus, etc. therefore slow growing species are replaced by above fast growing species or are replaced by other species.
As the rivers enter into urban influence, inflow of sewage helps to increase these nutrients, particularly phosphates, thereby increasing growth of plants. Species among plant, indicative of organic enrichment are Pistia stratiotes, Lemna perpusilla, Azolla pinnata, Amaranthus spinosus. These species are also found in large population in Mula, Mutha and Pavana rivers (Sangam Bridge, Dapodi, Aundh, Sangvi and Holkar Bridge). In addition once Eichhornia crassipes (water hyacinth) and Pistia stratiotes (water lettuce) were spread all over downstream and mainstream of Mula, Mutha and Pavana rivers. This again indicates that the river water is receiving plant nutrients for the luxuriant growth of the plant; the main source of the plant nutrient is obviously the city sewage. Similar observation has been reported by (Jafari et al., 2006; Gunale and Balakrishnan, 1981). Aquatic plant like Alternanthera denticulata or the alligator weed is fast spreading all over the river, especially in the shallow silted parts. This weed may prove to be another problematic weed in addition to water hyacinth. Besides, growth of floating forms like Leman requires special attention as far as conservation of river is concerned. Lemna forms a thick mat over the surface of water, cutting the entry of sunlight and the condition that are vitally important for the growth and survival of phytoplanktons. In addition to these the large amount of organic matter that is produced due to Lemna, Azolla and other small weeds are chocking the rivers and reducing dissolved oxygen contents.
CONCLUSIONS
In the aquatic ecosystem, nutrient concentrations are continuously affected by a wide range of physical, chemical and biological processes resulting in a dynamic water quality status. In case macrophytes are growing in the river, the vegetation induces substantial changes to the water quality. Some effects are owing to direct interactions, such as the uptake of nutrients, whereas others may be merely attributed to indirect effect of the water plants on hydrodynamics and/or sediment chemistry. In order to improve water quality by integrated management practices, a more profound understanding and further quantification of the interactions between the macrophytes and the aquatic system is indispensable.
A great deal of information is needed for biologists to predict the fate of aquatic macrophytes within the Pune city rivers. They will need to know where vegetation exists and the potential for unvegetated reaches to regain viable populations. Long-term monitoring of the distribution of plant beds is necessary to better understand the impact of various factors, whether they are anthropogenic in source or related to weather events such as droughts and floods. Additionally, studies are needed to determine the effects of the factors described above on the production and reproductive biology of macrophytes in Mula, Mutha and Pavana rivers.
REFERENCES
- Deng, H.B., H. Zhan-Qing, J. Ping and W. Qing-Li, 2000. Species frequency of communities alon northern slope of Changbai Mountain, Northeast China. J. Forest. Res., 11: 187-190.
CrossRefDirect Link - James, W.F., J.W. Barko and M.G. Butler, 2004. Shear stress and sediment resuspension in relation to submersed macrophyte biomass. Hydrobiologia, 515: 181-191.
Direct Link - Kantrud, H.A. and W.E. Newton, 1996. A test of vegetationrelated indicators of wetland quality in the prairie pothole region. J. Aqua. Ecosys. Health, 5: 177-191.
CrossRefDirect Link - Philippi, T.E., P.M. Dixon and B.E. Taylor, 1998. Detecting trends in species composition. Ecol. Applied, 8: 300-308.
CrossRefDirect Link - Sager, E.P.S., T.H. Whillans and M.G. Fox, 1998. Factors influencing the recovery of submersed macrophytes in four coastal marshes of lake Ontario. Wetlands, 18: 256-265.
Direct Link - Squires, L. and A.G.V. der Valk, 1992. Water-depth tolerances of the dominant emergent macrophytes of the Delta Marsh, Manitoba. Can. J. Bot., 70: 1860-1867.
Direct Link - Stromberg, J.C., 1993. Instream flow models for mixed deciduous riparian vegetation within a semiarid region. Regulated rivers. Res. Manage., 8: 225-235.
Direct Link - Van den Berg, M.S., M. Sheffer and H. Coops, 1998. The role of characean algae in the management of eutrophic shallow lakes. J. Phycol., 34: 750-756.
Direct Link