
Fawaz Alsaade
College of Computer Sciences and Information Technologies, King Faisal University, Al-Ahsa, Saudi Arabia
Asian Journal of Applied Sciences
Year: 2011 | Volume: 4 | Issue: 6 | Page No.: 618-629


ABSTRACT
Neoplasm classification and prediction is an important and challenging task. The main objective of this study was to propose an enhanced approach with features of data segmentation, data clustering and analysis in terms of cost factor and cross validation. The clinical data was collected and partitioned in some fixed size segments. Each segment was further decomposed in variant sized clusters (larger and smaller) with application of cleansing data filter for specific data conversion and translation. These clusters were then passed through different combinations of network architectures. The selection of efficient architecture was based on degree of achievement for neoplasm classification (malignant and benign) and root mean square values (smaller value depicts feasible network). This study demonstrated an enhanced approach over granular diverse data clusters and elaborated the results with graphical simulation in differentials of active and cross validation cost factors against percentage of achievement. The classification and prediction was 100% for benign and 99.05% for malignant masses with least root mean square value of 0.017. The novelty of the proposed approach is that it demonstrated results at high degree of granularity and was quite suitable for analysis of any problem size. Overall, it provided an opportunity for further work to outperform as an enhanced scalable approach for neoplasm classification and prediction with neural network.
PDF Abstract XML References Citation
Received: January 08, 2011;
Accepted: April 02, 2011;
Published: June 29, 2011
How to cite this article
Fawaz Alsaade, 2011. An Enhanced Classification and Prediction of Neoplasm using Neural Network. Asian Journal of Applied Sciences, 4: 618-629.
DOI: 10.3923/ajaps.2011.618.629
URL: https://scialert.net/abstract/?doi=ajaps.2011.618.629
DOI: 10.3923/ajaps.2011.618.629
URL: https://scialert.net/abstract/?doi=ajaps.2011.618.629
INTRODUCTION
Voguet et al. (2009) noticed that patient's age and positive margins can be considered as predictive factors for residual tumor. Two expert centers conducted breast cancer test experiments involving 294 patients. A comparative analysis was carried between residual and non-residual tumors. It was identified that 202 patients has residual tumor keeping the clinical risk factors included. They concluded that positive margins on operative specimen with addition of younger age are some risk factors for this type of tumor. Internecine neoplasm proliferates over abutting areas and inducements the increase in annihilation in women. The woman breast is composes of major three components including milk producing glands, fatty tissues and blood vessels. There is another collection of immune cells that are small bean shaped and carry fluids. Internecine masses can harm these sensitive guard agents and further proliferating to other regions.
Application of Computer Aided Diagnostic (CAD) tools and methods brings healthy source of inspiration for espial of internecine carcinomas (Voguet et al., 2009). On an average, the CAD systems convert the laser signals into digital ones for processing by microprocessor. Some better comparisons can be made between mammograms obtained from conventional ways and CAD's.
More discursive focus can be made on specific regions (abuts of carcinoma cells). An interesting study of 84 cases phyllodes (Foxcroft et al., 2007) revealed 71 as benign, 5 as malignant and 8 borderlines. Ultrasound and mammography were termed being non specific. The study showed that accuracy is better analyzed in small carcinomas because larger ones need more sampling. It was further noticed that fibro-adenomas had to be reviewed using ultrasound. The antediluvian espial can better help the chances of recovery and focuses the need to develop some improved methodologies for espial and diagnosis (Akhtar et al., 2008). Several different techniques are being employed for espial of internecine masses. Among these, mammography is considered as a suitable approach for carcinoma espial. Also, there is a need to improve the contrivances both in terms of X-ray and mammography itself by enhancement of mammogram images.
Ultrasound is considered another suitable imaging approach for espial of those masses that can remain hidden in normal mammography techniques. Sonogram is a resulting picture produced recording the echoes (by application of high quality sound waves). There are some tinny calcium collections that may remain hidden from ultrasound, so this methodology may not be recommended in antediluvian or routine checking. Another enhanced approach is digital mammography in which the images are manipulated on computer systems instead of films. There is a trade-off between digital and normal mammography. Digitization can help in better understanding but does not guarantee the choicest solution.
A population based study of 356 patients concluded that tumor location is not an independent prognostic aspect leading to survival. Besides, some critical factors such as patient age, tumor size, central location, number of positive lymph nodes and histological type associate a major risk of death. It was revealed by experiments that location does not influence survival (Jayasinghe and Boyages, 2009). Hassouna et al. (2006) reported another interesting case study of 106 patients with age margin of 39.5 years and mean tumor size of 83 mm. The study revealed the comparative difference of prognosis and treatment for phyllodes. Overall, 82 patients were treated using conservative and 24 by radical surgery. During the observation, 8 patients developed metastases and it was recommended that malignant phyllodes tumors for a simple mastectomy and wide excision for benign and borderline. Mohamad et al. (2009a) proposed a two stage gene selection method. This selection method selects a smaller subset of useful gene. The automatic yield of this smaller gene is a result of application of filters that perform some kind of pre-selection. Further optimization was made through multi-objective integrated method. They tested the phenomenon with three different datasets of gene expression data. The approach was applicable to micro-array gene expression datasets that can estimate the degree of comparison between cancerous and normal sets. Mohamad et al. (2009b) highlighted the problems in micro-array data analysis and comparison between cancerous and normal cells. The proposed approach overcame all the hurdles (removal of noisy data, irrelevant gene data etc.) in order to select a nice smaller subset of dataset for cancer classification. Basically, the approach is a cyclic hybrid technique. Authors have used five real time datasets to test the mechanism. Mohamad et al. (2010) proposed a three stage method for selection of information genes to classify cancer. The problem highlighted is the selection of set of disease genes from some huge amount of genetic data over micro-array. The proposed method comprises of initial selection by a filter technique, implementation of an integrated method for optimization and frequency analysis of gene appearance in diverse near optimal genetic subsets. This contribution helps classifier to accurately classify the patterns. A critical review of literature indicated that the information on the classification and prediction of neoplasm using neural network is inadequate. Therefore, the main objective of present investigation was to propose an enhanced approach for classification and prediction of neoplasm using neural network.
THE PROPOSED ENHANCED APPROACH
Neoplasm classification and prediction were proposed with the help of neural network with prior data segmentation and purification and the selection of best parameters for a feasible network. The proposed approach in this study was composed of the following tasks.
| • | Purification and segmentation |
| • | Development of feasible network architecture |
| • | Neoplasm classification |
| • | Neoplasm prediction |
| • | Flexibility |
The context of development of a network from a pool of choices in allowable feasible range is very important factor for approaching optimum results. This extreme optimal solution is worthless without adding flavors of best clustering, cleansing and scalability.
PURIFICATION AND SEGMENTATION
This stage of analysis contains the following points.
| • | Data gathering |
| • | Purification/cleanliness |
| • | Textual to numeric conversion |
| • | Data integration |
| • | Segmentation/clustering |
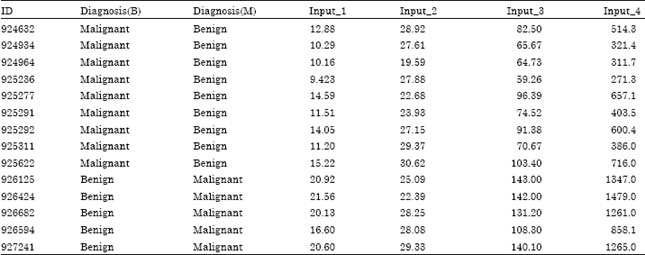
The neoplasm datasets contain clinical data in terms of parameters Diagnosis, Radius, Texture, Perimeter, Area, Smoothness, Compactness, Concavity, Concave Points, Symmetry, Fractal Dimension, Single Epithelial Radius, Single Epithelial Texture, Single Epithelial Perimeter, Single Epithelial Area, Single Epithelial Smoothness, Single Epithelial Compactness, Worst Radius, Worst Texture, Worst Perimeter, Worst Area, Worst Smoothness, Worst Compactness, Worst Concavity, Worst Concave Points, Worst Symmetry and Worst Fractal Dimension described in Table 1.
On the other hand, Table 2 shows the snap of final shape of data after vital adjustments. This translation helped to achieve the objectives to better train the network system and better efficiency in terms of optimal solution. It also helped in reduction of overhead involved in automatic dataset translation by central process. As a result of this translation, complex architectures were avoided by selecting simpler and smart combinations with less number of layers and neurons.
The segmentation phase clustered the dataset in random clusters for training and testing the selected choices of combinations. Figure 1 describes the segmentation of datasets for neoplasm training and testing at random sub-sets. Dataset were fragmented into four chunks of unequal lengths. Each neoplasm segment contained four clusters and each cluster contained four sub-clusters. One larger cluster was chosen with a smaller cluster for neoplasm training architecture, while another larger and smaller for testing. This combination of sub-systems guaranteed the optimal solution of the study approach.
DEVELOPMENT OF FEASIBLE NETWORK ARCHITECTURE
Several combinations were generated to build, test and apply cluster suitability for this approach.
 | |
| Fig. 1: | Data clusters of neoplasm for training and testing |
| Table 1: | Neoplasm dataset |
 | |
| Table 2: | Purified dataset |
 | |
Since the neural network requires training over specimen datasets, variant combinations were fed by thresh holding hidden layers with different neurons. Only those architectures were listed that provided the most significant value for root Mean Square Error (MSE). The selected architectures are described in Table 3.
Table 3 describes 8 cases representing random number of sigmoid layers with different neurons at each layer. It can be observed that with increasing hidden layers and number of neurons on these specified layers, the root mean square value also increased and decreased with the decrease in number of hidden layers and an increase in neurons.
| Table 3: | Random combination of layers with neurons against MSE |
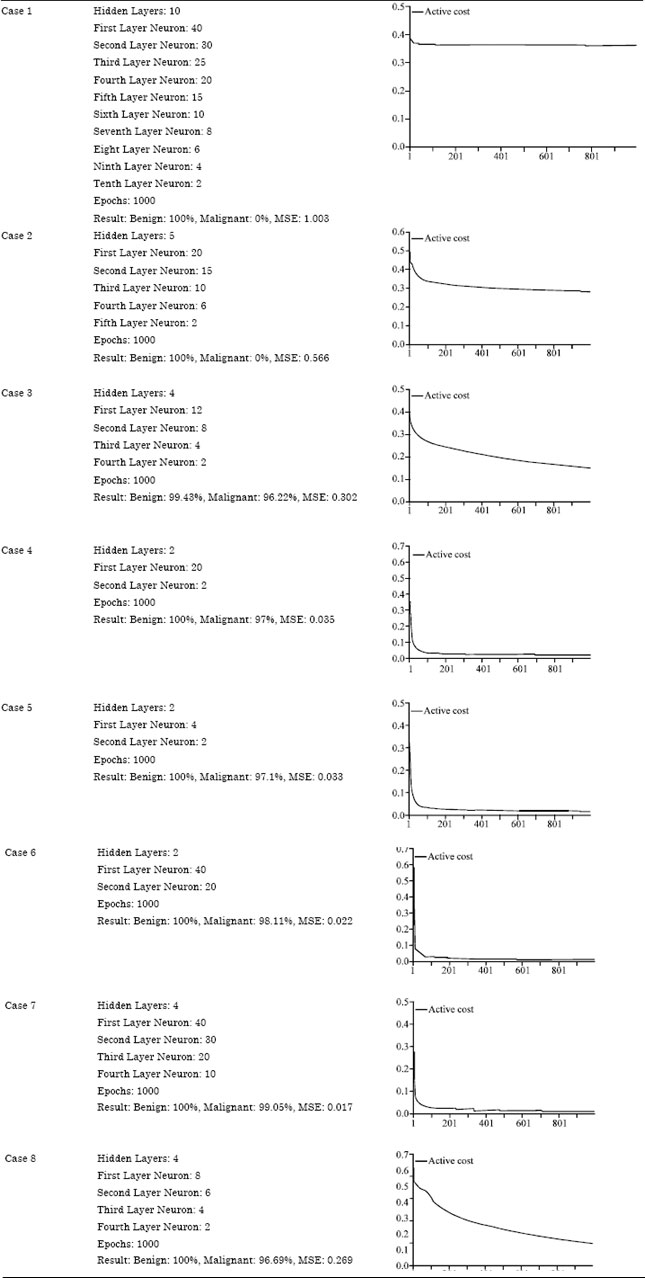 | |
Based on this, it was concluded that case 7 is the chosen architecture over specified clusters of datasets.
NEOPLASM CLASSIFICATION
With the selection of smart and efficient network, the training and cross validation of clusters were performed. For instance, Fig. 2 demonstrates that confusion matrix provided 96% of Internecine and 99.45% of benign diagnosis. The diagonal values from left to right (upper to lower) present numerals for benign and malignant confusion, respectively while numeral from right to left (upper to lower) depict corresponding errors values in training combinations of larger with smaller clusters.
Figure 3 describes the cross validation confusion matrix values. It is evident that Malignancy in cluster datasets was 100% and the benign ratio was 97.64%. The diagonal errors prune to be 2% for benign clusters and 0% for malignant chunks. However, a slight variation was noticed in numerical values for the chosen architecture against classification phenomenon. This might be due to minute difference in size of clusters at network training and classification phases.
Figure 4 shows the depiction of rates of deviation of training and cross validation error values. There was a slight variation in Training (T) and Cross Validation (CV) at the start of classification and both curves behaved in same fashion after some 200 epochs. However, smaller differences in curves present best classification in clusters and demonstrated an optimal combination of sigmoid and neurons for T and CV.
 | |
| Fig. 2: | Training confusion matrix |
| Fig. 3: | Cross validation confusion matrix |
 | |
| Fig. 4: | Mean square error in T and CV |
On other hand, root mean square error value range is below 0.1 (an average value below 0.5 is considered suitable) which demonstrated very good classification over trained and tested clusters.
NEOPLASM PREDICTION
Contrary to classification, predictions were made over 20% larger and smaller data chunks and generalized the idea for rest of clusters as there was a slight variation (normally less than 0.5%) in cross validation over entire domain and selected regions. Mean Square Error (MSE) values for training and cross validation over prediction are presented in Fig. 5. An average cost of criterion for MSE is below 0.03 and 0.05 for CV. These results were very optimal for prediction phenomenon. This idea was generalized to cover not only similar clusters in same domain but also to cover diversity of clusters in other domains (larger and smaller).
Figure 6 shows training and cross validation curves which were similar in behavior after about 170 epochs and slightly different in range between 60 to 150 epochs. Both curves remained side by side starting from 0.5 and declined continuously ending similarly along the x-axis after 200 epochs. The MSE values were highly optimal and desired for prediction of neoplasm in clinical clustered datasets.
FLEXIBILITY
This enhanced approach for neoplasm classification and prediction is highly flexible and can be scaled to any problem size. Figure 7 presents the enhanced approach with flexibility feature to accommodate any problem size. The first rectangle “DS” represents neoplasm actual dataset with its length and complexity. Last small rectangles show segments containing larger and smaller clusters. Processing elements define neoplasm classification and prediction in terms of parameters established for this approach (cost factors, confusion matrices, training, testing and percentage of malignant and benign identification with cross validation).
 | |
| Fig. 5: | MSE values for prediction |
 | |
| Fig. 6: | Active cost of criterion for T and CV for prediction |
 | |
| Fig. 7: | Flexibility for classification and prediction |
This observation can be made on behalf of:
| • | Complexity of problem |
| • | Segmentation of larger datasets in smaller segments efficiently |
| • | Distribution of variant cluster to segments |
| • | Selection of best combination of architecture |
| • | Availability of vast choice of sigmoid layers and number of preceptorns |
| • | Any assignment between processing elements and clusters |
| • | Cross validation with multi view analysis of criterion |
| • | Assembly of chunks at time of need (if required according to nature of problem being addressed) |
RESULTS AND DISCUSSION
Neoplasm classification and prediction with the help of dataset segmentation in the form of larger and smaller combinations of clusters were demonstrated with the help of discussions relating to cost factor, confusion matrix percentage, percentage of training data for cross validation and training. The study opted the way to categorize larger sets into segments of equal length with unequal number of cluster of datasets. The different combinations helped better to visualize neoplasm classification and prediction in terms of graphical presentation of cost factors and confusion matrices. This small scale testing and validation can be extended to any number of datasets with diverse number of segments and clusters (scalabilit y factor of this enhanced mechanism). Table 4 demonstrates the cost factor values against variant combinations of clusters for training and testing datasets. It is clear that with the increase of cross validation and training datasets, a good percentage for malignant and benign neoplasm categorization could be expected in terms of cost factor shown graphically. This percentage fell down with lowering the clusters for T and CV. All cases demonstrated feasible values of RMSE, because efficient calculations were performed in the selection of optimal network architecture from a pool of larger and smaller clusters of data. Similar work was carried by Chen et al. (2002) who diagnosed the breast tumor using a combination of neural network approach and wavelet transform. The segmentation algorithm takes advantage from some features such as variance contrast, distribution distortion and auto correlation contrast. The sonograms were analyzed using multilevel preceptors.
| Table 4: | Diversity in cases for cost factor against combinations of clusters |
 | |
These network approaches were tested and evaluated using 242 cases with k-fold cross validation for evaluation of performance. Also, Meinel (2005) developed computer-aided diagnostic system for breast mri lesion classification This investigation views also agree those of Wang et al. (2010) who described a tumor classification method using probabilistic neural network classifier with neighborhood rough set based gene reduction. It is also important to concentrate the problems addressed in high concentration and small size of samples in datasets. An iterative search model algorithm was used for selection of initial set. Minimum gene subset was found by refinement of this initial set. Ensemble classifier was constructed by using majority voting strategy. The cross validation of results were made on single biomedical experiment.
Table 5 presents different combinations of larger and smaller sized clusters with corresponding axon output values. Cluster 1 with data range (training and testing) 10, 10 is more closely packed. The RMS value starts from 0.9 and fluctuates between 0.9 and 0.2. The major area of fluctuation is between 0.2 and 0.6. It represents an average error value for output axon. Case 2 shows the same phenomenon between some 0.7 and 0.1.
| Table 5: | Cluster range with output axon demonstration |
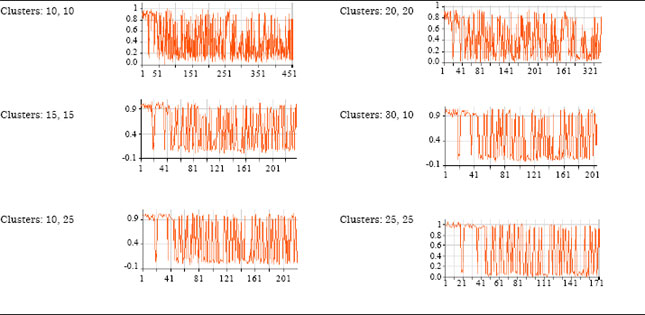 | |
Cases 3, 4 and 5 are almost similar with slight variations. Case 6 is another depiction of case 1 and 2. Generally it was observed that the average number of clusters (combination of both larger and smaller) for training and cross validation provide more optimal solution for both classification and prediction of neoplasm.
CONCLUSIONS
Computer aided tools and technologies play an important role in multi dimensional analysis of important biological data. This investigation addressed a challenging problem for classification and prediction of neoplasm in differentials of data segmentation and clustering. The results obtained in this process highlighted this as an enhanced and scalable approach with high level conceptual granularity. Instead of performing a whole analysis, the clinical data was segmented in variant clusters housed in equal sized chunks. Each segment was analyzed in parametric presentation of degree of prediction with appropriate selection of best neural combination concentrating features of cross validation, root mean square errors, active and confusion matrices. The enhanced approach obtained 100% results for benign and 99.5% for malignant with least feasible RMS value 0.017. The proposed enhanced approach was elaborated in detail with textual, experimental and graphical details with an added scalable feature of its applicability for any problem size and complexity.
REFERENCES
- Akhtar, M., J. Epps and E. Ambikairajah, 2008. Signal processing in sequence analysis: Advances in eukaryotic gene prediction. IEEE J. Selected Topics Signal Process., 2: 310-321.
CrossRef - Chen, D.R., R.F. Chang, W.J. Kuo, M.C. Chen and Y.U.L. Huang, 2002. Diagnosis of breast tumors with sonographic texture analysis using wavelet transform and neural networks. Ultrasound Med. Biol., 28: 1301-1310.
CrossRefDirect Link - Foxcroft, L.M., E.B. Evans and A.J. Porter, 2007. Difficulties in the pre-operative diagnosis of phyllodes tumours of the breast: A study of 84 cases. Breast, 16: 27-37.
CrossRefDirect Link - Hassouna, J.B., T. Damak, A. Gamoudi, R. Chargui and F. Khomsi et al., 2006. Phyllodes tumors of the breast: A case series of 106 patients. Am. J. Surg., 192: 141-147.
CrossRefDirect Link - Jayasinghe, U.W. and J. Boyages, 2009. Tumour location is not an independent prognostic factor for survival following a diagnosis of breast cancer. Breast, 18: 41-46.
CrossRefDirect Link - Voguet, L., T. Hebert, J. Leveque, O. Acker and H. Mesbah et al., 2009. Patient age and positive margins are predictive factors of residual tumor on mastectomy specimen after conservative treatment for breast cancer. Breast, 18: 233-237.
CrossRef - Wang, S.L., X. Li, S. Zhang, J. Gui and D.S. Huang, 2010. Tumor classification by combining PNN classifier ensemble with neighborhood rough set based gene reduction. Comput. Biol. Med., 40: 179-189.
CrossRef