
E.U. Onweremadu
Department of Soil Science and Technology, Federal University of Technology, P.M.B. 1526, Owerri, Nigeria
Trends in Applied Sciences Research
Year: 2008 | Volume: 3 | Issue: 1 | Page No.: 83-89


ABSTRACT
Soil Quality Morphological Index (SQMI) was used to assess soil health of arable farms on soils along Otamiri River in Owerri, Nigeria. Sampled points were identified based on physiography and linked using a transect. Three minipedons were dug at equal inter-minipedal distance of 35 m and sampled. Results showed that soils on a levee had the best quality (SQMI = 3.52), followed by Terace (SQMI = 2.83), Backswamp (SQMI = 2.75) and least in Upland soils (SQMI = 2.64). Soil quality had a good relationship with organic matter (r = 0.92; r2 = 0.84; 1-r2 = 0.16; p = 0.05). Results of soil properties were used to classify soils of the site as Isohyperthermic Ruptic-Alfic Dystrudepts (USDA Soil Taxonomy).
PDF Abstract XML References Citation
How to cite this article
E.U. Onweremadu, 2008. Application of Soil Quality Morphological Index in Assessing Soil Health of a Floodplain. Trends in Applied Sciences Research, 3: 83-89.
URL: https://scialert.net/abstract/?doi=tasr.2008.83.89
URL: https://scialert.net/abstract/?doi=tasr.2008.83.89
INTRODUCTION
Soil degradation has been a topical issue in Nigeria in general and Southeastern Nigeria in particular, especially among arable farmers, nomads, environmentalists, government and the general public. Pimental et al. (1995) stated that soil and environmental degradation poses a potential threat to global supplies over a long term. Soil degradation appears in form of crusting, compaction, sealing, impeded drainage, waterlogging, reduced waterholding capacity, infiltration, salinization, acidification, nutrient leaching, depletion in organic matter, decline in species composition and decline in biodiversity (Scherr and Yadav, 1996). Major causes of soil degradation include deforestation, burning of vegetation, increasing intensity of farming, tillage practices, low input agriculture, accelerated erosion by water and wind, road building and other construction works (Lal and Okigbo, 1990).
Soil degradation negatively influences the capacity of soil to function. These losses attached to soil degradation have sparked off interest in the concept of soil quality and its assessment (Karlen et al., 2001). The growing awareness that soil is an important component of the earth’s biosphere especially in the production of food and fiber (Doran and Parkin, 1994) has caused researchers to attempt definitions of soil quality (Seybold et al., 1998; Brady and Weil, 1999). Seybold et al. (1998) used the word dynamic soil quality which they defined in terms of human use and management on soil functions. Brady and Weil (1999) referred to soil quality as the capacity of a soil to function within its ecosystem boundaries to sustain biological productivity and diversity, maintain environmental quality and promote plant and animal life.
The relevance of soil quality in its capacity to function in several purposes calls for its quantitative assessment using reliable indices. Such indices must be dependent on the complex interactions of a number of processes and properties (Doran and Parkin, 1994). Such indices include soil management assessment framework (Andrews, 1998), soil quality index for erosivity (Brady and Weil, 1999), soil quality morphological index (Grossman et al., 2001; Seybold et al., 2004) and the additive index (Andrews et al., 2004).
This study used the soil quality morphological index (SQMI) due to the simplicity of the model.
The SQMI provides a relative ranking of optimal physical conditions for root growth and development and free movement of water and air in the pedosphere. The index is determined from near-surface soil properties to a depth of 30 cm or to a restrictive layer if shallower (Seybold et al., 2004). It combines information from soil texture, soil structure, soil consistence, dry crust strength and thickness and surface connected macropores and cracks (Grossman et al., 2001). The index was developed out of the need to characterize the near-surface attributes in detail for soil survey and to evaluate soil quality in the field using soil morphology. In this index, the higher the value, the better the soil quality (Seybold et al., 2004). Changes in near-surface soils due to land use and management are not substantially recognized in soil survey (Onweremadu, 2006) hence the need for this index in sustainable soil management for sustainable land use.
Based on the above, the major aim of this study was to evaluate soil quality of arable farms, using Soil Quality Morphological Index (SQMI) and relating it to organic matter which is often chosen as a reliable indicator of soil health in tropical soils.
MATERIALS AND METHODS
Location
The study site is the Otamiri River floodplain at Federal University of Technology, Owerri, Nigeria, lying between latitudes 5°20!05.210" and 5°25!21.120"N and longitudes 7°00! 11.120" and 7°05! 09.110"E. The altitude of the area is 54 m above mean sea level (Readings of Handheld Global Positioning System (GPS) Receiver (Garmin Ltd,. Kansas, USA). The main geological material (Benin formation) is Coastal Plain Sands, related to the Oligocene-Miocene era (Orajaka, 1975). However, the geology is influenced by fluvial depositions. It is within the lowland areas of Southeastern Nigeria (Ofomata, 1975). It is of the rainforest agroecology of the humid tropics characterized by heavy rainfall (Table 1) and mean monthly temperature ranging from 23.8 to 29.0°C (Table 2). Currently, agriculture is a major socio-economic activity in the study site with the Backswamp physiographic unit being influenced by annual flooding of the Otamiri River.
Field Studies
Four physiographic units, namely Backswamp, Levee, Terrace and Upland were identified. A transect was drawn to link all the land units in the area. A minipedon was sunk in each geomorphic unit and sampling done from the bottommost layer. An inter-minipedon distance of 35 m was maintained. Routine and standard physical parameters were used in the determination of values for the computation of soil quality morphological index (Brejda et al., 2000a, b; Grossman et al., 2001; Seybold et al., 2004). Soils were sampled at predetermined depths of 0-10, 10-20 and 20-30 cm (Grossman et al., 2001).
In addition to four minipedons, four pedons representing four physiographic units were dug and described. Soil samples were also collected and used in this study.
| Table 1: | Average rainfall (1995-2004) |
| Source: Owerri Meteorological Station, 10 years (1995-2004) | |
| Table 2: | Average temperature (°C) (1995-2004) |
| Source: Owerri Meteorological Station, 10 years (1995-2004) | |
| Table 3: | Texture-weighting class criteria for SQMI (Source:Seybold et al., 2004) |
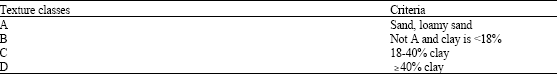 | |
| Table 4: | Criteria for placement of structure class in the soil quality morphological index (Source: Seybold et al.,2004) |
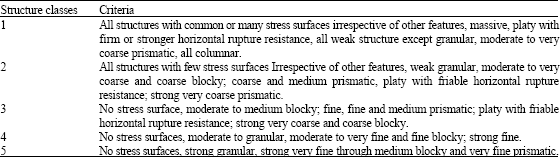 | |
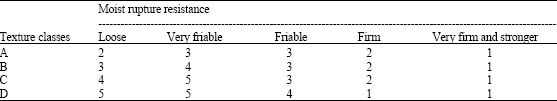
| Table 5: | Rupture-resistance classes for the soil quality morphological index (Source:Seybold et al.,2004) |
 | |
Computation of Field Data
Soil quality morphological index was computed using the following formula:
SQMI = (4 SRI0-10 + 2 SRI10-20 + SRI 20-30) 7
Where,
| SRI | = | Structure-rupture resistance |
| 4, 2 and 7 | = | Weighting factors |
In SQMI computations, three main attributes namely texture-weighting class (Table 3), soil structure (Table 4) and rupture-resistance class (Table 5) were used to describe each layer according to the procedure of Grossman et al. (2001). The soil texture was used to determine the relative weight of soil structure and class placement for rupture resistance. Soil structural attributes of type, grade and size are judged to function similarly while rupture resistance was assessed by combining the texture weighting and moist ruptureBresistance in the field. The determined structure and rupture resistance classes were integrated into an index class of Structure-Resistance (SRI) for each soil layer. The SRI class was adjusted for the effects of crusts and surface-connected macrospores (Grossman et al., 2001).
Laboratory Analyses
Particle size distribution was determined by hydrometer method according to the procedure of Gee and Or (2002). Soil pH was measured potentiometrically in 0.1 N KCl using a soil: liquid ratio of 1:2.5 (Hendershot et al., 1993). Exchangeable cations were measured by the method described by Thomas (1982) and summation of cations gave the Cation Exchange Capacity (CEC). Base saturation was estimated as a sum of exchangeable basic cations divided by CEC and multiplied by 100%. Organic carbon was measured by Walkley and Black Wet digestion method (Nelson and Sommers, 1982). Values of organic carbon were multiplied by a factor of 1.724 to obtain organic matter.
Statistical Analysis
Average values of organic matter from soils sampled from minipedons were correlated with values of SQMI using SAS computer package (Little et al., 1996).
RESULTS AND DISCUSSION
Soil Properties and Classification
Soils were sandy, acidic and moderately basic. Base saturation which is a major criterion in the determination of soil taxonomy ranged from 35-52%. Organic matter was low (0.03-3.75%) and decreased. Based on climatic data, soils were classified according to the procedure of soil taxonomy (Anonymous, 2003) as shown in Table 6. In a similar environment, Igwe (2001) characterized and classified its soils as Entisols (USDA Soil Taxonomy) and Fluvisols and Gleysols (FAO System) These differences could be as a result variability in fluvial influences as River Niger is a bigger body of water compared with Otamiri River. The agronomic implication of this is that crops should be subsisting on external inputs for sustainable growth and development in the site as soils are not properly formed. Although soils were deep, (greater than 150 cm) they were too sandy with very low organic matter and granular which affects mechanical function of soils.
Soil Quality
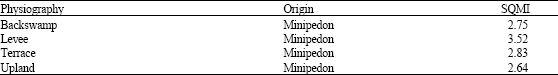
Soils on the levee have best quality having the highest index value (SQMI = 3.52), followed by those on a terrace and least being those of upland. These results show that soils on the levee have least physical limitations for root growth, development and performance as well ad in the soils’ ability to draw nutrients, air and water in the pedosphere (Table 7). It implies that soils of the levee have the best soil physical fertility which according to Eneje et al. (2005) is necessary for sustaining long-term crop production. This could be through its influences on water status, workability, resistance to erosion and nutrient availability (Piccolo and Mbagwu, 1999).
| Table 6: | Soil properties |
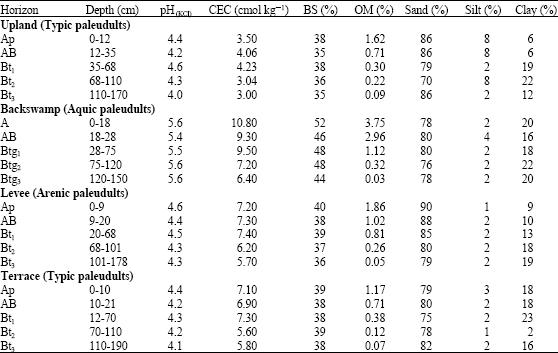 | |
| CEC = Cation Exchange Capacity, BS = Base Saturation, OM = Organic Matter | |
| Table 7: | Soil quality morphological index (SQMI) values |
 | |
| Table 8: | Relationship between SQMI and SOM |
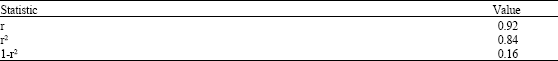 | |
| p = 0.05, n = 9 | |
Low values of CEC, Organic matter and sandiness as recorded in this study are consistent with the findings of Oti (2007). Although, Igwe (2001) recorded high organic matter in the floodplain soils of the Niger Delta, (Nigeria), low organic matter content of soils of the study site is attributable to land use. Soils of the study is under high demographic pressure arising from a combination of farming, residential and engineering activities in the area. As a consequence of the above, floodplain vegetation is highly depleted, thereby exposing soil organic matter to rapid mineralization processes and other pedogenic processes of loss, such as leaching and soil erosion. In the light of this, Onweremadu et al. (2006) conducted reclamation studies in the area in an attempt to improve the physical quality of soils.
Field studies indicated that soils were redder away form the floodplain and more stable in this colouration, implying that upland soils may have undergone longer pedogenesis (Torrent et al., 1980). The influence of Otamiri River via annual overflowing of its banks negatively affects the physical properties of soils of the backswamp, hence its low SQMI values. The low SQMI value of the upland soils was possibly aggravated by the anthropogenic activities ranging from farming and construction activities.
Soil quality morphological index values were correlated with organic matter at a probability level of 5% and the result shows significant positive correlation coefficient (r = 0.92; p = 0.05; n = 9) (Table 8). There was also a very good relationship between SQMI values and soil organic matter (r2 = 0.84; p = 0.05; n = 9). Soil organic matter is regarded as a very reliable and important soil quality parameter (Gregorich et al., 1994). If organic matter has correlated well with SQMI, it implies that both are good indicators of soil health status.
CONCLUSIONS
Soils of the study site are sandy, acidic and of low organic matter. Base saturation values were generally low with pronounced argillation hence classified as Ultisols.
Soils on a levee had the best quality while least soil quality in the site was recorded in upland soils using the SQMI. Describing soil structure and rupture-resistance is subjective but requires broad knowledge on soil morphology for a good assessment. Nonetheless SQMI correlated significantly and positively with soil organic matter.. It is suggested that other indices, such as index of reddiness be used for assessing soil quality in the study area in further studies.
REFERENCES
- Gregorich, E.G., C.M. Monreal, M.R. Carter, D.A. Angers and B.H. Ellert, 1994. Towards a minimum data set to assess soil organic matter quality in agricultural soils. Can. J. Soil Sci., 74: 367-385.
CrossRefDirect Link - Nelson, D.W. and L.E. Sommers, 1983. Total Carbon, Organic Carbon and Organic Matter. In: Methods of Soil Analysis, Part 2: Chemical and Microbiological Properties Page, A.L., R.H. Miller and D.R. Keeney (Eds.)., 2nd Edn., ASA and SSSA, Madison, WI., USA, pp: 539-579.
CrossRefDirect Link - Brady, N.C. and R.R. Weil, 1999. The Nature and Properties of Soils. 12th Edn., Prentice Hall, New Jersey, USA, ISBN: 9780138524449, Pages: 881.
Direct Link - Onweremadu, E.U., C.C. Opara, U. Nkwopara, C.I. Duruigbo and I.I. Ibeawuchi, 2006. Yield response of a cowpea variety on ground seashells on Isohyperthermic Arenic Kandiudult of Owerri, Southeastern Nigeria. Int. J. Soil Sci., 1: 251-257.
Direct Link - Brejda, J.J., T.B. Moorman, D.L. Karlen and T.H. Dao, 2000. Identification of region soils factors and indications: 1. Central and Southern High Plains. Soil Sci. Soc. Am. J., 64: 2115-2124.
Direct Link - Oti, N.N., 2007. An assessment of fallows as a natural strategy to restore erosion degraded lands. Int. J. Agric. Rural Dev., 9: 22-29.
Direct Link - Eneje, R.C., C.V. Ogbonna and B.O. Nuga, 2005. Saturated hydraulic conductivity water-stable aggregates and soil organic matter in a sandy loam soil of Isikwuato LGA of Abia State. Agro-Sci., 4: 34-37.
Direct Link - Piccolo, A. and J.S.C. Mbagwu, 1999. Role of hydrophobic components of soil organic matter in soil aggregate stability. Soil Sci. Soc. Am. J., 63: 1801-1810.
CrossRef - Pimentel, D., C. Harvey, P. Resosudarmo, K. Sinclair and D Kurz et al., 1995. Environmental and economic costs of soil erosion and conservation benefits. Science, 267: 1117-1123.
CrossRefDirect Link - Grossman, R.B., D.S. Harms, C.A. Seybold and J.E. Herrick, 2001. Coupling use dependent and use invariant Ant data for soil quality evaluation in the United States. J. Soil Water Conserv., 56: 63-68.
Direct Link - Igwe, C.A., 2001. Water-stable aggregates of Niger floodplain soils and their organic carbon, nitrogen and phosphorus distribution. Agron. Sci., 2: 52-61.
Direct Link - Karlen, D.L., S.S. Andrews and J.W. Doran, 2001. Soil quality: Current concepts and applications. Adv. Agron., 74: 1-40.
CrossRefDirect Link - Thomas, G.W., 1982. Exchangeable Cations. In: Methods of Soil Analysis, Page, A.L., R.H. Miller and D.R. Keeney (Eds.). ASA. and SSSA., Madison, WI., pp: 159-165.
Direct Link