
E.O. Nwaichi
Department of Biochemistry, Faculty of Sciences, University of Port Harcourt, P.M.B. 5323, Rivers State, Nigeria
M.A. Uzazobona
Department of Petroleum Engineering, Faculty of Engineering, University of Port Harcourt, P.M.B. 5323, Rivers State, Nigeria
Research Journal of Environmental Sciences
Year: 2011 | Volume: 5 | Issue: 6 | Page No.: 565-572


ABSTRACT
The level and distribution of CO2 and other associated potential contaminants at some flare sites in the Niger Delta were investigated to evaluate possible environmental characteristics. Two flowstations, Agbada 1 and 2 of Shell Petroleum Development Corporation were monitored while Eneka village with no history of gas flaring was introduced as control for comparison for a period of three months. At the Department of Petroleum Resources (DPR) recommended distance of 200 m away from flare stack, concentrations of contaminants were for CO 55 μg m-3, CO2 59.25 μg m-3, Ammonia 1 ppm, Particulates 0.8 μg m-3, sulphur dioxide 7.45 μg m-3 and nitrogen dioxide 16.3 μg m-3; Carbon monoxide 11.2 μg m-3, Carbon dioxide 69.05 μg m-3, Ammonia 1 ppm, Particulates 0.85 μg m-3, sulphur dioxide 24.2 μg m-3 and nitrogen dioxide 37.3 μg m-3; and Carbon monoxide 5.71 μg m-3, Carbon dioxide 5.54 μg m-3, Ammonia 1 ppm, Particulates 1.26 μg m-3, sulphur dioxide <0.01 μg m-3 and nitrogen dioxide <0.01 μg m-3 for Agbada 1 flowstation, Agbada 2 flowstation and Eneka village, respectively. The rainwater characteristics of the monitoring zones were also evaluated as core component of air quality and results gave acidic pH and significant bicarbonate levels showing CO2 emission activities. DPR and Federal Ministry of Environment set limits were also employed at assessment of flaring activities alongside the control study area. The findings suggest that the flaring activities at Agbada 1 and 2 flowstations significantly impacted on the environment via emissions and thus require mitigation measures to avert inherent biomagnifications with time.
PDF Abstract XML References Citation
Received: February 25, 2011;
Accepted: March 19, 2011;
Published: May 27, 2011
How to cite this article
E.O. Nwaichi and M.A. Uzazobona, 2011. Estimation of the CO2 Level due to Gas Flaring in the Niger Delta. Research Journal of Environmental Sciences, 5: 565-572.
DOI: 10.3923/rjes.2011.565.572
URL: https://scialert.net/abstract/?doi=rjes.2011.565.572
DOI: 10.3923/rjes.2011.565.572
URL: https://scialert.net/abstract/?doi=rjes.2011.565.572
INTRODUCTION
As the international community is debating issues related to climate change, clean energy and sustainable development, how important is it to address gas flaring reduction around the world (400 MT CO2 Eq year-1). In the World Energy Outlook 2006, CO2 emissions (Jacob, 1999; Le Treut et al., 2007; Gholizadeh and Darand, 2009) will increase from 26 billion tonnes a year in 2004 to 40 billion tonnes in 2030. Even including policies only under consideration, not committed to, only lowers CO2 emissions 16% (Muis et al., 2010; Narayanan and Natarajan, 2006) below the Baseline level in 2030. This need not be the outcome and it is not expected that it will be the outcome but, at present, it is the current path. Most of the known matter that is destroying the earth’s ozone (Chevron, 2010) layer and contributing to global warming is derived from manmade compounds and chemicals with high Global Warming Potential (GWP) and commonly known as Greenhouse Gases (GHGs). Greenhouse gases are gases in an atmosphere that absorb and emit radiation within the thermal infrared range. This process is the fundamental cause of the greenhouse effect (OPEC, 2004; Masarie and Tans, 1995). Gas flaring is the process of burning off unwanted hydrocarbons during various production operations such as when oil wells are tested and prepared for production and this produces toxic gases (Archer, 2005; Canadell et al., 2007), such as soot, acid rain and noise. This is done through the aid of gas flaring stack. However, in many fields in Nigeria, routine gas flaring continues even during production life of the field. The foremost move to stop gas flaring from the routine oil production operations dates back to the earliest laws regulating the oil industry in Nigeria. The petroleum Act of 1969 (regulations) section 42 came into being and with no serious progress made towards extinguishing flare, the introduction of penalties as disincentive for flaring gas began. These pollutants can involve a deterioration (Beerling and Berner, 2005; Elaigwu et al., 2007) of the quality of the air on the local plan but also on the regional scales and international, particularly with certain hydrocarbons which are at the origin of the photochemical oxidant formation when certain weather conditions are joined together. A quantitative estimate of this pollution can be realized by carrying out an inventory detailed on the level of the entire sector.
Air pollution can be defined as the emission into the atmosphere of a waste gas stream containing one or more pollutants such as dust, gases and fumes in concentrations sufficient to be injurious to humans, plants or animal’s health or to affect property values adversely. Of course, a pollutant is a substance present in greater than natural concentration as a result of human activity and which has a net detrimental effect upon its environment or upon something of value in that environment. Particulate matter is a perpetrator of human diseases (Pope and Dockery, 2006; USEPA, 2004). Exposure to air pollution and automobile traffic has been shown to trigger myocardial ischaemia (Pekkanen et al., 2002; Gold et al., 2005).
Emissions can be divided into two main classes- particulates and gases. For the purposes of this project, gaseous pollutants, particularly the carbon monoxide and carbon dioxide will be of major concern.Therefore, basic objective of this study is gives as:
| • | To monitor the proportion of CO2 released into the atmosphere from flared gas as well as associated contaminants due to flaring |
| • | To investigate compliance of CO2, CO and associated contaminants with the Department of Petroleum Resources Environmental Guidelines and Standards for the petroleum industry and other relevant standards |
MATERIALS AND METHODS
Sampling/monitoring points: This was carried out at the following designated points:
| • | About 60 m from the flare tip along the flare gas pipe prior to the tip |
| • | Two hundred meters away from the flare point along the direction of the prevailing wind |
Air quality sampling: Air quality samples were taken in the windward direction of the project locations for in-situ determination of the CO2, NOx, SOx, NH3, CO, H2S and VOC parameters of the ambient air characteristics using hand-held (environmental sensor meters) air quality monitoring equipment while SPM was determined using high volume sampler. They are digital meters which read parameters at a time-weighted average. Rain water monitoring is a composite measurement to air quality monitoring hence the sampling.
Meteorology: Hand held SKYWACH GEOS high precision weather station was used for data collection. Heat radiation was measured with a pyranometer produced and supplied by Kipp and Zonen B. V of Rontgenweg in Holland. The sensor of the instrument was focused on the flare for five minutes to record radiation at one minute interval. The mean reading taken over the exposure time was recorded as the heat radiation. The relative smoke density was measured by using a Ringlemann smoke chart prescribed by The British Standard Institute (BS 2742: 1969). It involves visual comparison of the density of the smoke as it leaves the flare tip with the charts standard shades of grey to black on a scale of 0-4. The wind direction and speed were determined using Kestrel 4000 combined wind vane and anemometer. The anemometer reads wind speed in meters per second (m sec-1). The wind vane measured wind direction in compass directions as North, East, West and South and various combinations of directions. The ambient air temperature, pressure and relative humidity were measured at the designated point using the Kestrel 4000 equipment. The temperature was read in °F and converted to °C, pressure in mm Hg-1 and relative humidity in percent. A combination of wind direction and wind speed at each station was brought into a scale of atmospheric turbulence in a vertical plane and quantified in terms of dispersion equations. These were categorized into a range of weather series ranging from A to F, where A represents unstable atmospheric conditions (storms) and F represents stable atmospheric conditions (calm weather). The readings of wind speeds and direction variations were used to compute the turbulence.
Sample collection, identification, measurement, transportation and storage: Air samples were collected and determined in-situ using electronic equipment for measurement of the various parameters. These were calibrated based on the manufacturer's recommendation before and after each batch of sampling. Back-up batteries powering electronic equipment were always at hand to give accurate and reliable readings. Carbondioxide (CO2), Carbon monoxide (CO), Nitrogen oxides (NOX), Sulphur oxides (SOx), Hydrogen sulphide (H2S) and Ozone (O3) were determined using in-situ specific meters produced and supplied by Environmental Sensors CO of Boca Raton in England. The meters were switched on at each sampling point for a period of thirty minutes and the mean values read and recorded. A Varian gas chromatograph (Varian Aerograph series 3700) fitted with a Flame Ionization Detector (FID) was used in the hydrocarbon analysis in line with ASTM methods. The method of determination for suspended particulate matter is essentially a modification of the United States Environmental Protection Agency’s (USEPA) Hi-volume Gravimetric method (1990) (Nwaichi, 2010). The glass fiber used for the SPM calculations was digested and used for heavy metal determinations on an AAS. The noise levels at various distances were measured using a pre-calibrated Delta Ohm sound level meter model HD 8701. Analyses of samples were performed in triplicates and mean values reported.
Rain water samples from receptacles were subjected to in-situ measurements for pH, TDS, conductivity and temperature. A complete chain of custody was maintained and samples were also properly labeled with all relevant information duly registered in the laboratory notebook on arrival in the laboratory. Rainwater samples were equally transported in sealed coolers with ice chests and on arrival at the laboratory; they were stored in the refrigerator until required for analysis. DPR guidelines on withholding time series for each parameter were strictly adhered to.
Monitoring areas: Agbada 1 and 2 flowstations are located within Oil Mining License (OML) 17 concession areas in Rivers State of Nigeria. The areas are essentially dry land with poor drainage and as a result subjected to occasional flooding during the wet season. According to PEAH-1 District HSE case (SPDC-2005-0056915) revision 10, mean ambient temperatures range between 23 and 35°C with mean annual rainfall of 3800 mm. The facilities are accessible either by land or air.
Project description: Agbada gas lift compressor station, commissioned February 1993, was designed to receive HP/LP gas from the adjacent Agbada 2 flowstation and compress a maximum of 19.63 MMscfd (555,888 sm3 d-1) of natural gas to provide high-pressure gas for gas lift of a cluster of oil wells in Agbada field in order to enhance their production. The gas is also treated to a hydrocarbon and water dew point of 15°C at 75.9 barg before routing to the oil well to be gas-lifted. There is also a provision for future sales gas line connection to the discharge line. Wet gas from the 8” HP/LP gas headers of the adjacent Agbada 2 flowstation is routed through two suction lines to the gas compression station. LP gas is routed through the 12” suction line while the HP gas is routed through the 8” suction line. The HP gas pressure is reduced via a pressure controller and passed with the LP gas into the LP inlet scrubber where the first level of scrubbing is done. The gas is then directed to each of the two parallel compressor modules where it is compressed to the required injection pressure for gas lift of the nominated oil wells in the Agbada field. The two flowstations are chosen for their varying discharge potential.
Eneka monitoring area is sited within the Chiroda acquired area at a location in the outskirts of Port Harcourt city along Igwuruta/Eneka road. It lies on Latitude 22°E and Longitude 12°N. The area is located on plain land rain forest belt of Nigeria. There are naturally occurring vegetations around the surroundings a part of which has given way to agricultural activities. Eneka community is slightly metropolitan although communal life of the people seems intact with commercial trading and farming as their major occupation. This was chosen for a control owing to non-flaring activities within this zone.
RESULTS AND DISCUSSION
Among the three most important requirements (Air, water and food) needed to sustain life, air is the most important. Because of this important primary function of air, the need for access of clean air cannot be over-emphasized. Clean air volume consists of only gas molecules approximately 78.09% of Nitrogen, 20.94% of Oxygen, 0.95% of Argon and 0.03% of CO2. Presence of other molecules, therefore, constitute pollution. Carbon dioxide emissions from power plants and stationary industrial sources account for more than 60% of global greenhouse gas emissions. However, this CO2 can be captured and stored and if injected into depleting oil reservoirs, can increase recovery through an "Enhanced Oil Recovery" (EOR) process. Thus, CO2 capture and storage and EOR present opportunities for the oil industry to participate in activities that will substantially reduce emissions and in the case of EOR, increase the recovery from oil fields. Gas flaring, another source of greenhouse gas emissions, can be practically eliminated in oil field operations by utilization of the gas for re-injection, as fuel for power generation (Canadell et al., 2007) and/or for poverty reduction programmes that are focused on bringing modern energy supplies to the least developed areas of the world, consistent with the principles of sustainable development. Average value of 69.25 μg m-3 CO2 level observed for Agbada 1 did not differ significantly with 69.05 μg m-3 for Agbada 2 but gave a marked variation with 5.54 μg m-3 obtained for the Control point (Fig. 1) and further supports the findings of Archer (2005). Release of CO2 has potential to adversely affect the health and well-being of nearby organisms. Potential release of CO2 is colorless and odorless unless present at concentrations in excess of 40% which is lethal in a matter of minutes, is especially hazardous because CO2 is toxic (Jensen, 2007) to many mammals.
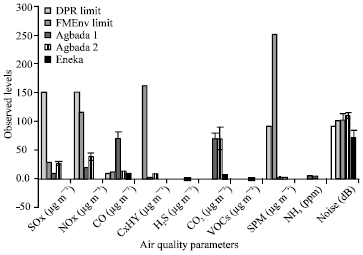 | |
| Fig. 1: | Average levels of air quality parameters monitored. Data represent Mean±SE at p≤0.05 |
Carbon-dioxide causes temporary hardness in water. The associated gas could be used to provide the basis of a successful petrochemicals industry as reported by Azar et al. (2006). Observed level of CO, a criteria air pollutant exceeded the set limits of 10 and 11.4 μg m-3 by the DPR and FMEnv, respectively. CO interferes with the blood's ability to carry oxygen to the body's tissues and results in numerous adverse health effects. SOx and NOx levels averaged 8.45, 17.3, 26.3 and 27.6 μg m-3 at Agbada 1 and 2, respectively. An extensive vegetation structure overlap was recorded at the various fields studied and this is in agreement with the findings of Olaleye et al. (2005).The levels observed for hydrocarbons fell below the detection limit of the analytical instrument at the Control point. Comparable levels of particulates recorded among all monitoring zones were well below set limits of 90 and 250 μg m-3 for DPR and FMEnv, respectively. Ammonia levels (Fig. 1) gave 2.5, 4 and 1 μg m-3 for Agbada 1, 2 and Eneka, respectively. Ammonia reacts with NOx to form ammonium nitrate a major PM 2.5 component in the Western United States. Recorded noise levels exceeded set limits for DPR and FMEnv except for the control (Fig. 1). The Agbada 1 and 2 flowstations location experienced stable to moderate air turbulence (F-D) (Table 1). At Agbada 1, air temperature was warm (35.80°C 200 m from flare to 38.3°C at the flare) whereas the relative humidity varied from 58.2% in front of generators to 70.2% in front of pumps. The ratio of the amount of water vapor in the air at a specific temperature to the maximum amount that the air could hold at that temperature, expressed as a percentage refers to relative humidity. Humans are sensitive to humid air because the human body uses evaporative cooling as the primary mechanism to regulate temperature. Under humid conditions, the rate at which perspiration evaporates on the skin is lower than it would be under arid conditions. Because humans perceive the rate of heat transfer from the body rather than temperature itself (Perry and Green, 1997), we feel warmer when the relative humidity is high than when it is low. High relative humidity, over 50%, encourages biological agents such as bacteria and viruses, house dust mites and molds-to grow and be released into the air. High humidity causes condensation on windows or windowsills and obvious mold growth or a mildew odor. Windiness varies and an average value for a given location does not alone indicate the amount of energy a wind turbine could produce there. To assess the climatology of wind speeds at a particular location, a probability distribution function is often fit to the observed data.
| Table 1: | Meteorological data from study sites |
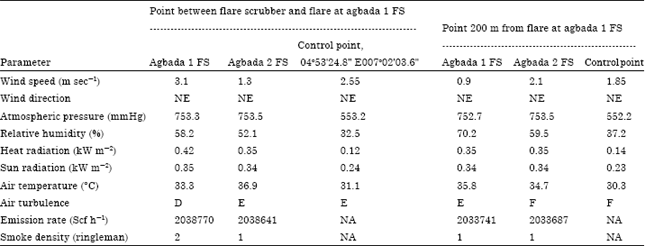 | |
| Values are average results, NA: Not applicable, NE: Northeast | |
Observed wind speed conformed to a two-parameter Weibull distribution modeled and they were predominantly Northeast. Higher power generates higher wind speed as evident in observed levels at the flowstations (Table 1). Atmospheric pressure is the total weight of the air above unit area at the point where the pressure is measured. Thus air pressure varies with location and time because the amount of air above the Earth's surface varies and is altitude dependent (States and Gardner, 2000). A range of 552.2 to 753.5 mmHg atmospheric pressure was maintained throughout the study period. The heat radiation values were slightly higher near the flare site because of the heat emanating from the flare. The solar radiation values ranged from 0.23-0.35 kW m-2 and were uniform in all sampling locations throughout the study period. The discharge temperatures from electric-power plants generally range from 5 to 11°C (EPA, 1998) above ambient temperature. Room temperature may otherwise be indicated by general human comfort, with the common range of 20 (68 oF) to 29°C (84°F), though people may become acclimatized to higher or lower temperatures. There was varied increased in air temperature between Agbada 1 and 2 (Table 1). The increased temperature accelerates chemical-biological processes and decreases the ability of the water to hold dissolved oxygen. Turbulence is often caused by the quick changes of pressure and air flow around a structure. Recorded values as indicated in Table 1 gave stable weather.
The rise in global temperature caused by the green house gases such as CO2 could lead to the addition of heat to the surface waters which subsequently increases the receiving water temperature; the implication of this is that the numbers and kinds of species found in aquatic environment will change. It can even result in a “heat banner” in a water way; that will prevent migration of fish to their spawning grounds. Emission rate (The weight of a pollutant emitted per unit of time (e.g., tons year-1) between the two facilities were statistically insignificant. Rainwater characteristics (Fig. 2) for Agbada 1 and 2 FS gave acidic ranges of 6.35 to 6.48 as shown in Fig. 2 and is in agreement with the findings of Le Treut et al. (2007). These values are below regulatory limits for DPR and FMEnv (6.50-9.20). Thesemay be formed by the combination ofnitrogen and sulfur oxides with water vapor in the atmosphere. The concentrations of heavy metals in the rain samples for all the facilities covered were less than 0.001 mg L-1 and fell below the detection limit of the analytical instrument used. Most rainwater properties however, were within acceptable ranges.
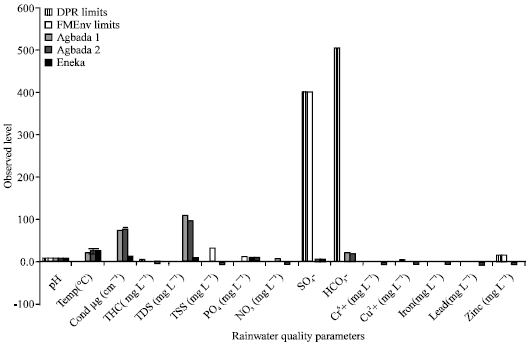 | |
| Fig. 2: | Average levels of rainwater quality parameters monitored. Data represent Mean±SE at p≤0.05 |
The fight against this air pollution requires a rigorous program of maintenance of the various installations and a monitoring of ambient pollution on the various production sites, of treatment and storage of hydrocarbons to detect all excessive emissions.
CONCLUSION
From the reported study, CO2, CO and associated air pollutants gave significant and more or less worrisome concentrations at the choice sites evident in recorded values in comparison to the Control site and reference regulatory set standard. Further 200 m distance from flare stack did not show statistically significant difference in terms of emissions and risk of death from carbon dioxide poisoning could threaten if there are no interventions. Airborne pollutants, such as gases, chemicals, smoke particles and other substances, reduce the value of and ability to enjoy affected property and cause significant health and environmental problems. Mandatory carbon emissions reporting will definitely lower the greenhouse gas emissions in Nigeria. Hazard evaluation consisting in comparing measurements of exposure (or dose) with exposures (doses) known to be safe or known to be hazardous is therefore pertinent.
REFERENCES
- Archer, D., 2005. Fate of fossil fuel CO2 in geologic time. J. Geophys. Res., 110: 1-6.
CrossRefDirect Link - Azar, C., K. Lindgren, E.D. Larson and K. Mollersten, 2006. Carbon capture and storage from fossil fuels and biomass: Costs and potential role in stabilising the atmosphere. Climatic Change, 74: 47-79.
Direct Link - Beerling, D.J. and R.A. Berner, 2005. Feedbacks and the coevolution of plants and atmospheric CO2. Proc. Natl. Acad. Sci. USA., 102: 1302-1305.
CrossRefDirect Link - Canadell, J.G., C. Le Quere, M.R. Raupach, C.B. Field and E.T. Buitenhuis et al., 2007. Contributions to accelerating atmospheric CO2 growth from economic activity, carbon intensity and efficiency of natural sinks. Proc. Natl. Acad. Sci. USA., 104: 18866-18870.
CrossRefDirect Link - Elaigwu, S.E., V.O. Ajibola and F.M. Folaranmi, 2007. Studies on the impact of municipal waste dumps on surrounding soil and air quality of two cities in Northern Nigeria. J. Applied Sci., 7: 421-425.
CrossRefDirect Link - Gholizadeh, M.H. and M. Darand, 2009. Forecasting the air pollution with using artificial neural networks: The case study: Tehran City. J. Applied Sci., 9: 3882-3887.
CrossRefDirect Link - Gold, D.R., A.A. Litonjua and A. Zanobetti, 2005. Air pollution and ST-segment depression in elderly subjects. Environ. Health Perspect., 113: 883-887.
PubMed - Jacob, D., 1999. Introduction to Atmospheric Chemistry. Princeton University Press, USA, pp: 25-26.
Direct Link - Masarie, K.A. and P.P. Tans, 1995. Extension and integration of atmospheric carbon dioxide data into a globally consistent measurement record. J. Geophys. Res., 100: 593-610.
CrossRefDirect Link - Muis, Z.A., H. Hashim, Z.A. Manan and F.M. Taha, 2010. Optimization of biomass usage for electricity generation with carbon dioxide reduction in Malaysia. J. Applied Sci., 10: 2613-2617.
CrossRefDirect Link - Narayanan, K.V. and E. Natarajan, 2006. Cofiring of coal and biomass in a travelling grate boiler in India. J. Applied Sci., 6: 1924-1928.
CrossRefDirect Link - Olaleye, V.F., E.A. Oluyemi and O.A. Akinyemiju, 2005. Environmental disamenities produced by particulate and gaseous emissions from ewekoro cement kilns on some strata of aquatic and terrestrial ecosystems. J. Applied Sci., 5: 428-436.
CrossRefDirect Link - Pekkanen, J., A. Peters, G. Hoek, P. Tiittanen and B. Brunekreef et al., 2002. Particulate air pollution and risk of ST-segment depression during repeated submaximal exercise tests among subjects with coronary heart disease. The exposure and risk assessment for fine and ultrafine particles in ambient air (ULTRA) study. Circulation, 106: 933-938.
CrossRefDirect Link - Pope, C.A. and D.W. Dockery, 2006. Health effects of fine particulate air pollution: Lines that connect. J. Air Waste Manage. Assoc., 56: 709-742.
CrossRefPubMedDirect Link - States, R.J. and C.S. Gardner, 2000. Thermal structure of the mesopause region (80-105 km) at 40°N laitude. Part I: Seasonal variations. J. Atmospheric Sci., 57: 66-77.
Direct Link
ozioko osinachi m Reply
i like the article,would have preferred the whole package for my project.