
H. Mahmoodzadeh
Department of Biology, Faculty of Science, Islamic Azad University of Mashhad, Mashhad, Iran
Research Journal of Environmental Sciences
Year: 2009 | Volume: 3 | Issue: 2 | Page No.: 225-231


ABSTRACT
Canola plants, salt tolerant cv. (Okapi) and salt sensitive cv. (Symbol) were grown in greenhouse conditions in presence or absence of different concentrations of NaCl. Inhibition of plant growth and modification of plant morphology are the most sensitive responses of canola plant to salt stress. The ratio of fresh weight to dry weight of plants after stress application of NaCl was strongly increased in comparison to their corresponding control. Electerophoretic analysis of total soluble protein (SDS-PAGE) profiles were carried out in order to evaluate the response of canola cultivars to salt stress. SDS-PAGE analysis has revealed that plant grown under NaCl showed induction in the synthesis of few polypeptide in seeds. Increasing of these proteins was greater in tolerant cv. than the sensitive. This differences reflected the biochemical adjustment of the plant to cope with the saline conditions. These results can be translated into efforts aimed to develop salt tolerant cultivars and maximize the use of saline soils.
PDF Abstract XML References Citation
How to cite this article
H. Mahmoodzadeh, 2009. Protein Profiles in Response to Salt Stress in Seeds of Brassica napus. Research Journal of Environmental Sciences, 3: 225-231.
DOI: 10.3923/rjes.2009.225.231
URL: https://scialert.net/abstract/?doi=rjes.2009.225.231
DOI: 10.3923/rjes.2009.225.231
URL: https://scialert.net/abstract/?doi=rjes.2009.225.231
INTRODUCTION
Salinity negatively affects crop production worldwide through numerous deleterious effects on plant cells including membrane disorganization, generation of toxic metabolites and reactive oxygen species as well as the inhibition of photosynthesis (Hasegawa and Bressan, 2000). Because plants respond to salinity by activating a complex set of defense pathways that ultimately culminate in tolerance or susceptibility, the breeding of salinity-tolerant crops has been difficult Transgenic approaches including the enhanced expression of a Na+/H+ antiporter have been successful. With the completion of plant genome projects, rapid development of post-genomic techniques i cluding microarrays and proteomics-based strategies may identify additional targets for engineering salinity tolerance (Zhu, 2002).
Salinity, which is generally detrimental to plant growth, adversely affects plant metabolism and causes important modifications in growth, development and gene expression of plants. Such modifications may lead to the accumulation or depletion of certain metabolites, resulting in the imbalance in the levels of a relatively small set of cellular proteins, which could increase, decrease, appear, or disappear after salt treatment (Kong et al., 2005). Soil salinity imposes two types of stresses on plants. The first one is nutritional imbalance caused by saline ions and low soil water potential in both uptake and translocation processes. The second one is a toxicity due to the high accumulation of Na+ and Cl– ions in the cytoplasm (Kafkafi and Bernstein, 1996). Salinity causes a combination of complex interactions affecting plant metabolism or susceptibility to injury (Hasegawa and Bressan, 2000). To avoid this adverse effect, plant evolves a great variety of adaptive mechanisms, such as osmotic adjustment, selective ion uptake and cytoplasmic and vacuolar ion compartmentation (Blumwald, 2000). However, the molecular basis of salinity tolerance of various plant species has not been understood (Ramagopal, 1987). Several salt-induced proteins have been identified in plant species (Ashraf and Harris, 2004). Pareek and Singla (1997) suggested that stress proteins could be used as important molecular markers for the improvement of salt tolerance using genetic engineering techniques. However, proteins produced under salt stress are not always associated with salt tolerance; consequently, using proteins as a salt tolerance indicator depends on the nature of the plant species or cultivar. There are many reports showing that the protein pattern changes are accompanied by the biological changes in the adaptation process, which makes the organism more fit in the altered environment (Hurkman and Tanaka, 1987; Singh et al., 1985). However, protein changes do not always confer tolerance to salinity.
Salt stress proteins have been reported in many plant species, such as in barley roots (Ramagopal, 1987; Hurkman and Tanaka, 1987): 20-24 kDa, pI 6.3-7.2 and 26 kDa, pI 6.3 and 6.5; in Brassica (Jain et al., 1993): 56.1-70.8, 93.8 kDa; in rice: roots (De Souza et al., 2003; Claes et al., 1990; Salekdeh et al., 2002), 14.5, 15 kDa, pI 5, shoots (Shirata and Takaishi, 1990): 15 and 26 kDa, cultured cells (Shirata and Takaishi, 1990): 26 and 27 kDa and germinating seeds (Rani and Reddy, 1994): 23 kDa; in Raphanus sativus (Lopez et al., 1994): 22 kDa; in cultured tobacco cells (Singh et al., 1985): 18, 19.5, 21, 26, 34, 35.5, 37, 58 kDa and in tomato roots (Chen and Plant, 1999): 21 kDa, pI 5.7; 21.5 kDa, pI 5.5; 22 kDa, pI 5.4; and 32 kDa, pI 6.4.
However, the effect of salt stress on protein changes in canola (Brassica napus) seed has rarely been studied. This study focused on salt sensitive and tolerant cv. of canola (Symbol and Okapi) seed. We were interested in the evaluation of the protein changes in canola plants after salt stress using SDS-PAGE.
MATERIALS AND METHODS
The experiment was conducted in Faculty of Science, Islamic Azad University of Mashad, Iran (2006).
Plant Material
Brassica napus (cv. Okapi and Symbol) seeds were supplied by the Agricultural Research Center of Khorasan, Iran. Seeds were surface sterilized for 1min in 70% ethanol and 5min in 5% (v/v) sodium hypochlorite in water. Seeds were rinsed with sterile deionized water 3-4 times and were placed on a sterile filter paper in a Petri dish containing 5mL of deionized water (control) or 3, 6, 9, 12 dS m-1 of NaCl solution. The experiment consisted of twenty seeds per Petri dish and a total of 5 replicates for both the control and treated seeds. The plates were sealed with laboratory film and incubated in the dark at room temperature (20 ± 2 °C) for 7days at which time root and shoot lengths were measured. The data were analyzed using the GLM procedure of SAS (Statistical Analysis System). In the second part of experiment, seeds planted in pots in greenhouse condition. There were a control group which received no solution of NaCl plus four other groups which treated with salt solutions of 3, 6, 9 and 12 dS m-1. Seeds obtained from the canola plants were used for SDS-PAGE. To determine dry weight, plants were dried at 75-80 °C for 24 h. Protein extraction for SDS-PAGE. Approximately 1 g of seeds was homogenized first in liquid nitrogen. Then three volumes of extraction buffer (50 mM Tris-HCl, 1 mM PMSF, 2 mM EDTA, 1 mM 2-mercaptoethanol, pH 7.5) was added followed by stirring at 4 °C for 1-4 h. The homogenate was centrifuged for 25 min at 14000 rpm at 4 °C. The supernatant was collected and mixed with three volumes of cold acetone. Then samples were kept at -20 °C for 20 min followed by centrifugation for 15 min at 14000 rpm at 4 °C. The supernatant was then removed and the pellets were air-dried at room temperature. Thereafter, the pellets were resuspended in a small volume of extraction buffer and centrifuged for 5 min at 14000 rpm at 4 °C. Finally, the supernatant was prepared for protein assay with the method of Bradford and SDS-PAGE.
SDS-PAGE
SDS-PAGE was carried out in 12.5% separating gel and 5% stacking gel according to the method of Hames and Rickwood (1990). Gels were run at ambient temperature (20 °C) for 6 h at constant power of 80 mA until the tracking dye reached the end of the gel. After electrophoresis, the gel was stained with Coomassie blue according to the method of Reed et al. (1998). Relative mol. wt. of each protein was determined using a standard protein marker.
RESULTS
Plant Growth
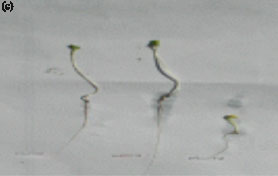
In order to assess the relative levels of salinity tolerance, particularly during germination, we germinated both control and treated seeds in Petri dishes with or without NaCl solutions. Appearance of the control and treated seedlings after 7days of continuous germination in Petri dishes in the absence or presence of NaCl is shown in Fig. 1. The appearance of seedlings in a Petri dish which formed a typical experimental setup is shown in Fig. 1a and b and representative control and treated seedlings in the absence or presence of NaCl is shown in Fig. 1c. It is obvious that both the root and shoot lengths of the treated seedlings were affected to a greater extent by the NaCl when compared to the controls. In order to fully gauge the extent of tolerance of Okapi seedlings to the imposed stress their root and shoot lengths were measured and compared to the Symbol. From the data presented (Fig. 2) the extent of reduction of shoot length as a result of the salinity stress was lower in the case of Okapi seedlings whereas in the Symbol seedlings this reduction was significantly greater (Fig. 1c). In the case of mean root lengths in the presence of NaCl, the extent of reduction in mean root length was once again significantly (p<0.05) greater in the case of the Symbol (Fig. 2). Effects of salt stress on the growth of canola plant are shown in Fig. 3. In control, no stress symptoms were observed in both roots and shoots. After addition to poor extension growth of shoots the roots become yellow.
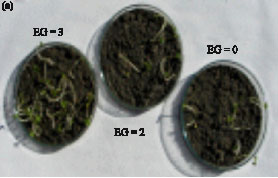 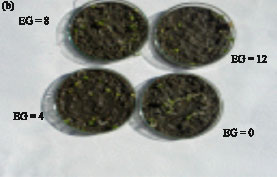 | |
| Fig. 1: | Effect of NaCl on the germination and subsequent growth of tolerant (a) and sensitive (b) cv. of B. napus seedlings. (a, b) Appearance of representative seedlings germinated in Petri dishes, (c) appearance of all seedlings in a typical Petri dish |
 | |
| Fig. 2: | Effect of NaCl on mean shoot length (a) and on the mean root length (b) |
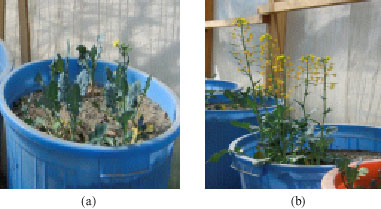 | |
| Fig. 3: | Effects of salt stress on the growth of canola plants. In control (a), no stress symptoms were observed in plants. After exposure of plants to 12 dS m-1 of NaCl, morphological changes were observed (b) |
This observation is in conformity with earlier reports (Kafkafi and Bernstein, 1996; Ramagopal, 1987). They reported that growth parameters were found to be the most important indicators for screening for salt tolerance.
Dry Weight
At high concentrations of NaCl (6, 9, 12 dS m-1) the ratio of fresh weight to dry weight of plants was increased. This increasing was greater in the case of sensitive cv. (Symbol) (Fig. 4 ).
 | |
| Fig. 4: | Ratio of fresh weight to dry weight of canola plants under 0, 3, 6, 9, 12 dS m-1 NaCl (Data are means of three replications) |
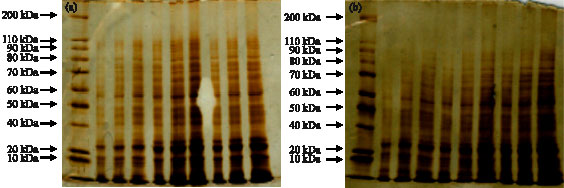 | |
| Fig. 5: | SDS-PAGE profiles of seed proteins from (a) canola cv. Symbol and (b) in 0 (2, 3, 4 columns), 3 dS m-1 (5, 6, 7 columns) and 12 dS m-1 (8, 9, 10 columns). First column is protein marker |
SDS-PAGE
For SDS-PAGE, proteins were extracted from seeds of salt-treated and salt-untreated plants. Comparing the protein profiles between control plants and those treated with different salt concentrations using SDS-PAGE showed that NaCl treatment did induce significant changes in the pattern of proteins. It was found that the intensity of the bands for 18, 27, 30, 32 and 50 kDa proteins in seeds was increased in salt-treated plants. These protein bands were more abundant in tolerant cv. Than the sensitive cv. (Fig. 5). In contrast, the intensity of other protein bands was not increased.
DISCUSSION
To abolish or reduce the effects of salt stress, plants may change their gene expression and protein accumulation. In an attempt to understand the molecular basis of salt tolerance, a SDS-PAGE method was used to identify proteins involved in salt stress response in canola. It is widely known that there are numerous transient responses to environmental shock and that many of these genes are common to several types of stresses, such as cold, salinity, heat and osmotic stress (Hajheidari et al., 2005). Some proteins were found to express at a lower level in salt-stress plants. This could be due to the inhibitory effects of salt stress on transcriptional process (Riccardi et al., 1998).
Salt-induced proteins in other plants were also observed by De Souza et al. (2003), Claes et al. (1990) and Abbasi and Komatsu (2004). De Souza et al. (2003) demonstrated that SALT protein (14.5 kDa) expression is induced in roots, sheaths and laminae of rice plants exposed to 170 mM NaCl. Claes et al. (1990) reported that salinity induced changes in 15 kDa protein synthesis are often more pronounced in both leaf sheaths and in roots of salt-sensitive rice cv. Taichung native 1. They suggested that water was lost more readily from the sheath to replace that lost from leaves or roots, or that salt was transferred from leaves and roots into the sheath to maintain a critical osmotic balance in the two more important tissues. Whereas, Abbasi and Komatsu (2004) found that 5 specific salt-responsive proteins, which were expressed in specific regions of rice, were up-regulated in rice leaf sheath and expressed in other tissues. One (LSY262, an unidentified spot) was expressed in leaf sheath and root, three (44.8 kDa, pI 7.2, fructose biphosphate aldolases; 35.4 kDa, pI 4.8, Photosystem 2 oxygen evolving complex protein and 27.1 kDa, pI 5.4, oxygen evolving enhancer protein 2) in leaf blade and the other (LSY363, an unidentified spot) in leaf blade and root, but at a low level of detection. They also found that these salt-responsive proteins, which were found in rice leaf sheath, were also enhanced by other stresses such as low temperature and drought.
There are many reports concerning the correlation between salt protein levels and the level of salinity tolerance using the physiological parameters such as photochemical efficiency of photosynthesis and net photosynthesis rate (De Souza et al., 2003; Chotechuen, 2001). Moreover, Na+/K+ ratio and chlorophyll content can be used as an indication of the stress tolerance capacity in plants and used for screening salt-tolerant lines of plants. Based on Na+/K+ ratio, the sensitive line had less capacity to exclude Na+ ions than the tolerant lines. Thus, it was possible to establish a positive correlation between level of salinity tolerance and protein expression level. In conclusion, the data presented here revealed that salinity induced changes in protein patterns in seeds of canola. Additionally, the 18, 27, 30, 32, 50 kDa proteins whose level increased after salt stress could represent salt-stress induced proteins in canola seed. Moreover, this study reported the molecular weights of some salt responsive proteins. It is necessary to further study the structural and functional roles of these salt stress-responsive polypeptides to enhance our understanding of the salt responses in canola.
ACKNOWLEDGMENTS
I would like to thank of Research Center of Bou-Ali and Mrs. Soroush for doing the SDS-PAGE. Funding for this research was through the research project in Islamic Azad University of Mashhad.
REFERENCES
- Abbasi, F.M. and S. Komatsu, 2004. A proteomic approach to analyze salt-responsive proteins in rice leaf sheath. Proteomics, 4: 2072-2081.
PubMedDirect Link - Ashraf, M. and P.J.C. Harris, 2004. Potential biochemical indicators of salinity tolerance in plants. Plant Sci., 166: 3-16.
CrossRefDirect Link - Blumwald, E., 2000. Sodium transport and salt tolerance in plants. Curr. Opin. Cell Biol., 12: 431-434.
CrossRefDirect Link - Chen, C.C.S. and A.L. Plant, 1999. Salt-induced protein synthesis in tomato roots: The role of ABA. J. Exp. Bot., 50: 677-687.
CrossRefDirect Link - Claes, B., R. Dekeyser, R. Villarroel, M. Van Den Bulcke and G. Bauw et al., 1990. Characterization of rice gene showing organ-specific expression in response to salt stress and drought. The Plant Cell, 2: 19-27.
PubMed - Filho, G.A.D.S., B.S. Foreiraa, J.M. Diasa, K.S. Queiroza and A.T. Brancoa et al., 2003. Accumulation of SALT protein in rice plants as a response to environmental stresses. Plant Sci., 164: 623-628.
CrossRef - Hajheidari, M., M. Abdollahian-Noghabi, H. Askari, M. Heidari and S.Y. Sadeghian et al., 2005. Proteome analysis of sugar beet leaves under drought stress. Proteomics, 5: 950-960.
CrossRef - Hasegawa, P.M., R.A. Bressan, J.K. Zhu and H.J. Bohnert, 2000. Plant cellular and molecular responses to high salinity. Annu. Rev. Plant Physiol. Plant Mol. Biol., 51: 463-499.
CrossRefDirect Link - Hurkman, W.J. and C.K. Tanaka, 1987. The effects of salt on the pattern of protein synthesis in barley roots. Plant Physiol., 83: 517-524.
Direct Link - Jain, S., H.S. Nainawatee, R.K. Jain and J.B. Chowdhury, 1993. Salt-tolerance in Brassica juncea L. II. Salt-stress induced changes in polypeptide pattern of in vitro selected NaCl-tolerant plant. Euphytica, 65: 107-112.
CrossRef - Kong-Ngern, K., S. Daduang, C. Wongkham, S. Bunnag, M. Kosittrakuna and P. Theerakulpisuta, 2005. Protein profiles in response to salt stress in leaf sheaths of rice seedlings. Sci. Asia, 31: 403-408.
CrossRef - Lopez, F., G. Vansuyt, P. Fourcroy and F. Case-Delbart, 1994. Accumulation of a 22-kDa protein and its mRNA in the leaves of Raphanus sativus in response to salt stress or water stress. Physiol. Plant., 91: 605-614.
CrossRefDirect Link - Ramagopal, S., 1987. Salinity stress induced tissue-specific proteins in barley seedlings. Plant Physiol., 84: 324-331.
PubMed - Rani, R.U. and A.R. Reddy, 1994. Salt stress responsive polypeptides in germinating seeds and young seedlings of Indica rice Oryza sativa L. J. Plant Physiol., 143: 250-253.
Direct Link - Riccardi, F., P. Gazeau, D. de Vienne and M.M. Zivy, 1998. Protein changes in response to progressive water deficit in maize. Plant Physiol., 117: 1253-1263.
Direct Link - Shirata, K. and H. Takagishi, 1990. Salt-induced accumulation of 26 and 27 kD proteins in cultured cells of rice plant. Soil Sci. Plant Nutr., 36: 153-157.
Direct Link - Singh, N.K., A.K. Handa, P.M. Hasegawa and R.A. Bressan, 1985. Proteins associated with adaptation of cultured tobacco cells to NaCl. Plant Physiol., 79: 126-137.
CrossRefPubMedDirect Link - Salekdeh, G.H., J. Siopongco, L.J. Wade, B. Ghareyazie and J. Bennett, 2002. A proteomics approach to analyzing drought-and salt-responsiveness in rice. Field Crop Res., 76: 199-219.
CrossRef