
C. Sudhakar Reddy
Forestry and Ecology Division, National Remote Sensing Agency, Balanagar, Hyderabad-500 037, India
M. Rangaswamy
Forestry and Ecology Division, National Remote Sensing Agency, Balanagar, Hyderabad-500 037, India
C.S. Jha
Forestry and Ecology Division, National Remote Sensing Agency, Balanagar, Hyderabad-500 037, India
Research Journal of Environmental Sciences
Year: 2008 | Volume: 2 | Issue: 1 | Page No.: 58-62


ABSTRACT
Land use and land cover change has impacts on the functioning of socioeconomic and environmental systems. Remote sensing images and Geographical Information Systems (GIS) are being used to identify and analyze land use and land cover changes. The present study is carried out to identify and quantify spatio-temporal changes due to river course diversion in part of Kosi river basin, Bihar, India, using multitemporal satellite datasets of Landsat MSS (1976), Landsat TM (1990) and IRS P6 LISS III (2004). It was ascertained through remote sensing and time series analysis that there has been a major land cover changes were taking place in the proximity of river course. During 1976 to 1990 a shift of 5 km is found in north western part and 3 km in central and north eastern part of study area. During 1990 to 2004, also Kosi river shows a significant shift of 3.5 km in north western part, followed by central and north eastern parts of river with 2.5 km shift.
PDF Abstract XML References Citation
How to cite this article
C. Sudhakar Reddy, M. Rangaswamy and C.S. Jha, 2008. Monitoring of Spatio-Temporal Changes in Part of Kosi River Basin, Bihar, India Using Remote Sensing and Geographical Information System. Research Journal of Environmental Sciences, 2: 58-62.
DOI: 10.3923/rjes.2008.58.62
URL: https://scialert.net/abstract/?doi=rjes.2008.58.62
DOI: 10.3923/rjes.2008.58.62
URL: https://scialert.net/abstract/?doi=rjes.2008.58.62
INTRODUCTION
Land is very important natural resource, which provides basis of life to terrestrial and aquatic flora and fauna in one way or the other. Land-cover refers to the physical characteristics of earth’s surface, captured in the distribution of vegetation, water, soil and other physical features of the land, including those created solely by human activities e.g., settlements. Land-use refers to the way in which land has been used by humans and their habitat, usually with accent on the functional role of land for economic activities (Louisa and Antonio, 2001). Water is the most powerful agent in shaping the earth’s surface through the processes of rivers, glaciers, ground water, weathering, mass movement and oceans (Mirza, 2004).
Land Use and Land Cover Change (LUCC) has important impacts on the functioning of socioeconomic and environmental systems with important tradeoffs for sustainability, food security, biodiversity and the vulnerability of people and ecosystems to global change impacts (Lesschen et al., 2005). There are various causative factors of land cover change, including natural factors. Of which river course change being the most important one. These changes may leads to the socioeconomic imbalance by reducing crop yield, infrastructure damage and leave a footprint in the livelihoods of the poor people in the society. In addition, it leads to the ecological degradation and local climate change. Various Natural Resource Management, Planning and Monitoring programs depend on accurate information about the land cover in a region. Satellite remote sensing and Geographical Information System has allowed the scientific community to study large expanses of land and observe how it changes over time.
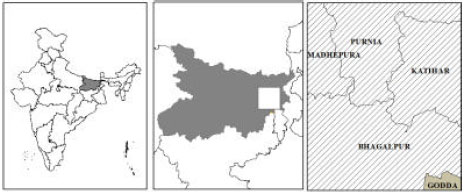 | |
| Fig. 1: | Location map of part of Kosi river basin, Bihar, India |
Since the early 1980s, remote sensing images and Geographical Information Systems (GIS) are being used to identify and analyze land use and land cover changes. The results provide researchers with information enabling them to make rapid decisions using recent data (Ricketts, 1992).
MATERIALS AND METHODS
Study Area
The Kosi River (The Sorrow of Bihar) is well-known in India for rapid and frequent avulsions of its course and the extensive flood damages it causes almost every year. The Kosi is one of the major tributaries of the Ganga River and rises in the Nepal Himalayas. After traversing through the Nepal Himalayas, it enters India near Bhimnagar. Thereafter, it flows through the plains of north Bihar and joins the Ganga River near Kursela, after traversing for 320 km from Chatra. The river has been causing a lot of destruction by lateral movement and extensive flooding. As its waters carry heavy silt load and the river has a steep gradient, the river has a tendency to move sideways. To check the lateral movement as well as for flood control, embankments on both sides of the river were constructed, five to sixteen km apart. Although this has confined the lateral shift of the river within the embankments, but the problem of flooding is still a challenge in this area (Ghosh et al., 2004). There must be a realization that minimizing the risk and damage from floods may be more rational way of flood management rather than formulating structural measures along the dynamic rivers such as the Kosi.
The study area selected for the present study is located in between 25°09 to 25°30' and 87°03' to 87°31', spread in parts of Bhagalpur, Katihar, Purnea and Madhepura districts of Bihar State (Fig. 1). It has a flat terrain (MSL <150 m) and a southerly to southeasterly slope. The basin was formed during late Paleogene-Neogene times and is related to the upheaval of the Himalayas vis a vis flexural downwarp of the Indian Lithosphere under the supracrustal load of the Himalayas (Wadia, 1961). It has a northern piedmont belt where water oozes to the surface, followed by a broad belt of swampy lands, depressions and lakes and finally an aggregation of alluvial fans as all these northern streams bend to form confluence points with the Ganga (Singh and Kumar, 1970). The plain is subject to frequent channel avulsions, flooding and resultant sedimentation. These events have influenced the pattern of its wetlands, most of which originate from the meandering action of the streams.
Land Use and Land Cover Changes
The present study is an attempt to find out the land use and land cover changes as a reflection of river course shift in surface water bodies. The study is carried out using multitemporal satellite data of Landsat MSS, 13th November, 1976 (path/row: 150/42), Landsat TM, 21st November 1990 (path/row: 139/42) and IRS P6 LISS III, 22nd October, 2004 (path/row: 106/54). Ancillary data like Survey of India topographical maps on 1: 50,000 scale and ground truth information are also used. Erdas Imagine 9.1 software was used for geometric correction and digital image processing. The image to image registration of data is carried out using orthorectified Landsat ETM + data, which was obtained from Anonymous (2004). For registration Ground Control Points (GCPs) are well distributed throughout the scene. The first order polynomial transformation with nearest neighbor resampling technique has been adopted and a registration error (root mean square error) of the transformation 0.28 was obtained (<1 pixel error). Landsat MSS, Landsat TM and IRS P6 LISS III satellite datasets were resampled to 57 m to maintain similar spatial resolution as like Landsat MSS.
After the registration of digital images, the training samples for each land use and land cover classes have been collected from the field. The multispectral classification was carried out using supervised classification techniques with maximum likelihood classifier. Prior to this, homogenous sites in the image were located in each land use class. These are called training sites. Then multivariate statistical parameter viz. mean, standard deviation, covariance matrices, correlation matrices etc, were extracted for each training site. Every pixel both within and outside these training sites is then evaluated and assigned to class by using maximum likelihood classifier. Classification was performed separately for multitemporal image datasets. Spatio-temporal change analysis was determined by comparing multi-temporal images. Change detection (matrix model) was carried using ERDAS Imagine.
RESULTS AND DISCUSSION
Six primary land cover types were delineated using satellite data viz: water bodies, marshy land, forest, crop land, fallow and sand. It was ascertained through remote sensing and time series analysis that there has been a major land use/cover changes were taking place in the proximity of river course.
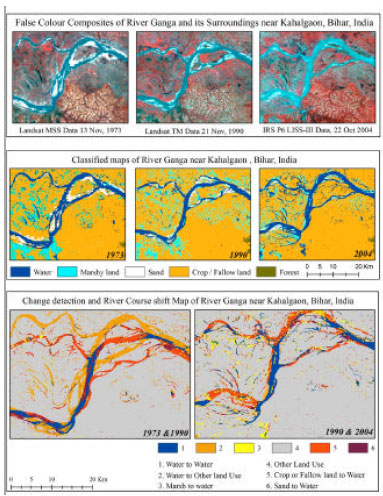 | |
| Fig. 2: | False Colour Composite images, Classified and Change detection maps: part of Kosi river basin, Bihar, India |
There is considerable shift of river course was observed in the different periods (Fig. 2). During 1976 to 1990 a shift of 5 km is found in north western part and 3 km in central and north eastern part. During 1990 to 2004, also Kosi river shows a significant shift of 3.5 km in north western part, followed by central and north eastern parts of river with 2.5 km shift.
A significant change of land cover from water bodies and vice versa was evident from the interpreted results of the images taken in 1976, 1990 and 2004. In about 200 years the river has moved laterally by about 150 km (Gole and Chitale, 1966; Wells and Dorr, 1987). During the period 1731-1963 the course of Kosi river shifted westward by about 125 km (Mall et al., 2006).The Kosi river has moved westwards by 120 km in the past 250 years through more than 12 distinct channels. The river which used to flow near Purnea in the 18th century now flows east of Saharsa (Anonymous, 2007). Based on these studies shift of river course was calculated as 1.3 to 2.1 km per year. Our study reports the shift of river course during 1976 to 2004 (last three decades) is in the range of 200 to 300 m per year.
According to the recent vegetation and land cover map 66 and 8.6% of area was occupied by crop land and fallow, respectively (Table 1). It infers that the study area was agriculturally most productive.
Within a period of three decades, dynamic changes were observed in study area. Between 1976 and 1990, there was a radical conversion of water bodies to other land cover, which was accounted to be 163 km2. Other land cover goes into surface water bodies are quantified as 108.3 km2. Only 52.7 km2 area (24%) was found to be constant during 1976 to 1990 (Table 2).
In recent period of 1990 to 2004 also significant change in the areal extent of water bodies was observed. An area of 75.2 km2 under water bodies were converted to other land cover, which was estimated as around 47% of the coverage (Table 3). These hotspot areas frequently battered by extreme water hazards and put people as well as economy at risks (Mirza, 2004).
Over all change analysis from 1976 to 2004 with reference to forest cover indicates, negative changes (loss of forest area) accounted for 2.4 km2 s area.
| Table 1: | Areal extent of Vegetation and other Land cover in study area (area in km2) |
 | |
| Table 2: | Change area matrix of Vegetation and other Land cover in study area from 1976 to 1990 (area in km2) |
 | |
| Table 3: | Change area matrix of Vegetation and other Land cover in study area from 1990 to 2004 (area in km2) |
 | |
CONCLUSIONS
Based on previous findings, the shift of river course was 1.3 to 2.1 km per year (Gole and Chitale, 1966; Wells and Dorr, 1987; Mall et al., 2006; Anonymous, 2007). Present study reports the shift of river course during last 30 years is in the range of 200 to 300 m per year. It indicates the steady stabilizing trend in the geographical system.
The study reveals the utilization of multitemporal satellite datasets for detection and monitoring of changes in the surface water configurations. Continuous monitoring of both satellite-generated data and ground patterns of surface water is required for better management. The present images helped to identify the trend of spatio-temporal changes of the dynamic water configurations in the study area.
From the above it can be concluded that change in river course is an environmental problem of serious concern. The long term planning would be clearly required for adaptation measures for river course change impacts.
ACKNOWLEDGMENTS
We are thankful to Dr. P.S. Roy, Deputy Director (RS and GIS Applications), Dr. M.S.R. Murthy, Forestry and Ecology Division, NRSA, Hyderabad, Sri S.D. Sharma, Deputy General Manager (EMG), National Thermal Power Corporation Ltd., Kahalgaon Super Thermal Power Project, Bhagalpur, Bihar for suggestions and encouragement. Thanks are due to Global Land Cover Facility Programme, University of Maryland, USA for providing Landsat MSS, TM and ETM+ datasets.
REFERENCES
- Jansen, L.J.M. and A. Di Gregorio, 2002. Parametric land cover and land-use classifications as tools for environmental change detection. Agric. Ecosyst. Environ., 91: 89-100.
CrossRefDirect Link - Mall, R.K., A. Gupta, R. Singh, R.S. Singh and L.S. Rathore, 2006. Water resources and climate change: An Indian perspective. Curr. Sci., 90: 1610-1626.
Direct Link - Ricketts, P.J., 1992. Current approaches in geographic information systems for coastal management. Mar. Pollut. Bull., 25: 82-87.
CrossRefDirect Link