
P. Shokat
Department of Marine Biology, Khoramshahr University of Marine Science and Technology, P.O. Box 669, Khoramshahr, Iran
S.M. B. Nabavi
Department of Marine Biology, Khoramshahr University of Marine Science and Technology, P.O. Box 669, Khoramshahr, Iran
A. Savari
Department of Marine Biology, Khoramshahr University of Marine Science and Technology, P.O. Box 669, Khoramshahr, Iran
P. Kochanian
Department of Fishery, Khoramshahr University of Marine Science and Technology, P.O. Box 669, Khoramshahr, Iran
Pakistan Journal of Biological Sciences
Year: 2010 | Volume: 13 | Issue: 22 | Page No.: 1085-1091


ABSTRACT
The aim of present study was to examine the macro invertebrates as an assessment tool for characterization of the state of Bahrekan estuary in Persian Gulf, by using different biotic indices. An investigation on benthos was carried out during autumn 2008 to summer 2009 in the Bahrekan estuary (Persian Gulf). In order to identify and assess the benthic community structure, seasonal sampling was done from 21 stations with three replicates using van veen grab (./285 m2). The ecological indices, such as (AMBI, BI and Bentix), Shannon-Wiener index (H'), species richness (S) were applied to the available benthic species data, and evaluated comparatively. The grain size of sediments and total organic matter as essential factors in distribution and population diversity of macrobenthos communities were also analysed. According to the results, 17 groups of macrobenthos were identified. Out of 111 genus/species identified in this study, Gastropoda was the dominate group (79.8%), followed by Bivalvia (5.5%). Pyrgohydrobia sp. belonged to gastropoda was dominant in all of seasons. The results showed that all of the stations are characterized as muddy bottom and Bahrekan estuary are classified in slightly to moderate pollution status.
PDF Abstract XML References Citation
Received: August 23, 2010;
Accepted: October 04, 2010;
Published: November 02, 2010
How to cite this article
P. Shokat, S.M. B. Nabavi, A. Savari and P. Kochanian, 2010. Application of Biotic Indices in Assessing the Ecological Quality Status of Bahrekan Estuary (Persian Gulf ). Pakistan Journal of Biological Sciences, 13: 1085-1091.
DOI: 10.3923/pjbs.2010.1085.1091
URL: https://scialert.net/abstract/?doi=pjbs.2010.1085.1091
DOI: 10.3923/pjbs.2010.1085.1091
URL: https://scialert.net/abstract/?doi=pjbs.2010.1085.1091
INTRODUCTION
In resent years various benthic biotic indices have been applied to different geographical areas, for use in soft-bottom marine benthic communities. Most of the more recently developed indices, such as AMBI (Borja et al., 2000; Muxika and Borja, 2005) and Bentix (Simboura and Zenetos, 2002), were based on dividing soft-bottom benthic species into previously defined ecological groups (Pearson and Rosenberg, 1978; Grall and Glemarec, 1997) and then determining the respective proportion of the different groups in the benthic communities (or sampling) (Dauvin, 2007). The AMBI has been proposed for the assessment of the ecological status of estuarine and coastal waters (Zettler et al., 2007). Borja et al. (2003, 2004) and Muxika and Borja (2005) state that AMBI was validated in areas involving a large set of impact sources (domestic waste, heavy metals, submarine outfalls, drilling cuts with ester-based mud, industrial and mining waste) in accordance with community structure measures and multivariate methods used in assessing anthropogenic impacts (Prato et al., 2009). The Bentix index (Simboura and Zenetos, 2002) is a marine biotic index based on the concept of indicator species and was developed for the propose of the ecological status classification of the marine environment using the macroinvertebrates quality elements. The index is designed for the assessment of the impact caused by general stress factors and does not discriminate among natural and anthropogenic disturbance (Simboura et al., 2007). It has been tested successfully in a variety of Hellenic benthic ecosystems (Simboura and Zenetos, 2002) and in case areas subject to organic pollution such as the Athens or Saronikos gulf (Simboura et al., 2005), to oil spills accidents (Zenetos et al., 2004) and is currently tested in other Mediterranean areas within the framework of the WFD intercalibration exercise (EC, 2003). (Simboura et al., 2007). Persian Gulf is a shallow semi- enclosed water body situated in the north of the tropic of cancer in an arid sub-tropical region . Bahrekan estuary is an eutrophicated area subjected to organic pollution from wastes. Other remarkable features of this area are biological impacts (i.e., fisheries), presence of oil, heavy metals (such as pb, cu and cd), sewage pollutions (only urban). All these factors together make this area a site for research and scientific works.
MATERIALS AND METHODS
In order to study the macro fauna structure of Bahrekan estuary in Persian Gulf 21 stations were selected (2-7 m deep). Seasonal sampling from soft-bottom sediments were sampled during autumn 2008 to summer 2009. The map of sampling sites is presented in Fig. 1. Triplicate samples for studying the benthic macroinvertebrates of each station were collected using a (0.285 m2) Van Veen grab. At each station one extra grab sample was obtained to determine Total Organic Matter (TOM) and texture of the sediment analyses. All samples were sieved on 1 mm mesh size sieve and animals were preserved in the field with 4% formalin solution in seawater and dyed with Rose Bengal. In the laboratory, macroinvertebrates were sorted from sediment and classified into morphological functional group level and consequently identified into species level where possible. The organic matter content was determined by the loss on ignition method that consists of drying sediment at 105°C for 24 h and then combusting it at 520°C for 6 h. The loss on ignition represents the total organic matter (Holme and Mclntyre, 1984). The particle size composition of the sediment was determined by drying it for 48 h at 60°C, then washing it through a 63 μm in order to eliminate the thin fraction (silt and clay). The retained material was dried at 60°C, after that all samples were sieved on AFNOR succession meshes (Holme and Mclntyre, 1984). The classification of ecological quality status, is done by AMBI index (Borja et al., 2000), Bentix index (Simboura and Zenetos, 2002). AMBI 4.0 (http://www.azti.es.) and an Add-in v.09 (http://www.bentix.ath.hcmr.gr/).
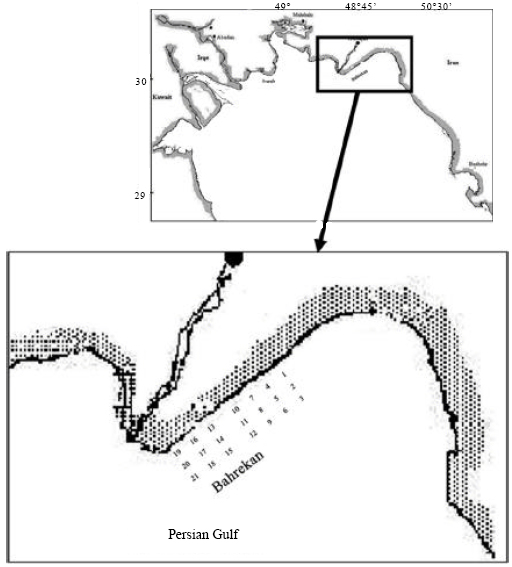 | |
| Fig. 1: | Sampling stations of bahreken estuary |
Software Programme Packages were employed in the analysis data. Biodiversity indices, such as the Shannon diversity index (H`) and the species richness (S) were also applied and evaluated comparatively using the Statistic Software (Ludwig and Reynolds, 1988). Statistic Software SPSS 11.5 was employed for statistically analysis.
RESULTS
In the present study 111 genus/species of macrofauna were identified. Highest number of species belonged to Polychaetes (37 species) and gastropods (28 species) respectively. The greatest number of individuals were belonged to gastropoda (79/8%), bivalvia (5/5%), foraminiforida and polychaeta (4/7%) and other groups (2/3%) . Ecological quality status assessments (EQS) according to ranges of biotic indices are classified in Table 1. The values of the benthic indices applied in the fauna are presented in Table 2, giving also the ecological quality status assessment based on the Bentix, AMBI and H` indices. The results showed that Maximum densities of Maera sp. and Ampithoe sp. (belonged to amphipods) were observed in station 6 and 8. Figure 2 shows that in general, according to AMBI and BI values, in different seasons and stations, the most of stations are classified in slightly pollution (87%), moderate pollution (1%) and unpolluted (12%). For Bentix unpolluted (26%), slight polluted (42%), moderate polluted (20%) and poor (12%). For Shannon-Wiener moderate pollution (23%), poor pollution (52%) and bad pollution (25%). Figure 3 shows the variation of the diversity (Fig. 3a) and species richness index (Fig. 3b) against the axis of increasing values of the Bentix index. The correlation of the Bentix with diversity is statistically highly significant (p<0.001), while species richness is not correlated with the Bentix (p = 0.74). Pearson and Rosenberg (1978) noted that this is interpreted by the fact that Shannon diversity encompasses two components of the community structure : evenness and species richness.
 | |
| Fig. 2: | Percentage of samples from Bahrekan estuary for each classes of EQS according to AMBI, Bentix and H’ |
 | |
| Fig. 3: | Covariance of Bentix with diversity (a) and species richness (b) indices |
| Table 1: | Classification of EQS according to range of H`,Bentix and AMBI (cited in Albayrak et al., 2006) |
 | |
The evenness or equitability component of diversity is sensing the occurrence of opportunist species but generally diversity is much more influenced by species richness (Simboura and Reizopoulou, 2007). Figure 4 shows the plotting of the percentage of tolerant and sensitive taxa along the gradient of increasing Bentix index. Based on this plot, it is evident that cross-line point of the two lines corresponding to the value of the Bentix = 4, represents the class center of good where literally the two ecological groups of tolerant and sensitive share the fauna by 50% each. At the high to good class boundary (Bentix = 4.5), the percentage of the tolerant taxa accounts for more than 20% of the fauna and the percentage of the sensitive taxa drops to less than 70%.
 | |
| Fig. 4: | Bentix values plotted against the percentages of the two ecological groups. M.: Moderate class; G: Good class; H: High class |
| Table 2: | Summary results for indices applied at each stations |
 | |
At the good to moderate class boundary (Bentix = 3.5), the percentage of the sensitive taxa less than 40% and the tolerant species becomes over 50% . From 21 stations, some 84 samples of benthos have been obtained over a 1 year period. After the application of the (AMBI) BC, considering its correspondence with the BI, the results were : 10 samples with a BI = 1; 73 samples of BI = 2 and 1 sample of BI = 3. The classification of BC, BI and ecological group are presented in Table 3. Macrobenthos animals according to their sensitivity to an increasing stress gradient, classified in 5 ecological groups. The results that obtained by comparing different biological parameters, on samples having the same biotic indices are showed in Fig. 5. The BI = 7 is equivalent to an azoic site, so all the biological parameters are equal to 0. The mean abundance increasing from 1210 ind m2 (BI = 1) to 7290 ind m2 (BI = 3) (Fig. 5a). The standard error of the mean is very small; however it is larger in the highest. statistical analyses were made considering the BC because, as this coefficient can derive continuous values, it is more suitable for this purpose than the BI. Taking into account all the samples analysed, the non-parametric Spearman rank correlation between the abundance and the BC is highly significant (p<0.001). Figure 5b shows the numerical diversity derived from the number of individuals. The mean diversity decreases from 2.79 bits ind-1 (BI = 1) to 2.38 bits ind-1 (BI = 3), with the exception of the (BI = 2) with value of 2.16 bits ind-1. The standard error is larger in BI = 2. The diversity is correlated with BC (p<0.001) using Spearman rank correlation. Figure 5c shows a similar pattern with abundance and there is a progressive increase in the mean values, from 25 species (BI = 1) to 46 species (BI = 3). The standard error of the mean is larger in (BI = 1). There is not a statistically significant correlation between richness and BC (p>0.05) (Spearman rank correlation). The relationships between some of the sedimentological parameters and biotic index are shown in Fig. 5d and e. Samples with (BI = 1) are associated with less than 97.64% mud and the values increase to 99% (BI = 3).
| Table 3: | Summary of the BC and BI (Borja et al., 2003) |
 | |
 | |
| Fig. 5: | Mean and standard error values of different biological and sedimentological parameters on samples having the same biotic indices (a) Abundance; (b) diversity; (c) richmess; (d) Percentage of organic matter and (e) percentage of mud |
 | |
| Fig. 6: | Percentage of organic matter and mud in Bahrekan estuary 2008-2009 |
The organic matter content has a similar pattern of distribution to that of granolometry. There is a progressive increase of the mean values, from 25% (BI = 1) to 30% (BI = 3). For both, the standard error is larger in (BI = 1). The non-parametric Spearman rank correlation between these variables and BC are not statistically significant (p>0.05). The percentage of organic matter and mud (<63 μm) are showed in Fig. 6. As you see the percentage of TOM is high (more than 24%) except in station 1 (21.7%) and also percentage of mud is very high (more than 96%).
DISCUSSION
Benthic community are used extensively as indicator of environmental quality status because many studies have described that benthos responds predictably to many kinds of natural and antropogenic stress. The key elements for a successful assessment of the EQS are the classification of water bodies, typologies and the definition of reference conditions.
The performance of each biotic index in a certain area depends on the structure of the index, which includes (1) the weighting coefficient of each ecological group in relation to the others, (2) the selection of the class boundaries across values and (3) the existing pattern of distribution of the species across an ecological-stress gradient, reflecting how the community of each ecosystem has responded to human pressure. The Bentix index over the stations, covering the classes from moderate to high (2.85 to 4.56). The AMBI and Shannon-Wiener indices over the stations, covering the classes good (1.31 to 2.75) and poor (1.52 to 3), respectively.
Several benthic groups, such as amphipods (Gesteira and Dauvin, 2000), cumaceans (Corbera and Cardell, 1995) or polychaetes (Ros and Cardell, 1991; Samuelson, 2001), have been used as indicators of stress or pollution. Crustaceans, especially amphipods not only to significant increases in organic matter but also to increases in other kinds of pollution including heavy metals and hydrocarbons (Dauvin, 2007). High density of Maera sp.and Ampithoe sp. has been reported in station 6 and 8, that subjected to organic enrichment (more than 25%), silt-clay (more than 98%) and oil pollution. The tolerant (GT) and sensitive (GS) groups in these stations were 70% and 21%, respectively. Acording to Bentix and Shannon-Wiener indices these stations were characterized as moderate and poor, respectively. Acording to Bentix index station 1 and 21 showed high status. It is due to high (more than 50%) and low (0-10%) density of G1 and GV, respectively. The Shannon diversity index and species richness are strongly influenced by several parameters such as sample size, seasonal natural variability, habitat type, sampling methodology and for all these reasons it is suggested to be used carefully as an ecological classification device (Simboura et al., 2007). AMBI and Bentix indices are exclusively based on species sensitivities. In the AMBI and Bentix framework, species were assigned into 5 and 3 ecological groups, respectively. The moderate class in AMBI includes a larger variety of relative proportions of group GIII and GIV because these groups are also accompanied by some sensitive or indifferent taxa. In the Bentix method the weight given to the tolerant group GIII is equal to the weight of both opportunistic groups, GIV and GV, while in AMBI the weight of the tolerant group is less than any of the opportunistic groups. Therefore, the Bentix index enhances the weight of tolerants in relation to opportunists compared to the AMBI, and attributes to these groups an equal significance, thus associating them more closely. Accordingly, these two groups appeared together in moderate class in assessments of Bentix index. AMBI may demonstrate good class in the Bahrekan estuary sites where Bentix has assessed as high class. This is partly attributed to the fact that in the AMBI method the indifferent group species are weighted separately, while Bentix counts them with the sensitive. Also the high class in the AMBI (0-1.2) is more compressed compared to the Bentix high class (4.5-6) (Simboura and Reizopoulou, 2007). Another difference is that AMBI demonstrates good class in the Bahrekan estuary sites where Bentix has assessed a moderate class. One reason for this is that tolerant species are weighted separately in the AMBI giving different significance to each tolerant group of species. In the Bentix method, all tolerant species are weighted equally versus the sensitive ones. Besides, the scaling of the distances among classes is different in the two methods. The Bentix sets equal distances for the moderate (2.5-3.5) and good (3.5-4.5) classes, while the AMBI renders a wider good class (1.2-3.3) compared to the moderate (3.3-4.3) and high (0-1.2) (Simboura and Reizopoulou, 2007). According to the model described in Fig. 6, the good class center of the Bentix method corresponds to both groups sharing equally 50% of the fauna. The good class according to the WFD corresponds with only slight deviation from undisturbed conditions and most sensitive taxa must be present. Our results indicate that at good class the sensitive species account to no less than 41% (Fig. 4). This may not be the absolute majority of the fauna but we consider it as a satisfactory percentage for good class, given that tolerant species cover all grads of resistance to disturbance (Simboura and Zenetos, 2002). The moderate class according to this model corresponds with sensitive species dropping below 40% and tolerant species increasing to more than 50%. This actually complies with the definition of moderate class as corresponding with moderate deviation from normal where most of the sensitive taxa should be absent (less than 40%). The species belonging to ecological Group V are mainly deposit-feeder. As such, they could modify the proportion of organic matter in the sediments on which they feed and, subsequently, modify the grain size composition of the sediments. The optimal grain size may be different for the settling larvae, juveniles and adults of a variety of deposit-feeders (Snelgrove and Butman, 1994), changing their physico-chemical properties. For example, faecal pellets of benthic invertebrates modify the grain size of the superficial sediments (Hall, 1994). The amount of organic matter and mud in this area was very high. The results of the sediment grain size analysis indicated that the texture of soil in this area is mostly consisting of silt-clay so all of the stations characterized as muddy bottom. Due to high dominance of species such as Pyrgohydrobia sp., Tornatina sp., Osangularidae sp., Cossura sp. and also according to the results of AMBI, BI, Bentix and H`indices Bahrekan estuary are classified in slightly to moderate pollution status.
ACKNOWLEDGMENTS
The Department of Marine Biology of Khorramshahr University of Marine Science and Technologyand and the Department of Environment of Khuzestan Province were provided general and material support, respectively. We wish to thank Dr. Nomiki Simboura (Hellenic center for Marine Research, Anavissos, Greece) for advising us in the application of Bentix and AMBI, respectively. Many thanks is given to Mr. Mahmod yarahmadi for purely technical help in this survey.
REFERENCES
- Borja, A., J. Franco and V. Perez, 2000. A marine biotic Index to establish the ecological quality of soft-bottom benthos within European estuarine and coastal environments. Mar. Poll. Bull., 40: 1100-1114.
CrossRef - Borja, A., I. Muxika and J. Franko, 2003. The application of a Marine Biotic Index to different impact sources affecting soft-bottom benthic communities along European coasts. Marine Pollut. Bull., 46: 835-845.
CrossRef - Corbera, J. and M.J. Cardell, 1995. Cumaceans as indicators of eutrophication on soft bottom. Sci. Mar., 50: 63-69.
Direct Link - Dauvin, J.C., 2007. Paradox of esturine quality: Benthic indicators and indices, consensus or debate for the future. Mar. Pollut. Bull., 55: 271-281.
CrossRef - Gesteira, J.L.G. and J.C. Dauvin, 2000. Amphipods are good bioindicators of the impact of oil spill on soft-bottom macrobenthic communities. Mar. Pollut. Bull., 40: 1017-1027.
CrossRef - Grall, J. and M. Glemarec, 1997. Using biotic indices to estimate macrobenthic community perturbations in the Bay of Brest. Estuarine. Coast Shelf Sci., 44: 43-53.
CrossRef - Muxika, I. and A. Borja, 2005. The suitability of the marine biotic index (AMBI) to new impact sourcs along European coasts. Ecol. Indicators, 5: 19-31.
CrossRefDirect Link - Pearson, T.H. and R. Rosenberg, 1978. Macrobenthic succession in relation to organic enrichment and pollution of marine environment. Oceanogr. Mar. Biol. Ann. Rev., 16: 229-311.
Direct Link - Prato, S., J.G. Morgana, P. La Valle, M.G. Finoia and L. Lattanzi et al., 2009. Application of biotic and taxonomic distinctness indices in assessing the ecological quality status of two coastal lakes caprolace and fogliano lakes (Central Italy). Ecol. Indicators, 9: 568-583.
CrossRef - Ros, J.D. and M.J. Cardell, 1991. Effect on benthic communities of a major input of organic matter and other pollutants (coast off Barcelona, Western Mediterranean). Toxicol. Environ. Chem., 31-32: 441-450.
CrossRef - Simboura, N., E. Papathanassiou and D. Sakellariou, 2007. The use of a biotic index (Bentix) in assessing long-term effects of dumping coarse metalliferous waste on soft bottom benthic communities. Ecol. Indicators, 7: 164-180.
CrossRef - Simboura, N., P. Panayotidis and E. Papathanassiou, 2005. A synthesis of the Biological Quality Elements for the implementation of the European water framework directive in the mediterranean ecoregion : the case of Saronikos Gulf. Ecol. Indicators, 5: 253-266.
CrossRef - Simboura, N. and S. Reizopoulou, 2007. A comparative approach of assessing ecological status in two coastal areas of eastern Mediteranean. Ecol. Indicators, 7: 455-468.
CrossRef - Simboura, N. and A. Zenetos, 2002. Benthic indicators to use in ecological quality classification of Mediterranean soft bottom marine ecosystems, including a new biotic index. Mediterr. Mar. Sci., 3: 77-111.
Direct Link - Zenetos, A., I. Chadjianestis, M. Lantzouni, N. Simboura, E. Sklivagou and G. Arvanitakis, 2004. The Eurobulker oil spill: Mid-term changes of some ecosystem indicators. Mar. Pollut. Bull., 48: 122-131.
PubMed - Zettler, M.L., D. Schiedek and B. Bobertz, 2007. Benthic biodiversity indices versus salinity gradient in the Southern Baltic Sea. Mar. Pollut. Bull., 55: 258-270.
CrossRefDirect Link - Albayrak, S., H. Balkis, A. Zenetos, A. Kurun and C. Kubanc, 2006. Ecological quality status of coastal benthic ecosystem in the Sea of Marmara. Mar. Pollut. Bull., 52: 790-799.
PubMed