
Ruihui Mu
College of Computer and Information Engineering, Xinxiang University, Xinxiang, Henan, China
Journal of Software Engineering
Year: 2015 | Volume: 9 | Issue: 4 | Page No.: 702-720


ABSTRACT
In order to improve the single, large power consumption disadvantages of conventional wireless sensor network resources, the optimization algorithm is proposed for wireless sensor network resources. Network design and analysis of wireless sensor networks, optimizing power consumption and energy saving methods algorithm rates and nodes and finally compared by using two different sets of simulation data. Experimental results show that the wireless sensor networks, as opposed to the traditional algorithms, optimization algorithm design resources with higher speed and more can save energy transfer and consumption of network nodes in a network node capacity and speed and with convergence.
PDF Abstract XML References Citation
Received: November 18, 2014;
Accepted: April 02, 2015;
Published: April 25, 2015
How to cite this article
Ruihui Mu, 2015. Node Resource Optimization Algorithm Based on Wireless Network. Journal of Software Engineering, 9: 702-720.
DOI: 10.3923/jse.2015.702.720
URL: https://scialert.net/abstract/?doi=jse.2015.702.720
DOI: 10.3923/jse.2015.702.720
URL: https://scialert.net/abstract/?doi=jse.2015.702.720
INTRODUCTION
Wireless sensor network is a combination of distributed information processing technology, wireless communication technology, modern network technology, embedded computing and sensor technology (Geng et al., 2013a; Fan, 2012). It is a radar sensor, a temperature, visible, infrared, magnetic sensors, a low sampling rate, a vibration sensor and other types of miniature sensors to collect real-time collaborative integrated sensing, detection and monitoring, via wireless communication information is detected send to a multi-hop routing and self-organizing network approach to the user terminal. It is necessary for the application of sensor networks in space exploration, field RMON hazardous areas, to prevent and combat terrorism, disaster relief, environmental monitoring, biomedical, urban management, agricultural production, industrial control, military defense, so it gets the world’s attention (Zhou et al., 2007, 2013; Ali-Eldin et al., 2012; Breitgand and Epstein, 2011). Wireless networks are moving towards a higher transfer rate, seamless coverage, integration of multiple wireless access technologies, efficient collaboration with the surrounding networks and terminals and its ultimate goal is to constitute a heterogeneous communication and cross-border collaboration between broadband converged network to realize seamless handover between mobile terminals and roaming capabilities of heterogeneous networks. It can be expected with the continuous development of wireless communication technology, the future wireless communications network will provide a heterogeneous integration trends, along with ubiquitous connectivity, ubiquitous intelligent information services and harmonious interaction with the environment characteristics, wireless network to meet people's desires with anyone or anything in any type of information communication and interaction, at any time, any place, in order to adapt to the intelligence of the human society and the Pan-demand in the field of information (Hirai et al., 2009; Park et al., 2008; Sudevalayam and Kulkami, 2011; Berangi et al., 2011; D’Ariano and Pranzo, 2009; Zhang and Li, 2010; Nguyen et al., 2011).
The purpose of wireless sensor networks is to process, collect information and perception of the area covered by the object and finally be able to get this information released. Wireless sensor network is composed of a set of sensors in the form of self-organization. The three basic elements of a sensor network is the observer of the sensing target and the sensor (Zhai et al., 2011). Among them, the means of communication between the observer and the sensor is implemented via a wireless network. The topology of the sensor network will be a malfunction in the dynamic node constantly changing access or movement. Where each node can access, the ability to locate and dynamic search each node is a router and the communication between the nodes is through self-organized manner to achieve, to perform. A typical user interface of a sensor network, the internet, send and composed of distributed sensor nodes. In addition, researchers have developed several sensor nodes protocol stack, the stack sensor application architecture is supported by the technology, sensor networks and communication protocols and multi-level network (He et al., 2012; Geng et al., 2013b, c; Li et al., 2012) management techniques. It is a more complete sensor network protocol stack system. This is entirely possible through the various layers global collaboration and interaction protocol performance information superimposed on the appropriate application cross-layer optimization of the network characteristics and constraints of the policy and goals of the system optimization strategy selected for different users to achieve the service requirements and service quality goals and ultimately improve overall system performance.
With the rapid development of hardware manufacturing technology and wireless communication technology, the sensor nodes are no longer as in the past, it has a smaller size, lower manufacturing costs, higher data acquisition accuracy. Wireless sensor network is a collection of data acquisition, data processing and communication capabilities of network technology. In general, due to the lower cost, efficient information gathering, wireless sensor networks are widely used in many fields of early warning, detection and structural health monitoring. A variety of physical and chemical information of the message composition and the composition of wireless sensor networks working schematic and working schematic shown in Fig. 1, the collection of wireless sensor networks to meet the demand for access to information. Wireless sensor networks has brought great convenience for the modern industry, agriculture and people’s daily lives. Application prospect of wireless sensor network technology is very broad, so it is considered to be one very important application of technology, has become in the world, one recent research hotspot technology.
This study mainly makes the extensive and innovative work in the following areas:
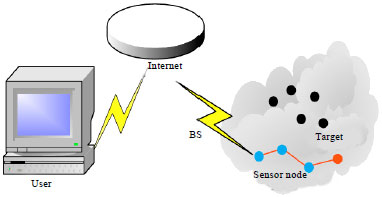 | |
| Fig. 1: | Working schematic diagram of wireless sensor network |
| • | Aiming at network resource optimization problem in wireless sensor network, in order to improve the transmission of network nodes, the optimization of storage speed and the computer processing power, this study proposes the optimization research of wireless sensor network resources. This study analyzes the cross-layer design, power control and network throughput of wireless sensor network, adjusts transmission power through the power control mechanism to optimize network topology. The results show that the optimized network resource is superior to the traditional network resource |
| • | This study puts forward the algorithm optimization method of network resources and compares the different node rate through experiment simulation. The results show that the new algorithm is faster, has good convergence and has the obvious improvement than the traditional algorithm |
METHODOLOGY
Design for cross-layer wireless sensor network
Application design of wireless sensor network: From a review of the wireless sensor network the network has two characteristics: (1) Nodes of wireless network users can only communicate with the base station in the cell, that is the nodes can only access the network through the single-hop way and (2) There is a central control node in the wireless resource network each users’ node in the network needs to feedback its own channel state and network status information to the base station and then the central station will allocate the resource type. From its first feature it is not hard to find out that there is no need to think about the system parameters in the link layer of wireless sensor network, therefore the cross-layer resource allocation generally focuses on the joint optimization of physical layer and link layer and from the second point can be known that the resource allocation algorithm of wireless network usually not does considered the distributed implementation, so it is relatively simple to design.
Cross-layer design within the overall framework makes information sharing and transfer between layers for the different requirements and status of the relevant agreements and also it uses mutual influence and dependence between layers to achieve the overall optimization of network performance. Advantages of cross-layer design and optimization are optimizing the overall system performance and reducing the overhead of communication and processing. By way of interaction between layers, different levels can achieve timely sharing of local information. Compare with the traditional hierarchical structure, the interaction between layers of cross-layer protocol stack is more complex, which reduces the versatility. Cross-layer design approach uses the message-driven control, coordination function modules and coordination of the protocol to effectively eliminate the redundant functions and at the same time the layers may also interact the information. For the specific occasions, the application requirements and network conditions are matched to optimize and integrate the design. The shortcomings of the complexity of the protocol design bought by interlayer are less than the advantage bought by the cross-layer design. Typically, through the two methods, the cross-layer design of wireless ad hoc network can be achieved, shown as Fig. 2.
Consumption of network function: Reducing the consumption of overall energy and the transmit power of nodes are the influences brought by power control to the efficiency of the network. In the state of ensuring channel connected, power control can reduce the energy consumption of transmitter nodes and reduce the amount of transmit power margin. Size of transmit power and network topology are related with connectivity.
 | |
| Fig. 2: | Cross-layer design |
When the transmit power is too big, the node transmit power will consume too much energy but also it will reduce the overall network performance. While when the transmission power is too small, it will cause the network split and some nodes can not establish the communication connection. Topological characteristics of the network can be regulated by the power control technology, thus achieving the performance requirements of network applications and at the same time by finding the optimal control strategy and the transmit power the optimization of topology is realized. The average intensity of the competition in network is also affected by the size of transmit power. By control the transmit power in the network, the power control is realized and then the average intensity of competition of network is reduced. For the impact of network capacity, on the one hand, the performance of the power control are the packet retransmission or loss and in order to reduce the probability of communication conflict and effectively reduce the network collision domain, the power control technology can be used to achieve. On the other hand, more concurrent data transmission within the network are allowed, thus the data transmission nodes are effectively reduced, which can affect the number of neighboring nodes. Each hop in wireless ad hoc networks goes through three stages and they are queue delay, propagation delay and processing delay stage. When transmitting the messages, wireless ad hoc network uses the multi-hop routing approach. The related applications of sensor networks are extremely strong. By changing the node’s transmit power, the survival time of the system can be prolonged; the energy efficiency is increased and energy consumption of communication of network can be minimized. For the performance of wireless sensor networks, the impact of its network topology control is large. Good topology is help for extend the life time of the entire network and it provides a foundation for the target location, time synchronization and data fusion but also it improves the efficiency of protocol and routing protocol. Each node in the network reaches the neighbor node with the way of balancing the nodes. By the power control mechanism the transmit power is adjusted and the network topology is optimized.
Many network optimization studies tend to believe that the link with a fixed transmission capacity. However, the link transmission capacity in wireless sensor networks is not a constant but the related functions with the transmit power and channel conditions. Link capacity model can be expressed as:
| (1) |
wherein, T is a unit time; e is a vector in the form of the transmission power; constant K = -φ1/log (φ2BER), wherein φ 1 and φ 2 are associated with the modulation scheme; BER is the bit error rate.
The SNR of link Al is defined as:
wherein, eij is the scalar form of transmit power; Gki is the path loss; nij is the noise; Gij is the path gain on link l.
Taking into account the reasonable spreading gain, Gij is much larger than Gki. Assuming that there is not too much neighbor nodes simultaneously transmitting information, KSIR is much greater than 1 and in a high SNR region Cij is approximately equal to logKSIRij(e).
Cross-layer resource optimization algorithm
Largest web-based resource allocation optimization: When considering the global probability capacities of all possible paths and the optimal subchannels and power allocation, the largest network resource optimization in wireless network the can be written as:
| (2) |
| (3) |
| (4) |
Due to the above optimization problem cannot satisfy the basic conditions of wireless networks, this study adapts the across-resource optimization algorithms to solve the allocation of sub-channel and power and guarantee the requirements of minimum rate at the same time. If the resources allocation of wireless sensor networks is give, it is possible to meet the requirements of the minimum rate and the optimal allocation of power can be formed. Therefore, subcarrier is allocated through Eq. 3:
Then, according to the LaGrand multiplication to solve the power allocation on each link; the multiplication factor (1-∂) can be added to optimize the power equation of resources allocation in the wireless network:
 |
wherein, hs is the node rate; utility function Us (xs) is a smooth convex function increments.
To maximizing the life of consumption-based networks: Because the energy consumption of the node communication accounts for most of its total energy consumption, this chapter only considers the communication energy consumption in the process of data transmission. The etij and erij, respectively denote the energy consumption of sending and receiving data on the link (i, j). The energy consumption ωi during per unit time I can be represented as:
Each node i is with the energy ei at the initial time, so the service life ti of i is:
The lifetime of the entire network is defined as the period of time form the network initial time to the death time of the first node.
The problem of maximizing the network lifetime can be expressed as:
Optimization of wireless network model: On the premise of guaranteeing the information condition, to maximize the network lifetime, namely:
Each node needs to know the remaining energy of the other nodes to optimize their own decisions, which needs the global communication, thus increases the cost of communication. In order to solve this problem, this chapter adopts the method proposed in Geng et al. (2013c) and introduces an approximate expression to denote the network lifetime.
when, α→∞, the maximization:
which zi = 1/ti.
To calculate the value of zi, it only need to exchange the local information. Therefore it can solve this approximation problem by using the distributed algorithm.
When calculating data sent for each node using Slepian-Wolf, it needs to use global information network. Gristio provide a coding method based on a local Slepian-Wolf coding method to present a distributed algorithm to calculate data sent rate for each node. In particular, if V denotes the node which is closer to gather nodes than node i among the neighbor node set of node I. Local Slepian-Wolf coding illustrates, in the premise of guaranteeing the information condition, the data sent rate of each node Z should be:
So, the Eq. 3 can be approximate to:
Because some constraints are non-convex, the transformation method log is used to convert: Let, ![]() . The above optimization question can be deformed as:
. The above optimization question can be deformed as:
| (5) |
| (6) |
| (7) |
| (8) |
| (9) |
| (10) |
| (11) |
| (12) |
The system parameters’ congestion cost λ1 and energy cost μ1 are introduced, the above Lagrange function of the optimization problems is described as:
 |
The associated Lagrangian dual function is as:
 |
Then the dual problem of Eq. 11 is expressed as:
 |
According to the vertical decomposition theory, the Eq. 11 can be decomposed into three sub-questions:
 |
For a given cost factor (λ, μ), assuming that (x’(λ, μ), τ(λ, μ), e(λ, μ), p (λ, μ)) and Lagrangian function L(λ, μ, x’, τ’, e, p) is taken the largest, then in each link (i, j), it is defined as:
 |
According to the sub-gradient algorithm, the following update equation of the consideration factors is achieved as the follows:
| (13) |
According to the three sub-problems derived from the Eq. 13 and then after the solving of sub-problem, the optimization solutions of the Eq. 13 can be obtained.
Power control solutions on physical layer: Corresponding to Eq. 3 sub-problem wherein:
Since, the objective function is different, the gradient algorithm is solved and is defined as:
| (14) |
Competitive access solutions: For each node I, the corresponding sub-problem (2) is defined as:
| (15) |
wherein, Linterference(l) is the mutual interference link of l, the optimized solution for the Mac layer is solved as:
 | (16) |
Rate allocation problem on transport layer: Because the objective function is difference, for corresponding, it chooses the gradient algorithm to solve. Derivative can be obtained as follows:
The update equation of x’s is:
| (17) |
wherein, k3(t) is the forward direction step size with t times iteration.
The above maximization problem can be obtained as:
 | (18) |
wherein, κ4(t) is the forward direction step with the t-th iterations.
Algorithm accomplishment: In mobile web of things, the main work of wireless sensor network is responsible for data collection, storage and upload, only a small part of the flow rate is used to control the issued business. The network abilities of the nodes tend to be restricted, so it usually adopts transmission mode using the jump pass step by step to solve the uneven distribution of network.
Realizing the optimization algorithm; firstly, the constraints of Eq. 7-11 is transferred into another form:
The optimization of optimal Eq. 7-11 is not necessarily obtained in the boundary of constraints, that is, the optimum may not meet:
This is because the optimization goal of Eq. 7-11 is not about the monotonic function of value vector: When the modulation is switched to the illustrates conservative values: The system will be under a greater probability in the next lower order modulation schemes. In this case according to Eq. 16, the ![]() will be going smaller; on the other hand, according to Eq. 16, the average packet error rate will
will be going smaller; on the other hand, according to Eq. 16, the average packet error rate will![]() be going smaller, so according to Eq. 17 the average number of transmissions is the increasing function of the average packet error rate monotonically
be going smaller, so according to Eq. 17 the average number of transmissions is the increasing function of the average packet error rate monotonically ![]() It is easy to find that there is a maximized packet error rate to make the optimal. Since there is an increasing relationship between the average number of transmissions and the average packet error rate, there is an optimal packet error rate and the optimal transmission delay. It is can be obtained through the following equation:
It is easy to find that there is a maximized packet error rate to make the optimal. Since there is an increasing relationship between the average number of transmissions and the average packet error rate, there is an optimal packet error rate and the optimal transmission delay. It is can be obtained through the following equation:
Obviously, this is a convex optimization problem, it is can be solved by let:
After simplification it can be obtained as follows:
 |
So, the optimal packet error rate ![]() and optimal delay
and optimal delay![]() can be separately used and through Eq. 16 and 17 the maximum optimization resources algorithm of wireless network can be obtained.
can be separately used and through Eq. 16 and 17 the maximum optimization resources algorithm of wireless network can be obtained.
RESULTS
Experimental set: In order to verify the effectiveness of cross-layer optimization algorithm in wireless sensor networks based on network utility and longevity, the following simulations are established: Wireless sensor network is consists of six nodes and uses the topology shown in Fig. 3 generated by LEACH algorithm, in which node number 6 is the aggregation node. In the simulation experiment, the utility function Us(xs) of the set node is a logarithmic function; system function γ = 0.5, step ki(t) = ki (0)/t, i = ,…, 4; aggregation node 6 is not discussed within the simulation.
Results analysis: Figure 4 is the simulation results of node rate with the number of iterations and the figure shows that each node has faster convergence rate, wherein since the node 10 is the nearest to the aggregation node 11, it has a higher rate. Figure 5 is the simulation results of the node power consumption with the convergence of iterations; power consumption of node No. 8 to 9 have quickly converge; node number 5 is closest to the aggregation node 6, which assume more data transfer tasks, so compared to other nodes its convergence is slow. Figure 6 is the probability of connection of the node in the link and the simulation results show that each node after brief fluctuations has converge and the probability of node 5’s access aggregation node 5 is as 3. Figure 7 and 8 are, respectively the simulation results of congestion cost and energy cost with the convergence of iterations.
 | |
| Fig. 3: | Topology structure diagrams of experiment network |
 | |
| Fig. 4: | Node rate |
 | |
| Fig. 5: | Power consumption of node |
 | |
| Fig. 6: | Access probability of the node in the link |
 | |
| Fig. 7: | Congestion cost of node |
 | |
| Fig. 8: | Energy cost of node |
After short-term fluctuations the congestion cost is close to zero, which indicate that under the experimental environment the proposed algorithm can alleviate and eliminate the network congestion status; energy cost is also converge with iteration time, in which due to node 5 bears more data transfer task, its energy consumption is higher and energy cost parameters converge is nonzero value.
Comparison of node power consumption under different work condition of two algorithms: This study has the corresponding simulation for wireless network resources optimization algorithm based on business request load perception in the MATLAB simulation environment. In the simulation, the simulation parameters are divided into three groups. The simulation parameters are, respectively ng, nu, kg and the simulation values are, respectively 10, 130 and 150 W. Simulation of wireless sensor network resource optimization selects day unit as the research object. Assuming in 24 h of a day, user business requests distribution rule in time domain accords with network load analysis of the network node and the arrival rate distribution of user request network as shown in Fig. 9.
 | |
| Fig. 9: | Node power consumption map of wireless network under different work mode |
 | |
| Fig. 10: | Distribution diagram of the business arrival rate of wireless sensor network resources optimization |
When the user’s arrival rate is low, in the wireless network due to the reason of MH is driven by the maximized own benefits, it makes the MH access to the sleep mode to reduce the power consumption of the network and the cost of consumption but the MH continues to work on activation patterns to receive user requests due to the need to cover. As the user arrival rate gradually increases, in the wireless sensor network region since each MH can obtain earnings forecast, correspondingly be successive to enter into the activation patterns, accept each network user’s request and meet the constraints of system business request blocking rate. The same as the traditional network, the wireless sensor network resources based on suspend mode will be the same with the traditional network power consumption. Therefore, in heterogeneous converged network the collaborative energy saving algorithm based on dormant fully tap the lower phase of business request arrival rate to conduct dormancy operation for MH within the network, thus to achieve the purpose of reducing the power consumption of the system.
As shown in Fig. 10, therefore, when the business request arrival rate of wireless network user is low, the in-network MH automatically enter a dormant state, then its power loss is the lowest.
 | |
| Fig. 11: | Comparison of network power consumption under two kinds of working mode |
 | |
| Fig. 12: | Comparison of power consumption saving ratio under two kinds of working mode |
On the contrary with the gradually increase of the network users arrival rate, as the scheduling network activation of the contrast algorithm sets priorities, when the load increases gradually, it is prior to choose larger network nodes to automatically optimize the activated state and other networks as the supplement. With the increasing load of wireless network and activation stage by stage, therefore, it can achieve the optimal solution in terms of energy consumption as shown in Fig. 11 and 12.
Therefore, as shown in Fig. 9, the resources optimization algorithm for wireless sensor can adaptively schedule MH work model according to the network load. Compared with the traditional non dormant network, it can reduce the total energy consumption to 13% in a day, thus the energy efficiency of the wireless sensor network system brings obvious improvement of the performance. Compared with the traditional algorithm, at the same time, when the blocking rate to meet user requests is less than 1%, the algorithm in this study can reduce the total energy consumption to around 5% within a day. Therefore, the power consumption work mode of the wireless sensor network proposed this study has greatly improved in terms of node energy consumption compared with the performance.
DISCUSSION
The control overhead is defined in a simulation operation and the ratio of energy consumption of data packet and the energy consumption of data packet transmission. As shown in Fig. 13, with the increase of the node density, more control packets need to be sent and received. The reason why the consumption of the proposed algorithm is lower than the control YUPOS algorithm is that when selecting the head of the cluster in the entire network, the node information of the new head cluster of the original head cluster is adopted. After the cluster members receiving the broadcast information, they modify their own cluster head information but not like the nodes in YUPOS broadcasting the information. They use a certain proportion of competitive to elect the cluster head, so the proposed algorithm does not require to constant reorganization the clusters, which reduce the control overhead. The throughput of the proposed algorithm is higher than YUPOS and it can send more data packets. The proposed algorithm adjusts the relay node to reduce the control overhead of the transmit power. The in the approach of cluster, due to the intra-cluster communication adopts the TDMA mode; the cluster head select the next hop to send control information. Since the less number of cluster heads, send and receive of control packet are much less than presumptuous cluster approach. When the transmitting data nodes increases and the amount of transmitted data is large, each node in KJIM needs to be waked up when sending data. The relay nodes select and the control the non-data transmission packet like SCR. When making the selection of the next hop of relay node, there is a need to send the control messages. The node with the largest power factor is selected as a relay node. Each node will send a data controlled packet when there is data need to be sent and the energy consumption is great.
Because there exists the trade-off between the throughput and energy consumption per bit, the plot of energy consumption per bit versus the throughput can compare the energy saving performance of TPA (the proposed algorithm) and TTA (the traditional algorithm) fairly and clearly.
In order to generate this plot, some assumptions must be made about the parameters of the WSN. It is assumed that the WSN consist of N = 16 sensor nodes. A data rate of R = 20 kbps, a noise power of PN = -110 dbmw and a frequency bandwidth of B = 20 kHz are chosen for the physical layer. A transmit probability p =1/16 is used for TTA. The resulting energy consumption per bit versus the throughput plot is shown in Fig. 14. The upper curve denotes the TTA and the lower curve denotes the TPA algorithm.
 | |
| Fig. 13: | Control overhead of different number of nodes |
 | |
| Fig. 14: | Energy consumption per symbol versus throughput per node |
| Table 1: | Comparison of difference in the proposed algorithm, traditional algorithm (YUPOS algorithm and KJIM algorithm) |
 | |
Figure 14 shows that TPA consumes less energy per bit than TTA at the same throughput demand. In the high throughput region, two curves are close to each other. The SNR increase along with the increase of throughput, the MAI has more evident influence on BER than noise. This evident influence of MAI result in that the transmit probability designs can ignore the value of SNR, so the performances of two algorithm are close. On the other hand, TPA have significant energy savings relative to TTA in the low throughput region. The SNR decrease along with the decrease of throughput, the effect of noise on BER is obvious, so it is very necessary for the transmit probability variety according to SNR.
Another interesting phenomenon can be found in Fig. 14. For TPA, the energy consumption per bit decrease as the decreasing of throughput but the energy consumption per bit for TTA trended to be constant as the decreasing of throughput. The reason is that the transmit probability for TTA dose not change along with SNR, the multiple access channel capacity is not used adequately and the decreasing of SNR and the decreasing of data rate have canceling effect on the energy consumption per bit.
The proposed algorithm can modify their own cluster head information and use a certain proportion of competitive to elect the cluster head, so the proposed algorithm does not require to constant reorganization the clusters, so the energy consumption of data packet is lower than the traditional algorithm and the proposed algorithm can send more data packets, so the throughput is higher than the traditional algorithm. The proposed algorithm can adjust the relay node to reduce the control overhead of the transmit power, so the control overhead is lower than the traditional algorithm. The proposed algorithm needn’t to send the control messages, so the energy consumption of data packet transmission is lower than the traditional algorithm and the transmission speed is faster than the traditional algorithm. The proposed algorithm is compared with traditional algorithm (YUPOS algorithm and KJIM algorithm) shown in Table 1.
CONCLUSION
The proposed cross-layer resource optimization algorithm, to establish a congestion costs and energy costs based collaborative network control mechanisms and proposed on the control flow of the physical layer wiring layer access control integrated power limit. Simulation results show that the algorithm is effective and has fast convergence.
REFERENCES
- Geng, Y., J. He, H. Deng and K. Pahlavan, 2013. Modeling the effect of human body on TOA ranging for indoor human tracking with wrist mounted sensor. Proceedings of the 16th International Symposium on Wireless Personal Multimedia Communications, June 24-27, 2013, Atlantic City, New Jersey, pp: 1-6.
Direct Link - Geng, Y., J. Chen and K. Pahlavan, 2013. Motion detection using RF signals for the first responder in emergency operations: A PHASER project. Proceedings of the IEEE 24th International Symposium on Personal Indoor and Mobile Radio Communications, September 8-11, 2013, London, United Kingdom, pp: 358-364.
CrossRefDirect Link - Geng, Y., J. He and K. Pahlavan, 2013. Modeling the effect of human body on TOA based indoor human tracking. Int. J. Wireless Inform. Networks, 20: 306-317.
CrossRefDirect Link - Fan, J., 2012. The modified levenberg-marquardt method for nonlinear equations with cubic convergence. J. Math. Comput., 81: 447-466.
Direct Link - Zhou, S.K., G. Aggarwal, R. Chellapa and D.W. Jacobs, 2007. Appearance characterization of linear lamebrain object, generalized photometric stereo and illumination-invariant face recognition. IEEE Trans. Pattern Anal. Mach. Intell., 29: 230-245.
PubMed - Ali-Eldin, A., J. Tordsson and E. Elmroth, 2012. An adaptive hybrid elasticity controller for cloud infrastructures. Proceedings of the IEEE Network Operations and Management Symposium, April 16-20, 2012, Maui, HI., pp: 204-212.
CrossRefDirect Link - Breitgand, D. and A. Epstein, 2011. SLA-aware placement of multi-virtual machine elastic services in compute clouds. Proceedings of the IFIP/IEEE International Symposium on Integrated Network Management, May 23-27, 2011, Dublin, Ireland, pp: 161-168.
CrossRef - Zhou, W.L., J. Xie and L.B. Deng, 2013. Sequencing optimization method for drawing train operation diagram of high-speed railway. J. Multimedia, 8: 16-23.
Direct Link - Hirai, C., T. Kunimatsu, N. Tomii, S. Kondou and M. Takaba, 2009. A train stop deployment planning algorithm using a Petri-net-based modelling approach. Quart. Rep. RTRI, 50: 8-13.
CrossRefDirect Link - Park, Y.K., S.L. Park and J.K. Kim, 2008. Retinex method based on adaptive smoothing for illumination invariant face recognition. Signal Process., 88: 1929-1945.
CrossRefDirect Link - Sudevalayam, S. and P. Kulkami, 2011. Affinity-aware modeling of CPU usage for provisioning virtualized applications. Proceedings of the IEEE 4th International Conference on Cloud Computing, July 4-9, 2011, Washington, DC., USA., pp: 139-146.
CrossRefDirect Link - Berangi, R., S. Saleem, M. Faulkner and W. Ahmed, 2011. TDD Cognitive Radio Femtocell Network (CRFN) operation in FDD downlink spectrum. Proceedings of the IEEE 22nd International Symposium on Personal, Indoor and Mobile Radio Communications, September 11-14, 2011, Toronto, ON., pp: 482-486.
CrossRefDirect Link - D'Ariano, A. and M. Pranzo, 2009. An advanced real-time train dispatching system for minimizing the propagation of delays in a dispatching area under severe disturbances. Networks Spatial Econ., 9: 63-84.
CrossRefDirect Link - Zhang, Q. and B. Li, 2010. Discriminative K-SVD for dictionary learning in face recognition. Proceedings of the Conference on Computer Vision and Pattern Recognition, June 13-18, 2010, San Francisco, CA., pp: 2691-2698.
CrossRefDirect Link - Nguyen, M.X., Q.M. Le, V. Pham, T. Tran and B.H. Le, 2011. Multi-scale sparse representation for robust face recognition. Proceedings of the Conference on Knowledge and Systems Engineering, October 14-17, 2011, Hanoi, pp: 195-199.
CrossRefDirect Link - He, J., Y. Geng and K. Pahlavan, 2012. Modeling indoor TOA ranging error for body mounted sensors. Proceedings of the IEEE 23nd International Symposium on Personal Indoor and Mobile Radio Communications, September 12-19, 2012, Sydney, NSW., Australia, pp: 682-686.
CrossRefDirect Link - Li, S., Y. Geng, J. He and K. Pahlavan, 2012. Analysis of three-dimensional maximum likelihood algorithm for capsule endoscopy localization. Proceedings of the 5th International Conference on Biomedical Engineering and Informatics, October 16-18, 2012, Chongqing, China, pp: 721-725.
CrossRefDirect Link