
Mohamed Galal Morsi
Department of Respiratory Medicine, Faculty of Medicine, Cairo University, Egypt
Journal of Medical Sciences
Year: 2009 | Volume: 9 | Issue: 2 | Page No.: 59-69


ABSTRACT
This study aimed to evaluate the total and abdominal adiposity markers in asthmatic patients and their relation to asthma severity and PFTs. Seventy non-smoking adult asthmatics, aged 38.6 ±11.8, (42.9% male), were subjected to history, clinical and radiological examination, measurement of weight, BMI, waist circumference, waist/hip ratio, abdominal height and PFTs. Patients were classified by asthma severity into: 11 intermittent, 15 mild, 26 moderate and 18 severe asthmatics and categorized by BMI into: 25 normal weights, 16 overweight, 22 obese and 7 morbidly obese patients. There was significant increase in total and abdominal adiposity markers with direct linear correlations with increasing asthma severity. Obesity category showed significant inverse correlations with FVC%, FEV1%, TLC% and FRC% and direct linear correlations with DLCO% and DLCO/AV. The interactions between the adiposity markers and PFTs were analyzed using general linear model with MANOVA and revealed more significant associations for the abdominal than total adiposity markers with most PFTs. The results of the study suggest that adiposity markers increase with increasing asthma severity. The abdominal adiposity markers are more effective predictors of obesity on PFTs than total adiposity markers.
PDF Abstract XML References Citation
How to cite this article
Mohamed Galal Morsi, 2009. Abdominal and Total Body Adiposity Markers in Asthmatic Patients. Journal of Medical Sciences, 9: 59-69.
DOI: 10.3923/jms.2009.59.69
URL: https://scialert.net/abstract/?doi=jms.2009.59.69
DOI: 10.3923/jms.2009.59.69
URL: https://scialert.net/abstract/?doi=jms.2009.59.69
INTRODUCTION
Asthma and obesity prevalence have risen over recent decades (Woolcock and Peat, 1997; Beasley et al., 2000; Flegal and Troiano, 2000). An association between obesity and asthma was observed in different studies in adults and children (Figueroa-Muñoz et al., 2001; Luder et al., 2004). Etiological link between obesity and asthma has been suggested but results from earlier studies were inconsistent. Chinn and Rona (2001) had suggested that rising asthma prevalence was not explained by rising BMI.
The prevalence of obesity is increasing and there is evidence that obesity, in particular abdominal obesity is negatively associated with pulmonary function. The mechanism for this association and the best marker of abdominal adiposity in relation to pulmonary function in asthmatics is not precisely known. Weight and Body Mass Index (BMI) as measures of overall adiposity are used as predictors of pulmonary function in many epidemiologic studies. While these measures are widely accepted as determinants of pulmonary function, abdominal adiposity may affect pulmonary function through a mechanism that is different from that of overall adiposity. Abdominal adiposity may restrict the descent of the diaphragm and limit lung expansion, compared to overall adiposity, which may partially compress the chest wall (Biring et al., 1999). Van der Kooy et al. (1993) and Pouliot et al. (1994) proposed that abdominal height is a better indicator of visceral fat and thus, it is a better marker of abdominal adiposity. In other studies, waist circumference and/or waist/hip ratio represent abdominal adiposity (Ochs-Balcom et al., 2006).
The aim of the present study was to evaluate the total body adiposity and abdominal adiposity as markers of obesity in asthmatic patients and their relation to asthma severity and Pulmonary Function Tests (PFTs).
MATERIALS AND METHODS
Inclusion criteria: The study was carried out on 70 non-smoking adult asthmatic patients who were attending the respiratory clinic of Saudi German Hospital from April 2007 to June 2008. All patients were asked to provide informed written consent on the approved study protocol.
Asthmatic patients were diagnosed by history of recurrent episodes of wheezing, breathlessness, chest tightness or cough and documented reversible airflow obstruction either spontaneously or with treatment during the preceding year. This is a cross-sectional study; the patients were classified by asthma severity into four groups according to GINA guidelines based on clinical symptoms, medication usage and pulmonary function results into (1) intermittent, (2) mild persistent, (3) moderate persistent and (4) severe persistent asthmatics (GINA Executive Committee, 2007).
Exclusion criteria: Current smokers and patients with acute chest infection or upper respiratory tract infection, refusal or inability to provide informed consent and patients who gave non-reproducible effort during PFTs measurement were excluded from the study. Also, pregnant women, patients with history of diabetes, chronic liver disease, systemic collagen diseases, anemia, heart failure or lung cancer or any other cardiopulmonary diseases were excluded from the study.
All patients enrolled in the study were subjected to:
| • | History, clinical and radiological examination to exclude other respiratory diseases |
| • | Physical measurements: Measurements were done while the patients standing. Weight was measured to the nearest 100 g using digital scales. Height was measured using a standing scale (Detecto, Miami Medical, USA). BMI was calculated from the equation: BMI = weight (kg)/[height (m)]2. The patients were categorized according to BMI into: normal weight if BMI 18.5 to <25 kg m-2, overweight if BMI≥ 25 to <30 kg m-2, obese if BMI was≥ 30 to <40 kg m-2 and morbid obesity if BMI≥ 40 kg m-2 |
The waist circumference, waist/hip ratio and abdominal height were measured. A non-stretch tape was used for the circumference measures. Waist circumference was measured at the narrowest circumference between the bottom of the ribcage and the iliac crest while the patient standing with the abdomen relaxed, at the end of a normal expiration. Where there was no natural waist-line, the measurement was taken at the level of the umbilicus. Hip circumference was measured at the maximum circumference between the iliac crest and the symphysis pubis while standing. Waist/hip ratio was then calculated from the waist and hip measures (waist circumference/hip circumference).
Abdominal height was defined as the sagittal diameter of the abdomen measured at the iliac crest in supine position. The abdominal height is strongly correlated with visceral adipose tissue when compared to CT scans and MRIs as the gold standard (Pouliot et al., 1994). We refer to body weight and BMI as total adiposity markers and abdominal height, waist circumference and waist/hip ratio as abdominal adiposity markers.
Pulmonary Function Tests (PFTs): PFTs were done by flow-volume spirometer (spiroset 3000, Germany) while the patients breathing room air. The best of 3 measurements obtained was used to calculate the: FVC%, FEV1%, FEV1/FVC, PEFR% and FEF25-75% (Sorensen et al., 1980). All values were expressed as a ratio of measured to predicted values. Measurements were done according to European Respiratory Society and American Thoracic Society recommendations (American Thoratic Society, 1987; Miller et al., 2005; Wanger et al., 2005). TLC% and FRC% were also measured for all asthmatics using (Vmax, Sensor Medics). Diffusing capacity of the lung for CO (DLCO) was measured (after adjustment for hemoglobin levels in cases with hemoglobin outside the normal range) using the single breath technique in the sitting position and with correction for lung volume (DLCO/VA) (MacIntyre et al., 2005; Horstman et al., 2007).
Statistical analysis: Continuous variables were summarized as Mean ±SD and categorical variables as percentage. Differences between groups were analyzed by multivariate analysis of variance (MANOVA) using General Linear Model (GLM) module for multiple dependent variables by 2 or more fixed factors which divide the study population into groups. We used (1) asthma severity (intermittent, mild, moderate and severe), (2) obesity category (normal weight, overweight, obese and morbid obese) and (3) gender as fixed factors and used total and abdominal adiposity markers and PFTs as dependent variables or covariates. Interactions between the groups were assessed (tests of between-subjects effects). Tukey post hoc test was used for pair-wise multiple comparisons between means for quantitative data. Kruskal-Wallis test was used for comparison among groups for nonparametric values. To investigate the individual associations of the adiposity markers with PFT parameters, we performed General Linear Model (GLM) module using MANOVA. Each adiposity markers entered into separate models as predictors (independent variables) in order to analyze their contribution to the variation in the PFTs (dependent variables) with adjustment to age, height and gender (covariates) to calculate F-value and R2. The correlation was done by Pearson correlation test with measurement of r-statistic and p values which were based on a 2-tailed test of statistical significance. Statistical analysis was done using SPSS 10 software for windows (SPSS Inc, Chicago, IL) and Med Calc software version 9. Significance was taken as p<0.05.
RESULTS
Seventy adult non-smoking asthmatic patients were studied. The mean age was 38.6 ±11.8 (ranged from 18-62 years), 30 patients (42.9%) were male (Fig. 1).
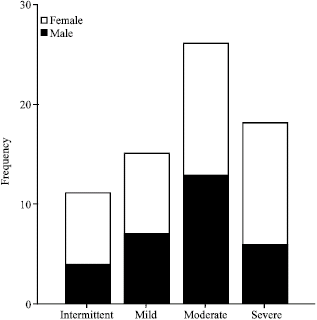 | |
| Fig. 1: | The asthmatic groups categorized by gender |
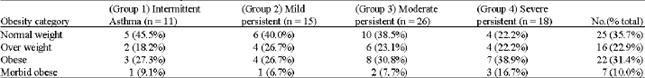
Patients were classified according to asthma severity into: Group 1 (intermittent) 11 patients, Group 2 (mild persistent) 15 patients, Group 3 (moderate persistent) 26 patients and Group 4 (severe asthma) 18 patients. The asthmatic patients were categorized by BMI into: 25 normal weight, 16 overweight, 22 obese and 7 morbidly obese patients. There were no statistical significant differences for the obesity categories among the asthmatic groups (p = 0.436) (Table 1).
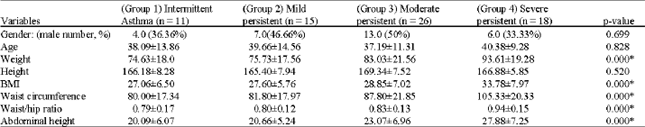
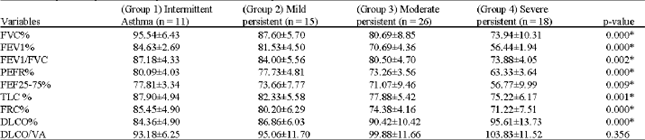
Comparisons among the asthmatic groups: Comparisons among the asthmatic groups were done using MANOVA with post hoc test, comparing Group 1 with Group 2-4, Group 2 with Group 3, 4 and 3 with Group 4 for all the studied variables. There was no statistical significant difference among the 4 asthmatic groups for the age, gender, height and DLCO/VA with p values (0.828, 0.699, 0.520 and 0.356, respectively) (Table 2, 3).
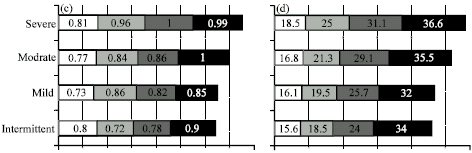
For the adiposity markers, there was statistical significant increase in the mean values of weight and abdominal height with increasing severity of asthma in comparisons among the four groups (p<0.01) except between Group 1 and 2 there was no statistical significant differences (p>0.05). Also statistical significant increase in the mean values of BMI, waist circumference, waist/hip ratio in Group 4 when compared to Group 1-3 with p<0.01, otherwise, there was no statistical significant differences among other groups (p>0.05) (Table 2, Fig. 2a-d, 3a-d).
For the PFT parameters, there was decrease in the mean values of FVC%, FEV1%, FEV1/FVC, PEFR%, FEF25-75%, TLC% and FRC% and increase in DLCO% and DLCO/AV with increasing asthma severity in obese asthmatics.
| Table 1: | The classification of the asthmatic patients |
 | |
| Table 2: | The demographic data and physical measurements of the asthmatic patients |
 | |
| Mean ±SD. No. (%), *Highly statistically significant: p<0.01 | |
| Table 3: | The pulmonary function test parameters of the asthmatic patients |
 | |
| Mean ±SD. *Highly statistically significant: p<0.01 | |
There was statistical significant decrease in FVC%, FEV1%, FEV1/FVC and PEFR% among the asthmatic groups with increasing asthma severity (p<0.01) except between Group 1 and 2 for the last 3 parameters and between Group 2 and 3 for the FEV1/FVC (p>0.05). Comparing FEF25-75% among all the groups revealed statistical significant decrease in Group 4 when compared to Group 1-3 (p<0.01) (Table 3, Fig. 3).
Also, significant decrease in the TLC% and FRC% was found in Group 4 when compared to Group 1 and 2 and significant decrease in Group 3 when compared to Group 1 and 2 for the FRC% and between Group 3 and 1 for the TLC% (p<0.01). Otherwise, there were no statistical significant differences among the asthmatic groups (p>0.05).
There was statistical significant increase in DLCO% in Group 4 when compared to Group 1-3 (p<0.05). Also, significant increase in DLCO% in Group 3 when compared to Group 1 (p = 0.019), otherwise there were no statistical significant differences among the asthmatic groups (p>0.05).
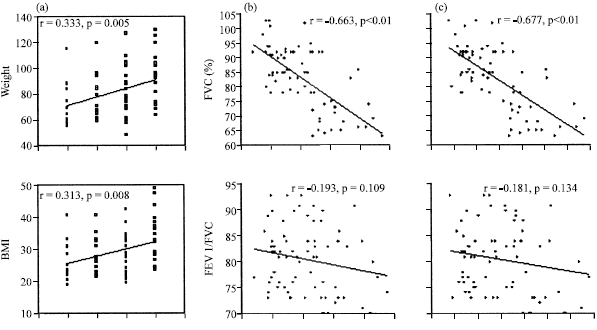
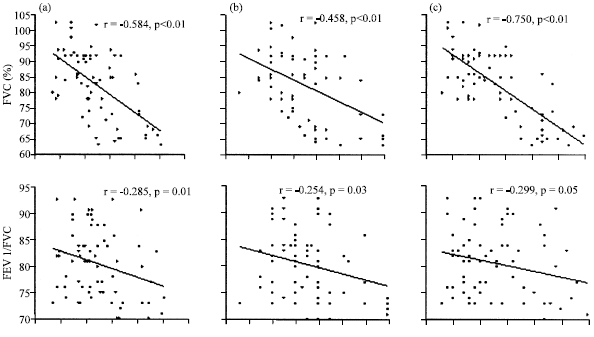
The correlation analysis: The present study showed significant direct linear correlations of asthma severity with weight, BMI, waist circumference, waist/hip ratio and abdominal height (p<0.01). Significant inverse correlations were found between both weight and BMI with the (FVC%, FEV1%, PEFR%, TLC% and FRC%) (Fig. 4a-c). Also, significant inverse correlations between each of the abdominal adiposity markers with (FVC%, FEV1%, FEV1/FVC, PEFR%, FEF25-75%, TLC% and FRC%) (Fig. 5a-c). There were significant direct linear correlations between both DLCO% and DLCO/AV with all total and abdominal adiposity markers (p<0.01) (Fig. 4, 5).
The study showed significant inverse correlations between obesity category (normal weight, overweight, obese and morbid obese) with FVC%, FEV1%, TLC% and FRC%, (r: -0.603, -0.245, -0.361 and -0.279), (p<0.01, 0.041, 0.002 and 0.019, respectively) and direct linear correlations between obesity category with DLCO% and DLCO/AV (r: 0.686 and 0.447, respectively) (p<0.01).
The multivariate analysis of the adiposity markers with PFTs: As overall, there were negative associations of each adiposity marker with the FVC%, FEV1%, FEV1/FVC, PEFR%, FEF25-75%, TLC% and FRC% and positive associations with DLCO% and DLCO/VA. The individual associations of each adiposity markers (weight, BMI, waist circumference, waist/hip ratio and abdominal height) with the PFT parameters were performed by general linear model (GLM) using MANOVA.
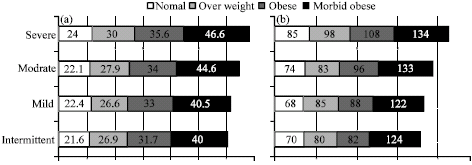 | |
| Fig. 2: | Significant increase in the adiposity markers: (a) BMI, (b) waist circumference, (c) waist/hip ratio and (d) abdominal height in the asthmatic groups (intermittent, mild, moderate and severe) with the increase in asthma severity (p<0.01), with the mean values for each subgroup according to obesity category (normal weight, overweight, obese and morbid obese) |
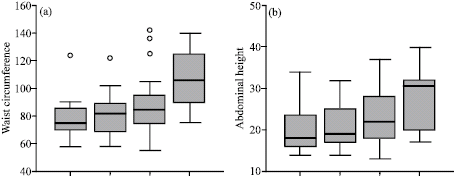 | |
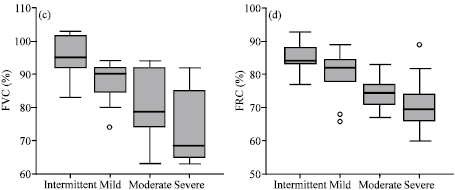
| Fig. 3: | The significant increase in the mean values of (a) waist circumference, (b) abdominal height, (c) decrease in FVC% and (d) FRC% in comparisons among the 4 asthmatic groups with increasing asthma severity (p<0.01) |
The weight showed significant associations with FVC% and DLCO% (p<0.05). For the abdominal adiposity markers there was statistical significant associations between waist circumference with (FVC%, FEV1%, PEFR%, FEF25-75%, TLC%,FRC% and DLCO%) and between waist/hip ratio with (FVC%, FEF25-75% and DLCO/VA) and between abdominal height with (FVC%, TLC%, FRC% and DLCO%) (p<0.05). Otherwise, there was no statistical significant contribution of the other markers in the variation of the PFTs (p>0.05) (Table 4).
 | |
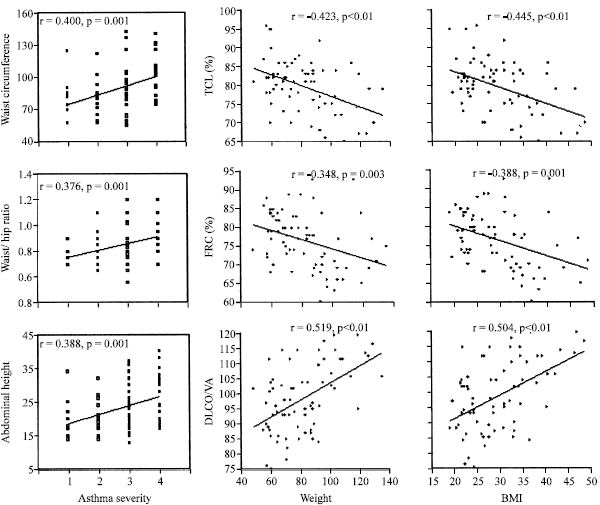 | |
| Fig. 4: | (a) Significant direct linear correlations between asthma severity (1: intermittent, 2: mild, 3: moderate and 4: severe) with weight, BMI, waist circumference, waist/hip ratio and abdominal height were found with (r: 0.333, 0.313, 0.40, 0.376 and 0.388, respectively, p<0.01); (b) Correlation between weight with FVC%, FEV1/ FVC, TLC%, FRC% and DLCO/AV (r: -0.663, -0.193, -0.423, -0.348 and 0.519, respectively, p<0.01 except FEV1/FVC p = 0.109) and (c) correlation of BMI with the same PFTs with (r: -0.677, -0.181, -0.445, -0.388 and 0.504, respectively, p<0.01 except FEV1/FVC had p = 0.134) |
 | |
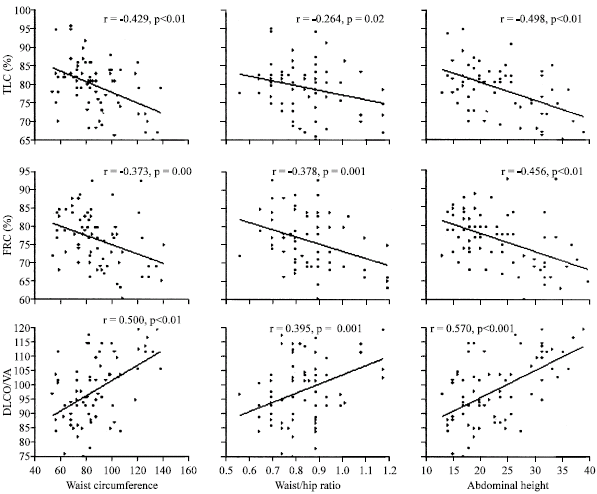 | |
| Fig. 5: | Correlation of the abdominal adiposity markers: waist circumference, waist/hip ratio and abdominal height with PFTs (FVC%, FEV1/FVC, TLC%, FRC% and DLCO/AV): (a) The r values were -0.584, -0.285, -0.429, -0.373 and 0.500, respectively for the waist circumference (p = 0.01); (b) -0.458, -0.254, -0.264, -0.378 and 0.395, respectively for the waist/hip ratio (p<0.01 except FEV1/FVC and TLC% had p<0.05) and (c) -0.750, -0.229, -0.498, -0.456 and 0.570, respectively, for the abdominal height (p<0.01 except FEV1/FVC had p = 0.05) |
| Table 4: | The multivariate analysis of adiposity markers entered into separate models predicting the association with PFTs parameters† |
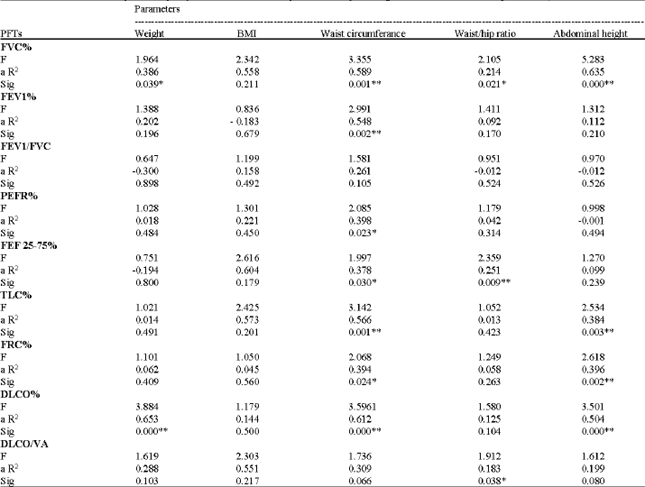 | |
| †Each model was adjusted for age, height and gender, a R2: Adjusted regression coefficients, * p<0.05, ** p<0.01 | |
DISCUSSION
In recent years, there is a parallel increase in the prevalence of both asthma and obesity. The WHO predicts that, by 2015, around 700 million adults will be obese. However many published studies were done, still the etiological link between asthma and obesity is not known. It remains to be determined if asthma causes obesity, if obesity causes asthma, or if obesity is an independent factor that affects adversely on respiratory mechanics and causes asthma-like symptoms and PFT abnormalities. Some investigators had found that obesity is suspected to be a risk factor for asthma as an etiological relation. As certain mediators such as leptins may affect airway function and increase the asthma development (Beuther et al., 2006), others attributed to changes in T-cell function and increased pro-inflammatory cytokines. TNFa was also implicated in the relationship between obesity and asthma with many supporting evidences in mice and humans (Cho et al., 2001; Chinn, 2003).
Obesity is more common in moderate to severe asthmatics. The present study showed reduced FVC%, FEV1%, FEV1/FVC, PEFR%, FEF25-75%, TLC%, FRC% and increased DLCO% and DLCO/AV with increasing asthma severity in obese asthmatics which was nearly almost associated with the increase in obesity category. Both total adiposity markers (weight, BMI) and abdominal adiposity markers (waist circumference, waist/hip ratio and abdominal height) showed statistical significant increase with increasing severity of asthma in comparisons among the four groups. These findings coincide with some studies. Despite different study populations, there was general agreement that obesity alone, even morbid obesity, has relatively little effect on VC or TLC. However, FRC and ERV can be severely decreased (Rubinstein et al., 1990; Li et al., 2003), as a result of the altered chest wall mechanics in obesity (Luce, 1980). One study showed that mild obesity decreases FRC and ERV in patients with cardiovascular disease (Jenkins and Moxham, 1991), but Sahebjami (1998) Ebeo et al. (2002) reported that much more severe obesity is required to decrease FRC and ERV.
Jones and Nzekwu (2006) studied the effects of BMI on lung volumes in patients with normal values of airway function and found that physicians can expect with each unit increase in BMI, an approximate 0.5% decrease in VC, TLC and RV and 0.3% increase in DLCO. Using the linear regressions, FRC and ERV decrease approximately 3 and 5%, respectively, for each unit increase in BMI from 20 to 30 kg m-2. Above a BMI of 30 kg m-2, both FRC and ERV decrease approximately 1% for each unit increase in BMI. The researchers concluded that BMI has significant effects on all lung volumes and the greatest effects were on FRC and ERV, which occurred at BMI values <30 kg m-2. Also, Lessard et al. (2008) found that TLC, ERV and FRC were lower in obese than in non-obese asthmatics.
In the current study, significant direct linear correlations were found between asthma severity with total and abdominal adiposity markers and significant inverse correlations between obesity category in the asthmatics (normal weight, overweight, obese and morbid obese) with FVC%, FEV1%, TLC% and FRC% which agreed with McClean study (McClean et al., 2008) and direct linear correlations between obesity category with DLCO% and DLCO/AV. Adjusting DLCO for lung volume using DLCO/VA or DLCO/ TLC is controversial (Hughes and Pride, 2001). Interpreting the DLCO in conjunction with spirometry and lung volumes may assist in diagnosing the underlying disease, as the relationship between DLCO and lung volume is not linear. A high DLCO is associated with asthma, obesity and intrapulmonary hemorrhage (Collard et al., 1994, 1996). Obesity has been associated with higher blood volume and cardiac output which will increase the capillary blood volume and may thereby increase DLCO (Karason et al., 1998). Present study agreed with Baylor and Goebel (1996) that studied 18 patients with high DLCO/VA ratio and attributed the increased DLCO/VA ratio in 16 patients to a reduced vital capacity secondary to obesity or diaphragmatic dysfunction. In a different study the DLCO and DLCO/VA ratio were within normal range and there was no correlation to weight/height ratio (Biring et al., 1999). Asthma also has been reported as a cause for increased DLCO and DLCO/VA ratio. Different mechanisms have been postulated including overestimation of DLCO due to airflow obstruction (Graham et al., 1984), increased perfusion of the lung apices due to increased pulmonary arterial pressure or more negative pleural pressure as a consequence of bronchial narrowing (Collard et al., 1994).
In the present study, the interactions between each adiposity marker with PFTs were analyzed (with adjustment to age, height and gender) and revealed statistical significant associations specifically for the abdominal adiposity markers with most PFTs, as found between waist circumference with (FVC%, FEV1%, PEFR%, FEF25-75%, TLC%, FRC%, DLCO%), between waist/hip ratio with (FVC%, FEF25-75%, DLCO/VA) and between abdominal height with (FVC%, TLC%, FRC%, DLCO%). Only weight as a total adiposity marker showed significant associations with FVC% and DLCO%. These results support the hypothesis that abdominal adiposity markers are more important and specific predictor of obesity than total adiposity markers on the variations of PFTs in obese asthmatics. The waist circumference estimates the amount of abdominal (central) fat, while hip circumference is used to estimate fat content in areas other than the abdomen (peripheral fat). The waist/hip ratio helps to compare the amount of central to peripheral fat. Sutherland et al. (2008) studied the effect of adiposity measured by dual-energy X-ray absorptiometry on lung function and confirmed that there is a significant effect of adiposity on respiratory function. Some differences in the effect of adiposity on respiratory function between the sexes have been demonstrated. Furthermore, lean mass has a positive effect on respiratory function in males but not in females.
Present study is in agreement with Ochs-Balcom et al. (2006) that investigated the association of total body adiposity and abdominal adiposity with FEV1 and FVC in a random sample of the normal population. They hypothesized that a specific effect of fat distribution on pulmonary function exists. In particular, a greater accumulation of abdominal fat is associated with lower levels of FEV1 and FVC and that abdominal fat is a better predictor of reduced pulmonary function than total body adiposity. They found that abdominal height, a marker for visceral adiposity, explained the greatest amount of variance in PFT among all other adiposity markers.
CONCLUSION
Increased obesity is more common in moderate to severe asthmatics with significant increase in the adiposity markers and direct linear correlation with increasing asthma severity. Increase in obesity category is associated with reduced lung volumes and flows and increase in diffusion capacity of the lung in the obese asthmatics. The abdominal adiposity markers as waist circumference, waist/hip ratio and abdominal height are more significant and effective predictors of obesity than total adiposity markers (weight and BMI) on the variations of PFTs in obese asthmatics.
REFERENCES
- American Thoracic Society, 1987. Standardization of spirometry--1987 update. Statement of the American Thoracic Society. Am. Rev. Respir. Dis., 136: 1285-1298.
PubMed - Baylor, P. and P. Goebel, 1996. Clinical correlates of an elevated diffusing capacity for carbon monoxide corrected for alveolar volume. Am. J. Med. Sci., 311: 266-271.
PubMed - Beasley, R., J. Crane, C.K. Lai and N. Pearce, 2000. Prevalence and etiology of asthma. J. Allergy Clin. Immunol., 105: S466-S472.
PubMed - Beuther, D.A., S.T. Weiss and E.R. Sutherland, 2006. Obesity and asthma. Am. J. Respir. Crit. Care Med., 174: 112-119.
PubMed - Biring, M.S., M.I. Lewis, J.T. Liu and Z. Mohsenifar, 1999. Pulmonary physiologic changes of morbid obesity. Am. J. Med. Sci., 318: 293-297.
PubMed - Chinn, S. and R.J. Rona, 2001. Can the increase in body mass index explain the rising trend in asthma in children? Thorax, 56: 845-850.
PubMed - Cho, H.Y., L.Y. Zhang and S.R. Kleeberger, 2001. Ozone-induced lung inflammation and hyperreactivity are mediated via tumor necrosis factor-alpha receptors. Am. J. Physiol. Lung Cell Mol. Physiol., 280: L537-L546.
PubMed - Collard, P., B. Njinou, B. Nejadnik, A. Keyeux and A. Frans, 1994. DLCO in stable asthma. Chest, 105: 1426-1429.
PubMed - Collard, P., J.Y. Wilputte, G. Aubert, D.O. Rodenstein and A. Frans, 1996. The DLCO in obstructive sleep apnea and obesity. Chest, 110: 1189-1193.
PubMed - Figueroa-Munoz, J.I., S. Chinn and R.J. Rona, 2001. Association between obesity and asthma in 4-11 year old children in the UK. Thorax, 56: 133-137.
PubMed - Flegal, K.M. and R.P. Troiano, 2000. Changes in the distribution of body mass index of adults and children in the US population. Int. J. Obes. Relat. Metab. Disord., 24: 807-818.
PubMed - Graham, B., J.T. Mink and D.J. Cotton, 1984. Overestimation of the single breath carbon monoxide diffusing capacity in patients with air-flow obstruction. Am. Rev. Respir. Dis., 129: 403-408.
PubMed - Horstman, M.J., F.W. Mertens, D. Schotborg, H.C. Hoogsteden and H. Stam, 2007. Comparison of total-breath and single-breath diffusing capacity in healthy volunteers and COPD patients. Chest, 131: 237-244.
PubMed - Hughes, J.M. and N.B. Pride, 2001. In defence of the carbon monoxide transfer coefficient KCO (TL/Va). Eur. Respir. J., 17: 168-174.
PubMed - Jenkins, S.C. and J. Moxham, 1991. The effects of mild obesity on lung function. Respir. Med., 85: 309-311.
PubMed - Jones, R.L. and M.M. Nzekwu, 2006. The Effects of body mass index on lung volumes. Chest, 130: 827-833.
PubMed - Karason, K., I. Wallentin, B. Larsson and L. Sjostrom, 1998. Effects of obesity and weight loss on cardiac function and valvular performance. Obes. Res., 6: 422-429.
PubMed - Li, A.M., D. Chan, E. Wong, J. Yin and E.A.S. Nelson et al., 2003. The effects of obesity on pulmonary function. Arch. Dis. Child., 88: 361-363.
PubMed - Luder, E., R.I. Ehrlich, W.Y. Lou, T.A. Melnik and M. Kattan, 2004. Body mass index and the risk of asthma in adults. Respir. Med., 98: 29-37.
PubMed - MacIntyre, N., R.O. Crapo, G. Viegi, D.C. Johnson and C.P.M. Van der Grinten et al., 2005. Standardization of the single-breath determination of carbon monoxide uptake in the lung. Eur. Respir. J., 26: 720-735.
PubMed - McClean, K.M., F. Kee, I.S. Young and J.S. Elborn, 2008. Obesity and the lung: Epidemiology. Thorax, 63: 649-654.
PubMed - Miller, M.R., J. Hankinson, V. Brusasco, F. Burgos and R. Casaburi et al., 2005. Standardization of spirometry. Eur. Respir. J., 26: 319-338.
PubMed - Pouliot, M.C., J.P. Despres, S. Lemieux, S. Moorjani and C. Bouchard et al., 1994. Waist circumference and abdominal sagittal diameter: Best simple anthropometric indexes of abdominal visceral adipose tissue accumulation and related cardiovascular risk in men and women. Am. J. Cardiol., 73: 460-468.
CrossRefPubMedDirect Link - Rubinstein, I., N. Zamel, L. DuBarry and V. Hoffstein, 1990. Airflow limitation in morbidly obese, nonsmoking men. Ann. Intern. Med., 112: 828-832.
PubMed - Sorensen, J.B., A.H. Morris, R.O. Crapo and R.M. Gardner, 1980. Selection of the best spirometric values for interpretation. Am. Rev. Respir. Dis., 122: 802-805.
PubMed - Sutherland, T.J.T., A. Goulding, A.M. Grant, J.O. Cowan and A. Williamson et al., 2008. The effect of adiposity measured by dual-energy X-ray absorptiometry on lung function. Eur. Respir. J., 32: 85-91.
PubMed - Van der Kooy, K., R. Leenen, J.C. Seidell, P. Deurenberg and M. Visser, 1993. Abdominal diameters as indicators of visceral fat: Comparison between magnetic resonance imaging and anthropometry. Br. J. Nutr., 70: 47-58.
PubMed - Wanger, J., J.L. Clausen, A. Coates, O.F. Pedersen and V. Brusasco et al., 2005. Standardization of the measurement of lung volumes. Eur. Respir. J., 26: 511-522.
PubMed - Woolcock, A.J. and J.K. Peat, 1997. The rising trends in asthma. Ciba Foundation Symposium, 206: 122-139.
CrossRef