
H. Kamalan
Islamic Azad University, Pardis Branch, Iran
M. Sabour
K.N. Toosi University of Technology, Iran
N. Shariatmadari
Iranian University of Science and Technology, Iran
Journal of Environmental Science and Technology
Year: 2011 | Volume: 4 | Issue: 2 | Page No.: 79-92


ABSTRACT
Landfill Gas (LFG) is classified as the main source of methane, a greenhouse gas, caused by human activities. On the other hand methane is an important energy element. Also, it can cause fires in landfill. On these bases, estimation of methane generated out of landfills has been highly important to scientists, decision makers and owners of landfills. The purpose of this study is to review most used models which predicts LFG. As a result, these models can be classified in zero order, first order and second order decay, mathematical and numerical models. First order decay models, which are used more all over the world, has been considered in more details as multiphase models which result in more appropriate estimations. However, numerical models can lead to more accurate results.
PDF Abstract XML References Citation
Received: May 26, 2010;
Accepted: June 04, 2010;
Published: August 21, 2010
How to cite this article
H. Kamalan, M. Sabour and N. Shariatmadari, 2011. A Review on Available Landfill Gas Models. Journal of Environmental Science and Technology, 4: 79-92.
DOI: 10.3923/jest.2011.79.92
URL: https://scialert.net/abstract/?doi=jest.2011.79.92
DOI: 10.3923/jest.2011.79.92
URL: https://scialert.net/abstract/?doi=jest.2011.79.92
INTRODUCTION
Environment and natural resources can be polluted and consequently human beings, animals and plants can be impacted (Sabour et al., 2007). So, waste management plays a key role in human’s life (Kamalan, 2007). Sanitary landfilling, a common method for the disposal of solid waste (Chen et al., 2003), is recognized as an important source of methane which is the major component of greenhouse gases (Kamalan, 2009). Atmospheric methane concentrations have doubled over the last 200 years and continue to rise, although the rate of increase is slowing. By mass, methane has 21 times the global warming potential of carbon dioxide over a 100 year time frame (Shariatmadari et al., 2007). On this basis, There are lots of regulatory to manage and/or estimate the landfill methane gas such as the Protocol on Pollutants Release and Transfer Registers (also known as PRTRs- or Kiev-protocol) (Scharff and Jacobs, 2006). In addition, methane has got a great deal amount of energy which encourages decision makers and scientists to estimate and use it (Sabour and Kamalan, 2006).
Above mentioned issues have leaded to develop landfill gas estimations models. Most of these models have been developed on Monod equation, first order decay, such as TNO, LandGEM, Gassim, Afvalzorg, EPER, IPCC, LFGEEN. Some of them are based on Monod equation, zero order decay, such as EPER France. Few models to predict methane from landfills are based on the sequential biological growth such as Halvadakis model (Nastev, 1998). Some newly developed models are numerical ones such as weighted residual and neural network (Ozakaya et al., 2006; Shariatmadari et al., 2007). This study aims to review all these available models, their advantages and disadvantages and provide guidance for scientists, decision makers and researchers.
AVAILABLE MODELS
There are two particular approaches for mathematical presentation of the gas production rate: (1) gas production rate is given as a simple empirical function or as a combination of simple functions of an overall kinetic parameter, (2) models where the gas production rate is given as a complex sum of mathematical functions representing the individual kinetics of the considered physico-chemical processes occurring during refuse biodegradation and (3) numerical models which interpret gas production in digits.
As it has been mentioned, some models work with overall kinetic parameter which is the most common type of models encountered in the literature (Cheremisinoff and Morresi, 1976; Findikakis and Leckie, 1979; Hartz and Ham, 1982; EMCON Associates, 1982; Van Heut, 1986; Gardner and Probert, 1993). The overall kinetic parameter is empirically adjusted to match the observed production rates. A start-up period during which little or no methane is produced may be assumed, it is followed by a period of active methane production represented mostly by linear or exponential relations, or their combinations. Figure 1a and b show this issue at a glance. The cumulative gas production can then be obtained as a sum of the gas production rates over the active production period and should correspond to the assumed initial production potential of the landfill.
A theoretical approach for the derivation of most of these relatively simple models is based on the general kinetic expression for the biodegradation processes well known as Monod’s equation as following form:
| (1) |
where, C is the remaining concentration of substrate at time t, such as organic matter, organic carbon (mass of carbon per unit volume/mass of refuse), x is the concentration of microorganisms (kg microorganisms per m3 refuse), K is the maximum rate of substrate utilization per kg of microorganisms, KC is the refuse concentration at which the rate is one-half the maximum rate of substrate utilization.
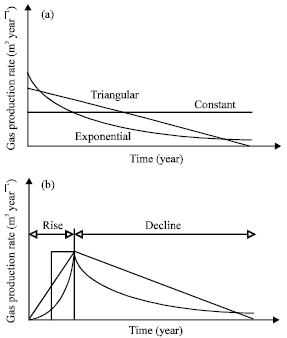 | |
| Fig. 1: | Presentation of gas production rate with time, (a) simple functions and (b) combinations (Nastev, 1998) |
Monod’s equation can be approximated by the following functions in the two extreme cases: (1) zero-order reaction with respect to substrate concentration: for large C, the substrate utilization rate dC/dt is constant if the concentration of the microorganisms, x, remains constant and (2) first-order reaction with respect to the substrate concentration: for small C and assuming again constant concentration of microorganisms, x = constant, the substrate utilization rate is then a linear function of the substrate concentration.
Zero order: In this kind of model, biogas generated from landfills is remained steady against time. On this basis, waste age and waste type has no effect on gas production.
EPER Germany: The EPER model used in Germany is a zero order model as shown in Eq. 2 (Scharff and Jacobs, 2006).
| (2) |
where, Me is amount of diffuse methane emission, M is annual amount of landfilled waste, BDC is proportion of biodegradable carbon (0.15), BDCf is proportion of biodegradable carbon converted (0.5), F is calculation factor of carbon converted into CH4 1.33, D is collection efficiency: active degassing 0.4, no recovery 0.9, active LFG recovery and cover 0.1 and C is methane concentration 0.50.
In fact, if a constant amount of waste of constant composition is disposed in a landfill, the result is the same as for a first-order degradation model.
SWANA zero order: SWANA has developed a zero order model in which kind of waste has been considered as Eq. 3 (SWANA, 1998):
| (3) |
where, Q is methane generation rate, M is the waste in place, Lo is methane generation potential, to is lag time and tf is time to end point of generation.
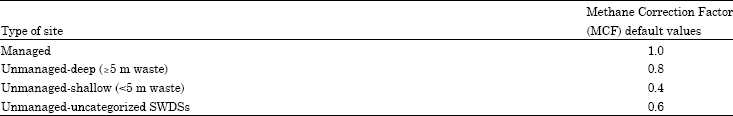
IPCC: IPCC provides a zero order model based on population, degradable material within the waste and methane correction factor as represented in Eq. 4 (IPCC, 1996):
| (4) |
where, MSWT is total MSW generated, MSWF is fraction of MSW disposed to solid waste disposal sites, MCF is methane correction factor, DOC is degradable organic carbon, DOCF is fraction DOC dissimilated, F is fraction of CH4 in landfill gas (default is 0.5), R is recovered CH4 and OX is oxidation factor (fraction-default is 0).
| Table 1: | MCF parameter in IPCC model |
 | |
| Table 2: | DOC parameter in IPCC model |
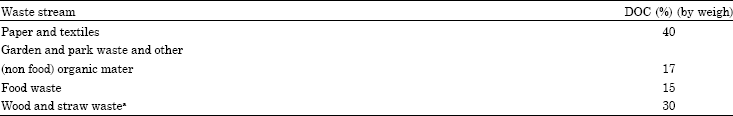 | |
aExcluding lignin c | |
Total MSW (MSWT) can be calculated from Population (thousand persons) multiple by annual MSW generation rate. Per capita MSW generation rates are provided for many countries and regions in related tables. The components of MSW may vary from country to country. These differences can play an important role in the resulting emissions estimate, as each waste stream may have a different DOC content and hence a different CH4 generation potential. In general, countries should include the following waste streams in their estimate of total MSW generated.
| • | Household waste |
| • | Yard and garden waste |
| • | Commercial or market waste |
The MCF and DOC have been calculated for different situation and classes as shown in Table 1 and 2.
First order: Just about all available and worldwide-used models which predict biogas from landfills are among ones developed based on first order decay models. These models have been considered quality of waste (i.e., moisture content, carbon content, age of waste and ability of waste to be digested), waste quantity and condition of landfill (i.e., climate, temperature, precipitation) implicitly. In the order words, the effect of depletion of carbon in the waste through time is accounted for in a first-order model (Ozakaya et al., 2006).
First order models always assume a direct relation with carbon content of the waste and exponential function of decay rate by time against generated methane (Gardner and Probert, 1993).
SWANA: The effect of waste age on gas production is incorporated in the first order model. For each unit amount of waste, landfill gas generation rates decline exponentially. This model can be represented by Eq. 5 (SWANA, 1998):
| (5) |
where, k is first-order rate constant.
TNO: TNO model calculates LFG generation based on degradation of organic carbon in the waste as shown in Eq. 6 (Scharff and Jacobs, 2006):
| (6) |
where αt is landfill gas production at a given time, ς is dissimilation factor 0.58, 1.87 conversion factor, A is amount of waste in place, Co is amount of organic carbon in waste and k1 degradation rate constant 0.094.
Amount of organic carbon in waste (Co) has been classified in eight categories as contaminated soil, construction and demolition waste, shredder waste, street cleansing waste, contaminated soil, construction and demolition waste, shredder waste, street cleansing waste, sewage sludge and compost, coarse household waste, commercial waste, household waste, sewage sludge and compost, coarse household waste, commercial waste, household waste as 11, 11, 130, 90, 90, 130, 11 and 130 kgC Mg-1, respectively.
LandGEM: USEPA has developed software with the name of LandGEM which uses almost the same formula for municipal solid waste. LandGEM uses the first order decomposition rate equation to estimate annual emissions over a specified time period (EPA, 2005) as presented in Eq. 7.
| (7) |
where, Mi is the waste in placed in specific time of t.
US-EPA protocols state that the composition of waste used in the model reflects US waste composition of MSW, inert material and other non-hazardous wastes. For a landfill containing non-biodegradable waste (i.e., inert material), such as ash from waste combustion, this portion may be subtracted from the waste acceptance rates. LandGEM recommends subtracting inert materials only when documentation is provided and approved by a regulatory authority. This is not recommended for sites that are typical MSW landfills containing a range of waste that may or may not be degradable. LandGEM provides methane generation constant and potential for both CAA (Clean Air Act) and AP42 standards. It is recommended to use AP42 default values for standard landfills. CAA default values have a high methane generation potential (L0) of 180 m3CH4 Mg-1 waste (Scharff and Jacobs, 2006).
LandGEM is based on the first-order decomposition rate equation and the inputs are:
| • | Design capacity of the landfill |
| • | Amount of waste in place or the annual acceptance rate |
| • | The methane generation rate constant k and methane generation potential Lo |
| • | The concentration of total and individual NMOC |
| • | The years of waste acceptance |
| • | Acceptance of hazardous waste at the landfill |
Default values for k and Lo can be used or site-specific values can be developed through field test measurement.
Outputs of LandGEM are as follows (Thorneloe et al., 1999):
| • | Emission rate for methane, NMOCs and selected air pollutants can be estimated annually over the life of the landfill and for a specific number of years after the landfill closure |
| • | Two sets of default values for emissions calculations are incorporated in the model. The first set is for determining the applicability of Federal regulatory requirements (Clean Air Act defaults) and another for developing emission inventories (AP-42 defaults) |
| • | Landfill closure estimates based on the landfill capacity and waste acceptance rate |
| • | Emissions for individual pollutants |
| • | Graphs of emissions for individual pollutants |
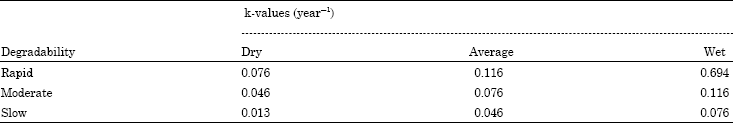
GasSim: GasSim uses first order decay equation based on a multiphase model described by Scheepers and van Zanten (1994). There in no complete set of equations used in GasSim in the manual Version 2.0 (Golder Associates, 2006). Calculation modules in the program are protected. It was therefore not possible to reproduce the equations in this study. This model requires waste input in Mg and the specific breakdown during the particular year of disposal. The waste categories and their carbon content used in the GasSim multiphase model are presented in Table 3. To give an impression, degradation rates, k values and fractions of the GasSim multiphase model are shown in Table 4 (Scharff and Jacobs, 2006).
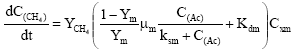
Afvalzorg: Afvalzorg is another multiphase model on predicting LFG production which takes advantage of considering 8 waste categories and three fractions. Each fraction is contemplated separately for purposes of LFG production estimation. In the Afvalzorg multiphase model, eight waste categories and three fractions are distinguished. For some waste categories, no organic matter or carbon content data were available (Scharff and Jacobs, 2006).
| Table 3: | Waste categories and organic carbon content of the GasSim |
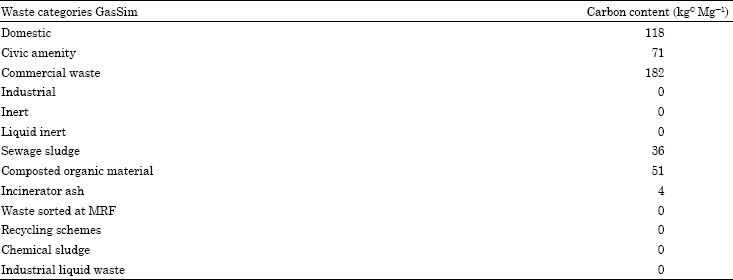 | |
| Table 4: | Degradation rate, k values and fractions of the GasSim multiphase model |
 | |
| Table 5: | Organic matter content used in the Afvalzorg multi-phase model |
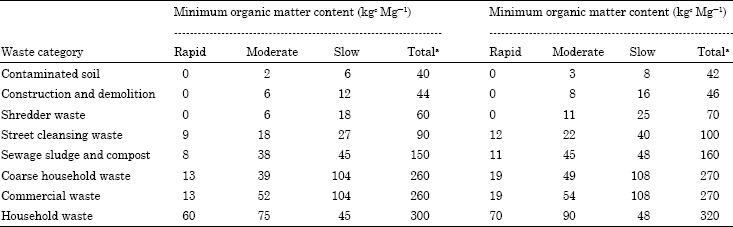 | |
| aOnly rapidly, moderately and slowly degradable organic matter has been taken into consideration, The total organic matter content is higher than tl sum of these three categories due to the presence of organic matter that is not considered biodegradable under anaerobic conditions. Examples are hum substances, lignin and plastics | |
The multiphase model is a first order model and can be described mathematically by Eq. 8. Amount of organic content has been shown in Table 5 (Shariatmadari et al., 2007):
| (8) |
where, αt is landfill gas formation at a time t, ς is dissimilation factor, i is waste fraction with degradation rate k1,i, A is amount of waste in place, k1,i is degradation rate constant of fraction i (which is between 0.03 and 0.231).
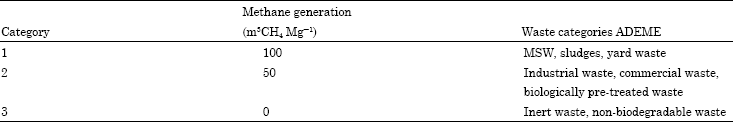
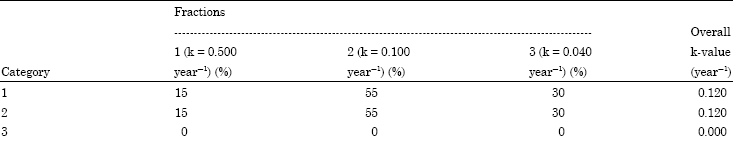
EPER France: Methane emissions estimates for landfill cells connected or not connected to an LFG recovery system using a multiphase model (ADEME version 15/12/2002) and the LFG recovery efficiency is the concept of EPER France model. The formulation of this model is multiphase one as Eq. 9.
| (9) |
where, FECH4 is annual methane production, FE0 is methane generation potential, pi is waste fraction with degradation rate ki, Ai is normalization factor.
The dimensions left and right in the equation do not match. It would seem that the amount of waste in Mg year-1 is missing on the right-hand side. In the spreadsheet itself, the annual amounts of waste are used in the calculation. Although, a normalization factor is given in the equation, it seems that this factor is not included in the spreadsheet. The model describes three categories of waste and every category has a specific methane generation capacity per Mg of waste. The three categories, their specific methane generation capacities are shown in Table 6. Fractions and k values for each waste category are shown in Table 7 (Scharff and Jacob, 2006).
| Table 6: | Waste categories and methane generation capacity of the ADEME model |
 | |
| Table 7: | Fractions and k values of the ADEME multi-phase model |
 | |
| Table 8: | Methane generation rate (k) |
 | |
| Table 9: | Potential methane generation capacity (L0) |
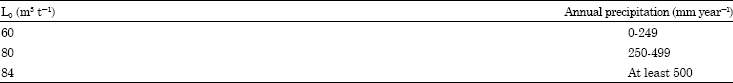 | |
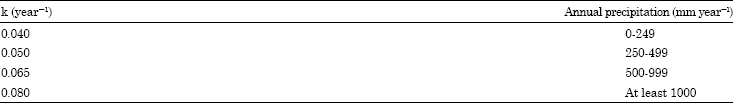
Mexico: The model assumes a one-year time lag between placement of waste and LFG generation. For each unit of waste, after one year the model assumes that methane generation decreases exponentially as the organic fraction of waste is consumed. For sites with known (or estimated) year-to-year solid waste acceptance rates, the model estimates the LFG generation rate in a given year using the Eq. 10, which is published in Title 40 of the US Code of Federal Regulations (CFR) Part 60 (Stege and Murray, 2003). Mexico LFG model can be described as Eq. 10 (Stege and Murray, 2003):
| (10) |
The Mexico LFG model requires site-specific data for all the information needed to produce generation estimates, except for the k and L0 values. In fact, the model provides default values for k and L0. The default values are based on site specific data gathered from representative landfills in Mexico and the relationship between the k and L0 values and average annual precipitation observed at landfills in the US (Stege and Murray, 2003) as presented in Table 8 and 9, respectively.
The composition of Municipal Solid Waste (MSW) landfill gas is assumed by the model to be about 50% methane (CH4) and 50% other gases, including carbon dioxide (CO2) and trace amounts of other compounds.
LFGGEN: This model was firstly developed at the University of Central Florida (Keely, 1994). The assumptions for this model are: (1) methanogenesis is preceded by a lag phase, (2) the first stage of methanogenesis is represented by a linearly increasing generation rate and (3) the second stage of methanogenesis is represented by first-order kinetics, with an exponentially decreasing generation rate. The model has some additional features, which are (Reinhart and Faour, 2004):
| • | Methods of analysis provided are the following: theoretical stoichiometric generation of methane and carbon dioxide, biodegradability factors, Biochemical Methane Potential (BMP) and EPA Tier 3 |
| • | Biodegradable solid waste is divided into eleven categories |
| • | Moisture is classified into three categories; wet, moderate and dry |
| • | Biodegradability rates are classified into three categories; rapid, moderate and slow |
Biodegradability rates are also a function of moisture.
This model includes a time delay to, to establish anaerobic conditions, followed by a linear increase to a specific peak rate, QS, that occurs at the end of year, tP. After the peak, the generation rate decreases exponentially from the peak to a nearly zero rate at the end of the prescribed biodegradation time, t99, which is the time for the gas generation rate to drop to one percent of the peak rate.
The model assumes that the characteristic times t0, tP and t99, vary with the type of waste and moisture condition. The specific peak rate is a function of these time and methane potential as shown in Eq. 11 (Reinhart and Faour, 2004).
| (11) |
For the second phase of methanogenesis, the biodegradation constant k is related to the assumed times as represented in the Eq. 12.
| (12) |
Second order: The second-order model describes the complex reactions during degradation of the waste, using a large number of first-order reactions with different rates. Being a complex system of different reactions, landfill gas generation can be modeled using the second order kinetics model (Reinhart and Faour, 2004).
Other methods
Complex mathematical models: These models represent explicitly in a complex mathematical function some or most of the known important physical, chemical and biological variables (composition, moisture, content, temperature, absorption, adsorption, volatilization, evaporation, dilution, filtration, complexion, precipitation, neutralization, oxidation, reduction, etc.) which affects the production rate. Although the importance of these variables is known, it is not possible to describe the gas production rate with any certainty without a detailed characterization of the actual conditions inside the landfill. This requires a significant amount of measurements and a very detailed analysis (Nastev, 1998).
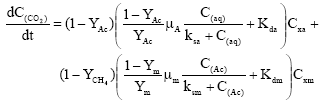
The Halvadakis model (El-Fadel et al., 1989), as a representative complex mathematical model for landfill gas production, is based on the sequential biological growth. The very complex microbial landfill ecosystem is represented by a system of first order equations. They are given in terms of carbon sources, pathways and sinks, describing the hydrolysis of the hydrolysable and biogasifiable waste components, utilization of the aqueous carbon for growth of the acidogenic and methanogenic biomass, utilization of acetate and consequent generation of methane and carbon dioxide. This is equivalent to a simplified microbial food chain. However, this model neglects the methane generation from the reduction of carbon dioxide with hydrogen which, we have seen, represents 25-30% of the total methane produced. Carbon is given in seven possible forms in the corresponding mass balance equations as follows:
Solid carbon,
| (13) |
Aquesous carbon,
| (14) |
Acidogenic biomass carbon,
| (15) |
Methanogenic biomass arbon,
| (16) |
Acetate carbon,
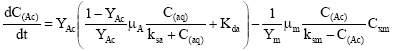 | (17) |
Carbon in CO2,
 | (18) |
Carbon in CH4,
 | (19) |
Numerical: Numerical method is strong tool to simulate and model all phenomena if there is a good general understanding of them (Afshar, 2002). So, it can be used to estimate methane generation in a simpler method. Weighted Residual Method (WRM) can be used in this regard successfully and the result on a real landfill with few observed data has showed a reasonable perdition. For each landfill with few methane measurements, Eq. 20 can be used. With some try and error all unknown parameters can be obtained (Shariatmadari et al., 2007).
| (20) |
where, Ψ is a function to satisfy boundary condition, N is trail function which should be zero on boundaries and a is coefficient which should be determined. The goal of WRM is to choose amn such that residue (R) becomes small over a chosen domain.
CONCLUSIONS
Several studies have been done to estimate methane production out of municipal landfills. These are mostly based on Monod first order decay equation which are called first order decay models. In all of these models, it is assumed that landfill gas consists of 50% CO2 and 50% CH4 which has error. First order models have a linear relation with maximum potential of methane production per weight unit of waste as well as an exponential relation with decay rate and time.
A few models are classified as zero order models in which methane production is assumed to be constant against time. This assumption causes a vivid inaccuracy in the results.
Complex mathematical models which follow the carbon in methane production chain of from solid carbon to aqueous carbon, acidogenic biomass carbon, methanogenic biomass carbon, acetate carbon, carbon in CO2 and then carbon in CH4.
Numerical models are strong tools to predict methane emission out of landfills in which weighted residual methods are usually applied.
| Table 10: | List of different LFG prediction models and their specifications |
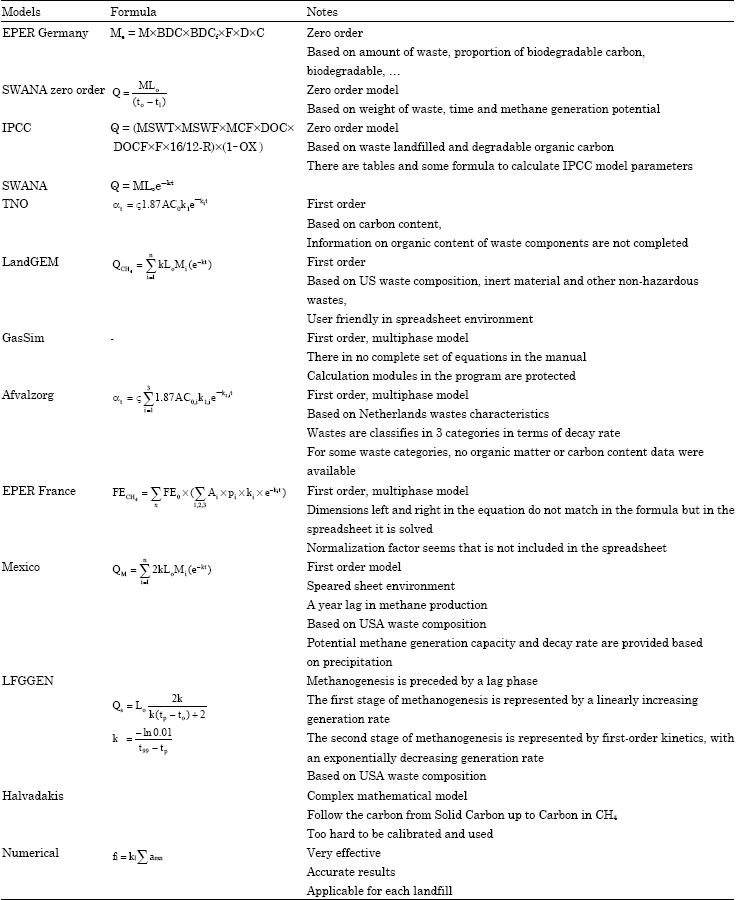 | |
Table 10 represents all models reviewed in this study including their assumptions, weak points and strength.
REFERENCES
- Chen, Y.C., KS. Chen and C.H. Wu, 2003. Numerical simulation of gas flow around a passive vent in a sanitary landfill. J. Hazardous Mater., 100: 39-52.
CrossRef - El-Fadel, M., A.N. Findikakis and J.O. Leckie, 1989. A numerical model for methane production in managed sanitary landfills. Waste Manage. Res., 7: 31-42.
CrossRef - Hartz, K.E. and R.K. Ham, 1982. Gas generation rates of landfill samples. Conservation Recycling, 5: 133-147.
CrossRef - Ozkaya, B., A. Demir and M.B. Bilgili, 2007. Neural network prediction model for the methane fraction in biogas from field-scale landfill bioreactors. Environ. Model. Software, 22: 815-822.
CrossRefDirect Link - Sabour, M.R., A. Mohamedifard and H. Kamalan, 2007. A mathematical model to predict the composition and generation of hospital wastes in Iran. Waste Manage., 27: 584-587.
CrossRef - Scharff, H. and J. Jacobs, 2006. Applying guidance for methane emission estimation for landfills. Waste Manage., 26: 417-429.
Direct Link - Shariatmadari, N., M. Sabour, H. Kamalan, A. Mansouri and M. Ablofazlzade, 2007. Appling simple numerical model to predict methane emission from landfill. J. Applied Sci., 7: 1511-1515.
Direct Link - Thorneloe, S.A., A. Reisdorph, M. Laur, R. Pelt, R.L. Bass and C. Burklin, 1999. The U.S. environmental protection agency`s landfill gas emissions model (LandGEM). Proceedings of Sardinia 99 Sixth International Landfill Symposium, Volume IV Environmental Impact, (SILSVEI`99), Aftercare and Remediation of Landfills, pp: 11-18.