
Zohreh Movahed
Springer, Karun Energy and Teleperformance, Malaysia
LiveDNA: 98.11217
ORCID: 0000-0002-7426-4979
Farzaneh Aghajari
Geologist, NIDC, Iran
Ali Asghar Movahed
Department of Iran Oil Research, Ahvaz, Iran
LiveDNA: 98.5187
ORCID: 0000-0002-1988-4091
Journal of Applied Sciences
Year: 2023 | Volume: 23 | Issue: 1 | Page No.: 34-46


ABSTRACT
Background and Objective: Getting to the Asmari reservoir is not so easy in some cases due to structural complexities. The well test analysis is not enough accurate in describing fracture properties. Permeability analysis of dual-porosity systems can be best evaluated using the FMI but the oil company was not using permeability from FMI in a case when there are no formation testing data in the well for fracture and reservoir modelling. The objective of this study is to develop an accurate structural model for the Asmari reservoir by interpreting dip as input data for permeability analysis from FMI, fracture characterization in the borehole by interpreting image logs as input for permeability analysis from FMI and computing index permeability. Materials and Methods: There are no proven means for directly measuring the permeability in fractured except for well testing and coring which imply high cost. Recent advances in image logging and interpretation techniques using appropriate software have allowed consistent and reliable identification of geological features and petrophysical analysis providing distinct advantages over conventional core data for reservoir characterization. Results: Prediction of the index permeability is the distinct advantage of image logging by using orientation and dip data provided. This paper presents a methodology and applicability of measuring permeability from borehole electrical images recorded in heterogeneous carbonate reservoirs. The FMI results are compared and calibrated with permeability derived MDT and core permeability. Conclusion: It is observed that the permeability values obtained by using the proposed workflow represent more closely the permeability formation signatures and core permeability in the heterogeneous carbonate reservoir.
PDF Abstract XML References Citation
Copyright: © 2023. This is an open access article distributed under the terms of the creative commons attribution License, which permits unrestricted use, distribution and reproduction in any medium, provided the original author and source are credited.
How to cite this article
Zohreh Movahed, Farzaneh Aghajari and Ali Asghar Movahed, 2023. Characterization of Reservoir by Using Geological, Reservoir and Core Data. Journal of Applied Sciences, 23: 34-46.
DOI: 10.3923/jas.2023.34.46
URL: https://scialert.net/abstract/?doi=jas.2023.34.46
DOI: 10.3923/jas.2023.34.46
URL: https://scialert.net/abstract/?doi=jas.2023.34.46
INTRODUCTION
The economic importance of carbonates today lies chiefly in their reservoir properties because about half of the world’s major petroleum reserves are reported to be in these rocks. The Asmari formation was deposited in the Zagros foreland basin during the Oligocene-Miocene. Lithologically, the Asmari formation consists of limestone, dolomitic limestone, dolomite, argillaceous limestone, some anhydrite (Kalhur Member) and sandstones (Ahwaz Member). The Asmari Formation which overlies the Pabdeh consists of shallow-water Oligocene-Miocene limestone is the first reservoir to produce commercial quantities of oil in Iran1.
The production capacity of the Asmari formation is extremely high and provides the bulk of oil production from southwest Iran. Most carbonate formation evaluation methods rely on traditional resistivity and porosity logs. For carbonate reservoirs, the correlation between hydrocarbon production and density-neutron logs has been inconsistent. Good production has been obtained from intervals where logs show low porosity whereas zones with higher porosity have not produced. Apart from matrix porosity, fracture permeability plays a crucial role in the high production capacity of the Asmari (Reservoir Optimization Conference 2003). Total production from carbonate reservoirs in mature fields has often been greater than expected from standard porosity logs. In recent years, there has been a small revolution in our ability to evaluate carbonates. Therefore, understanding carbonate reservoirs and producing them efficiently has become industry priorities and are likely to remain so2.
Fractured reservoirs are a special type of hydrocarbon reservoir. They are commonly thick, porosity is mainly secondary, the distribution of porosity and permeability is irregular, production varies greatly and they may or may not have common hydrocarbon content. Fractured reservoirs show a great deal of difference in terms of (1) The pores of the host rock may or may not contain hydrocarbons and (2) Reservoir potential may or may not be evaluated by conventional open hole logs. Generally, the fractures control the reservoir behaviour in the fractured reservoir3. They can be the conduits to petroleum migration and so result in developing a high production zone, with the permeability of more than 10000 md if the fractures are open. Thus, the study of the fractures in the Asmari reservoir is a serious subject up to now4.
The highest measured values for secondary porosities belong to fractures in the Asmari Formation which is characterized by significant amounts of vuggy and fracture-filling cement. Fractures facilitated fluid circulation and subsequent dissolution of allochems and high Mg carbonates.
In contrast, fine-grained carbonate facies were less cemented and thus, porosity enhancement by cement dissolution was insignificant5.
The FMI is understood to be the tool that can help characterize permeability because of its circumferential coverage and high vertical resolution due to the heterogeneous nature of the Asmari carbonate. It can pick up subtle changes in the rock fabric which could either be depositional or diagenetic in origin. Borehole images like FMI and FMS provide permeability index in carbonates mainly in vuggy/mouldic carbonates. Besides, core analysis usually focuses on the worse portion of the reservoir since core recovery has rarely been well in a highly fractured zone. Therefore, the permeability measured from the core sample is often not representative6.
In the coring process, the sample is pushed more or less intact into the tube. Removed from the tube in the laboratory, it is inspected and analyzed by different techniques and equipment depending on the type of data desired7. In addition, well testing only provides permeability height product KH based on many “best guess” assumptions and can lead to an unclear range of contacts hydrocarbon volumes.
To find a solution, a borehole image log has a very important role to perform proper reservoir characterization by using them in thinly laminated reservoirs is a key to successful field development8. Nevertheless, in this study (PZ-126) by using a resistivity curve from FMI a new method developed approach aimed at better understanding the matrix permeability profile.
The technique was developed based on case studies located onshore in the south of Iran. Traditionally, fractures have been characterized using borehole image data. In this study, borehole image data were integrated with other open-hole logs to derive a permeability curve. Structural dip, evaluation, fracture characterization of their distribution, types and orientation, texture and heterogeneity analysis of images are described.
On the other hand, in this study (PZ-126) by using a resistivity curve from FMI a permeability index computed in carbonates principally in vuggy/mouldic carbonates. Hence, the main objective of the current study is to establish a new methodology to predict permeability in the Asmari fractured carbonate reservoir from FMI calibrated with the MDT and core.
MATERIALS AND METHODS
Study area: The study was carried out at University Technology Malaysia in 2015. The well PZ-126 is located at the western south part of the Pazanan Field (Khuzestan Province) between 2 faults (Fig. 1).
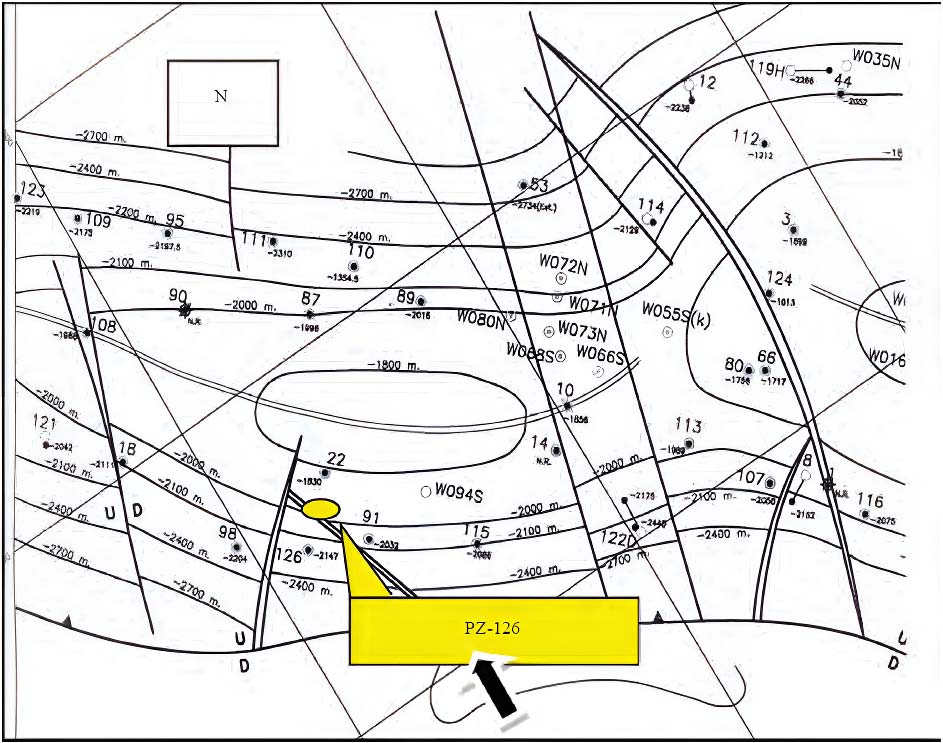 |
| Fig. 1: | Location map of the well#PZ-126 in the Pazanan field Source: (NIOC South UGC map) |
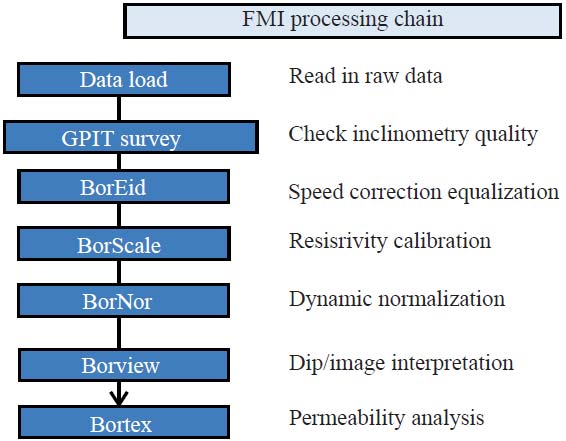 |
| Fig. 2: | Flowchart of permeability analysis from FMI |
It was drilled with an 8.500” bit in a vertical hole (maximum 3-degree deviation) over the image log interval.
Methodology: Field data files are first to read into the computer using a module called Data Load (Geo frame Software). Normally both methods of speed correction are used in BorEid. Optionally, a program called BorScale is run to calibrate the image data response to that of a shallow log such as an RLA2 (resistivity curve). The BorNor is used to dynamically normalize the images to enhance the image contrast. Interactive interpretation of the images is done in BorView. Image logs are displayed using bright colours for resistive units and lower resistivity conductive units are displayed using dark colours in Borview. Interpretation typically started with hand picking dips using sinusoid techniques on oriented images presented at 1:20 or 1:10 scale, so that the geological features are easily visualized. Once dips have been picked they have to be classified into bed boundaries and fractures. The structural dip data is imported into the Bortex software and the heterogeneity analysis of reservoirs from borehole images is carried out by the software used to extract heterogeneities and layer details from images. The FMI images are used to examine the internal organization or rock fabric of the beds or reservoir units in conjunction with open-hole logs. In addition to formation heterogeneities, the software also computed connections for the connected-conductive heterogeneities of a formation (Fig. 2).
Structural dip as input data for heterogeneity analysis: Bedding planes are successions of resistive/conductive planar features in the image logs reflecting variations in the lithological characteristics of the formation across the borehole.
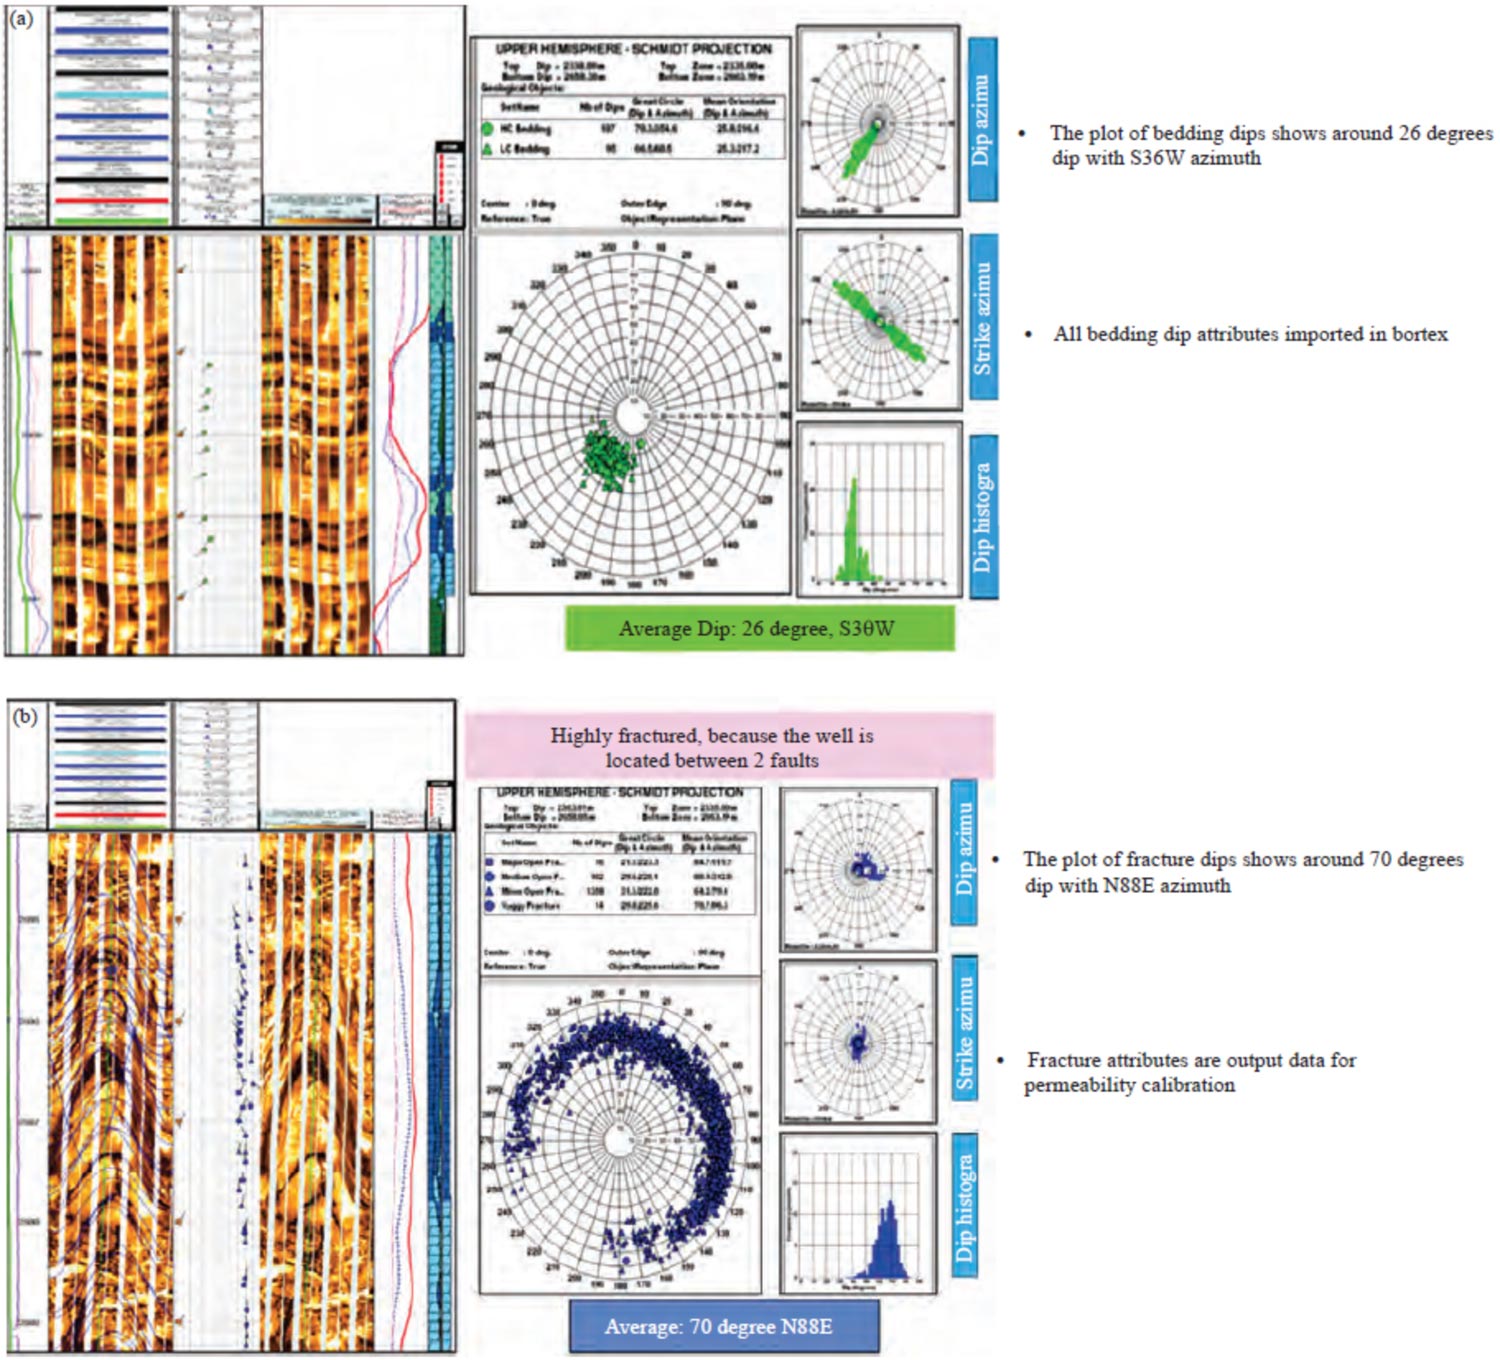 |
| Fig. 3(a-b): | Statistical plots of bedding dips indicating an average dip of (a) 26 degrees S36W and strike N54W-S54E and (b) Statistical plots for dips of all open fractures in the Asmari formation |
Average dip inclination of 26 degrees is the most representative of the whole interval of Asmari formation and statistical plots for dips of all open fractures in the Asmari formation
The dips of these features are used to determine the structural dip in the given borehole. Bed boundaries are almost uniformly distributed throughout the logged interval. The structural dip is 26 degrees toward S36W. The inclinations of dip are generally low and vary between 14-44 degrees. Dip classification based on a geological logic has the advantage of providing a direct representation of structural origin. The structural dip data is an input for permeability analysis software and helped in understanding the reservoir structure, identifying and evaluating sedimentary features and fractures, visualising the rock texture and complementing coring programs (Fig. 3a).
RESULTS AND DISCUSSION
Natural fracture characterization (calibration data): It is vital to know, is the reservoir fractured or non-fractured? If it is fractured then what is the kind of fractures (open or closed) and what is their intensity?
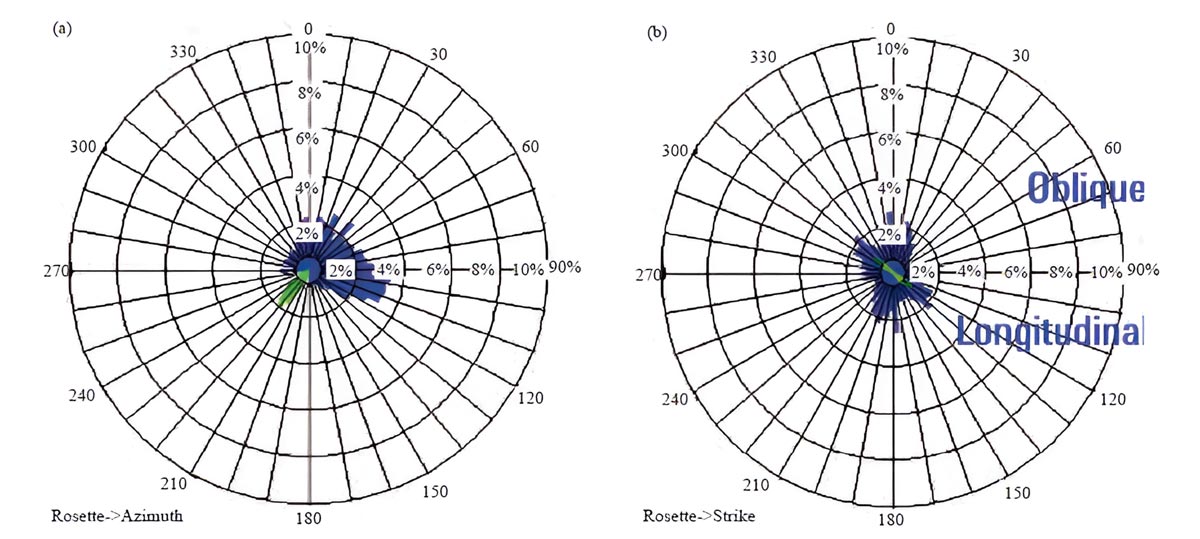 |
| Fig. 4(a-b): | Statistical plots of dips of all fractures and bedding dip attribute showing most oblique fractures in the Asmari interval (a) Fracture and bedding dip Azimuth rosette and (b) Fracture and bedding strike rosette |
Do they occur as a single set or multiple sets and what orientation is their dominant strike? Solutions to questions like these support geologists and reservoir engineers increase oil production5.
The well test analysis is not sufficiently precise in characterizing fracture properties. Fracture intensity and deep-rooted fractures widely grow the risk of unexpected water production9.
FMI images revealed several fractures in certain zones of the Asmari Formation. Altogether, 1580 fractures were identified, 1490 open and 90 cemented fractures whose traces appeared to be resistive or tight. Most of the fractures are plotted within 50 and 80 degrees dip inclination. The open fractures dip with 690 inclinations toward N79E. The open fractures show a dominant striking trend of N11W-S11E (Fig. 3b). When studied to the bedding dip data, it is found that open fractures tend to strike oblique, parallel and perpendicular to the bedding strike. It indicates that open fractures are oblique, longitudinal and transverse types (Fig. 4a-b).
Further, fracture aperture is an important parameter to constrain because the permeability of a fracture network scales with the cube of its aperture. Also, aperture determines the fracture void space and thus the storage volume (= fracture porosity) in the fracture system. Where aperture impacts to flow and volume it is important that next to the fracture width also the amount of cement fill is estimated or the percentage contact area between fracture walls-so-called asperities-and the roughness of the fracture walls, e.g., through the Joint Roughness Coefficient, is recorded. No aperture measurement is made for the closed fracture because generally closed fractures have no open aperture. The aperture is computed for all categories of open fractures except possible ones to increase focus on higher confidence areas. It is displayed in centimetres in the composite display. Fracture aperture is calculated by the following equation, which is based on the modelling results. According to the equation, the fracture aperture is a function of the resistivity of the drilling mud (Rm) and formation resistivity of the invaded zone (Rxo):
W = c.A.Rmb.Rxo1–b |
where, ‘W’ is fracture aperture, ‘A’ is an excess flow of current through FMI/FMS electrode, ‘Rm’ is the resistivity of drilling-mud, ‘Rxo’ is the resistivity of the invaded zone, c and b are model-based constants. The aperture is computed for all categories of open fractures except possible ones to increase focus on higher confidence areas. It is displayed in centimetres in the composite display. Overall, fracture aperture varies from 0.01 cm (0.1 mm) in many places to 0.1 cm around zone 5. Most fractures have aperture near 0.01 cm (1 mm) (Fig. 5a-b).
FMI images provided critical information if the rock structure and sedimentary features are significant determinants of formation productivity10. As the tectonic structures related to compression either correspond to pressure solution features or old fractures that are generally cemented by calcite, these structures must induce a permeability reduction11.
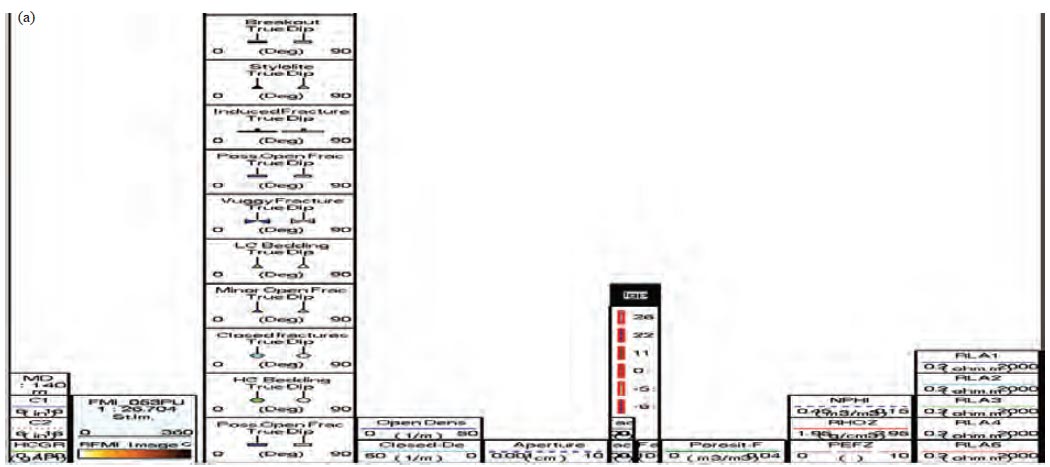 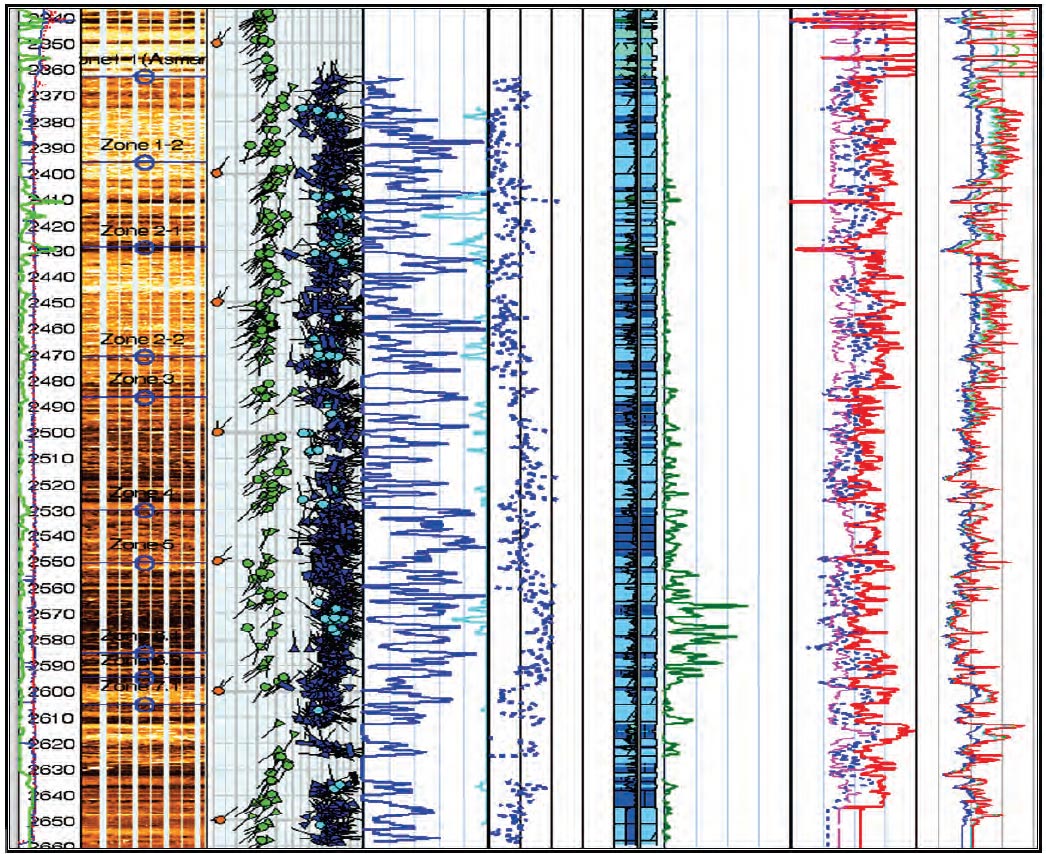 |
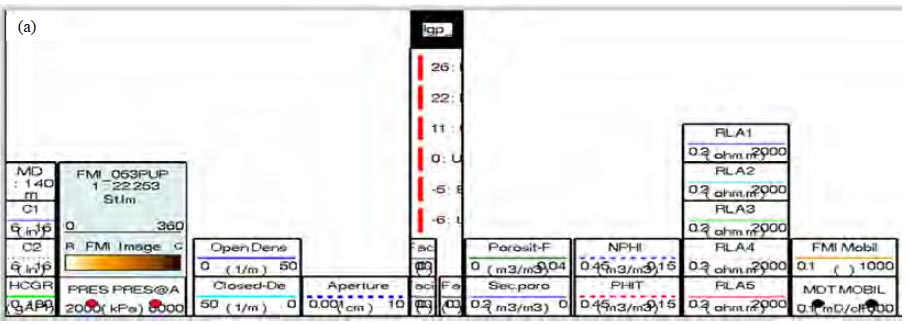
| Fig. 5(a-b): | Summary plot of integrated analysis, (a) Header and (b) Composite plot of orthogonal callipers (C1 and C2) HCGR, FMI static normalized images, dips, well deviation, open fracture density and aperture and porosity, resistivity curves, RHOZ, NPHI, PEFZ curves and lithology |
On the opposite, fractures related to the Pazanan Fault match the permeability enhancement, because they are wide open and their cementation is partial. The role of the fault-related reservoir is more complex since the voids and fractures were pure calcite partly cements the open well, the determination of perforating depth, field development, directional drilling well program, fluid injection zone and fracture modelling9.
FMI permeability analysis in fractured zones: Permeability is one of the hardest parameters to measure in a reservoir and it is even more challenging when the reservoir is fractured2. Accurate data on permeability is vital to predicting production rates and planning production abilities. There is no established mean for directly computing the permeability in fractured except for well testing and coring which indicate high cost. Permeability analysis of dual-porosity systems can be best evaluated using the FMI but the oil company was not utilizing permeability from FMI in a situation where there are no formation testing data in the well for fracture and reservoir modelling. Estimate of the index permeability is the distinct benefit of image logging by using orientation and dip data provided12. New advances in image logging and interpretation methods using suitable software have allowed constant and consistent identification of geological features and petrophysical analysis providing different gains over core data for reservoir characterization13.
The purpose of the BorTex application is to extract and summarize the information about the internal organization of the formations encountered by a well based on dip meter fast channel or electrical image data. The information derived from the dip meter curve or image morphology is summarized by BorTex as logs and it is called BorTex "summary logs", so that it can be easily combined with traditional logs. BorTex combines in a single module functionality for FMI texture analysis11. There are two logical phases in BorTex for this study:
| • | Data selection (input) and preprocessing followed by batch image (or curve) textural processing |
| • | Interactive analysis of images (or dip meter curves) in terms of layering |
A typical work session with Bortex in this study would consist in:
Data selection and input:
| • | Selection of the image or dip meter fast channel data to be analyzed |
| • | Selection of the bedding dip data that will be used to focus the image |
(Or curve) analysis along with the bedding apparent dip: dip data integrity is of paramount importance for the quality of BorTex results.
Layer delineation: Based on user-input cutoff on conductivity contrasts between adjacent layers, the formation layering is defined. This delineation is obtained in two steps. The first step is the computation of the background conductivity achieved as follows:
| • | Homogenization and filtering of the images or fast channels |
| • | Re-scaling of the images or fast channels to a shallow resistivity |
| • | Measurement |
| • | Identification of images of the borehole crossing features relative to the non-crossing ones (Fig. 6). This is achieved through the image analysis method |
| • | Averaging of the image or fast channel resistivity to dip (Fig. 6) |
The second step is interactive. The user chooses a minimum resistivity contrast and then the well is split into consecutive layers when resistivity contrast is greater than the chosen threshold (Fig. 7).
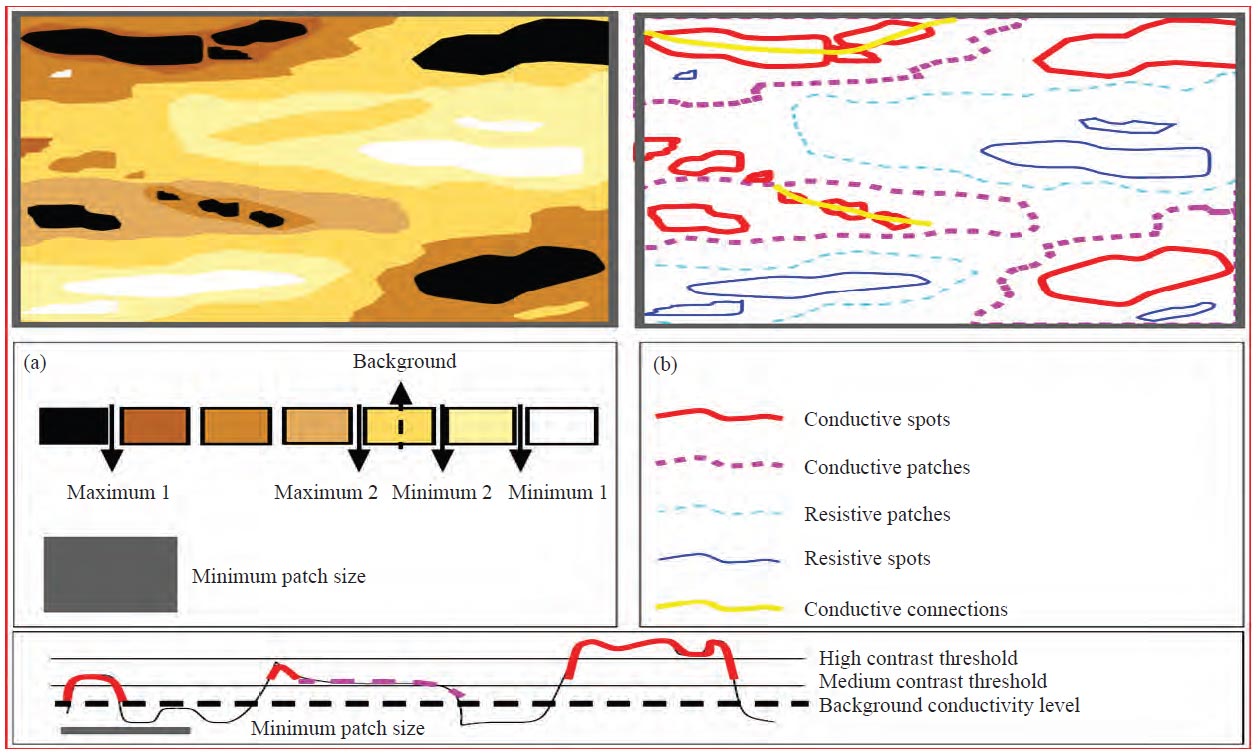
Heterogeneity analysis of FMI: In conjunction with open-hole logs, the FMI images can be used to examine the internal organization or rock fabric of the beds or reservoir units12. A carbonate reservoir could be layered or massive and its porous fraction could be comprised of vugs, moulds, karsts, channels, patches of interparticle or intra-particle porosity or layers due to diagnosis, bioturbation or preferential cementation. Dense limestone areas or porous areas with residual hydrocarbon have lighter colours on the pictures because they are resistive, whereas shale, porous and layered mud penetrated rocks, vugs and moulds have darker shades. The main factor contributing to the heterogeneous nature of a reservoir is patchy due to areas of different porosity and permeability caused by diagenetic processes or/and change in litho-facies13.
For instance, it could be imagined as a mixture of grainstone and packstone, where grainstone areas could be less permeable due to cementation of the pore space and packstone areas could be more permeable. Similarly, in bioclastic limestone, shell fragments are resistive/dense (hence appear as resistive spots or patches) while the leached parts of the same shells could be conductive/porous (hence, appear as conductive spots or patches).
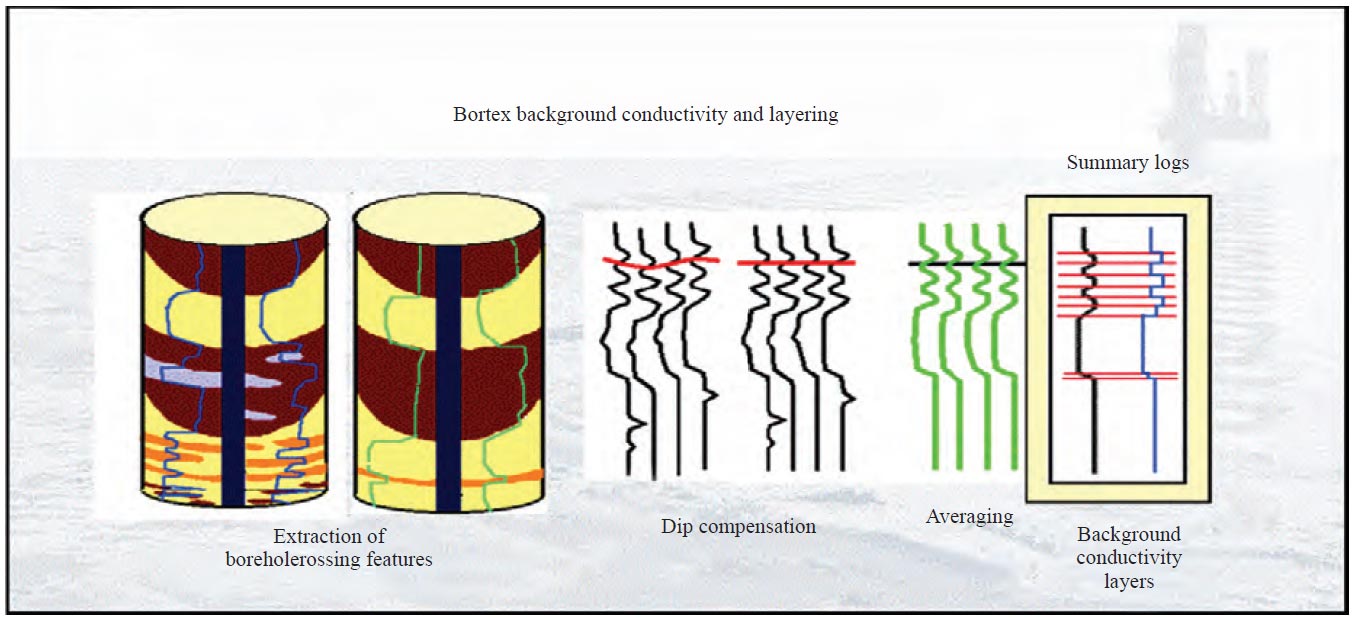 |
| Fig. 6: | Background conductivity and layer computation |
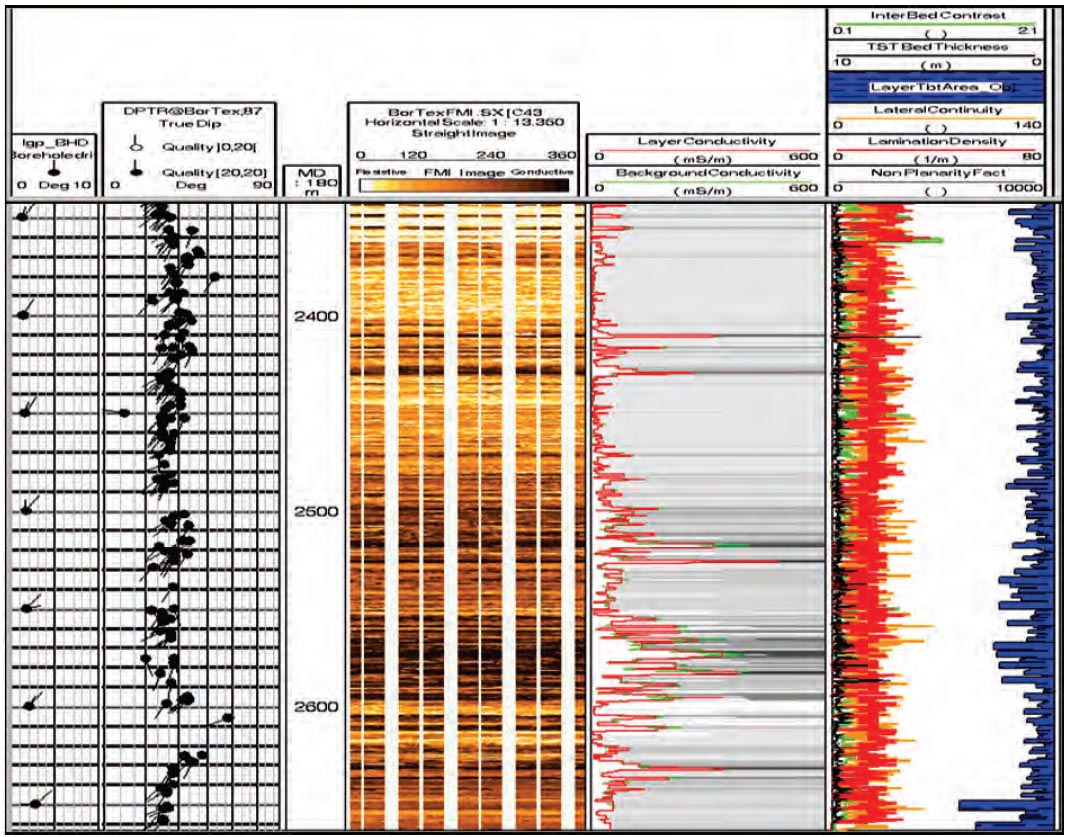 |
| Fig. 7: | BorTex layer delineation and layer characterization phase (formation average background and layer conductivities in track-3; True-stratigraphic-Thickness in track-4) |
 |
| Fig. 8(a-b): | Method for index permeability computation, (a) A principle used in Bortex to identify spots and patches and (b) Basic of heterogeneity analysis |
The heterogeneity analysis of reservoirs of borehole images is carried out with BorTex* (software used to extract heterogeneities and layer details from images). It may involve more than one iteration used for extraction of formation heterogeneities to optimize the parameters. The results of each iteration are validated by visual examination of the images to see whether all heterogeneities are identified and contoured. Conductors and resistive heterogeneities (inclusions) are sorted into spots and patches and minimum and maximum conductivity values are computed across the borehole along the bedding direction. Both spots and patches have boundaries that are located at maximum-contrast lines in the images but spots are local regions flagged by a local maximum and with normally a high contrast. In the background, patches are larger and more diffuse, showing only a medium-contrast and spots are small regions that only show a medium contrast. So, the decision rules are as follows (e.g., for conductive inclusions):
| • | An image region is a conductive spot if its conductivity is greater than the background one, (conductivity >max 1) or if its contrast is medium (conductivity ranging from max 1-2), if it is flagged by a local maximum and if its size is smaller than the minimum patch size |
| • | An image region is a conductive patch if its conductivity is greater than the background one. The background is at least medium and if it is not a conducive spot (Fig. 8a) |
The conductive events are further classified into three types: Large patches, connected spots and isolated (across each image) spots (Fig. 8b). They are shown in different colours on the images: The patches are shown in dark magenta, connected spots in red and the isolated spots in orange (Fig. 9a). The resistive heterogeneities are contoured in dark blue while the large resistive events are contoured in cyan (Fig. 9b).
The FMI images from PZ-126 revealed heterogeneity in the form of conductive and resistive (dense) areas across the whole interval. In clean carbonates, the conductive heterogeneities are due to porous areas (i.e., patches of intergranular and intercrystalline porosity, mouldic/vuggy porosity and, natural open fractures) of different size, shape and conductivity11. While in dense carbonates, the conductive heterogeneities due to argillaceous material are observed largely due to clay seams. The resistive heterogeneities are due to dense/cemented areas of lower or zero porosity. In terms of formations heterogeneities due to dense and conductive anomalies, Asmari formation in this study shows a varying amount of heterogeneity over the interval. The lower part of zone 3, upper, middle and lower part of zone 5 and lower part of zone 7.1 tend to be more heterogeneous. In addition to open hole logs, Bortex* processing (software used to extract heterogeneities and layer details from images), provides five heterogeneity indexes that can be used as input to the neural network program to identify different rock-types or litho-types.
 |
| Fig. 9(a-c): | Result of heterogeneity analysis in Asmari reservoir, (a) Contoured/outlined in red are conductive-connected spots (i.e., the features smaller than 0.0003 m2), in dark brown are isolated conductive spots, and in dark magenta are conductive patches (i.e., conductive features larger than 0.003 m2), (b) Contoured/outlined in blue are resistive/dense features (patches in cyan and spots in blue (the spots are those dense/resistive features/areas whose dimensions are less than 0.003 m2) and (c) FMI calibrated images showing yellow lines (forming cluster of yellow lines) connecting the conductive spots (red contoured features) in a section of Asmari formation |
FMI permeability: The connections correspond to the conductive links at the matrix level between the conductive events. They are shown as thin yellow lines on the FMI/FMS images (Fig. 9c). By computing the amount of additional conductivity due to such thin conductive routes, a connectedness-coefficient (henceforth called raw FMI/FMS-permeability-indicator) is computed, which can be transformed into absolute permeability after comparing it with the MDT over some intervals. In cases where FMI/FMS conductivity is largely influenced by reservoir fluids and shale contents, the raw FMI/FMS-permeability indicator can be corrected through the following functions, which may involve water saturation (Sw and Sxo), porosity and shale volume:
| • | K corrected = (K) image perm. Indicator* (10)a–1 |
| • | K corrected = Corrected permeability for Sw |
| • | K Image Perm Indicator = Raw connectedness coefficient |
| • | a = b/Sw |
| • | b = Varies with Fm |
After normalizing the FMI/FMS-permeability indicator, a permeability profile can be constructed for the entire formation/zone or logged interval. However, the accuracy of the normalization is dependent on the accuracy of the variable (i.e., water saturation, porosity and clay volume) used in the normalization function. However, the raw permeability indicator provides rough and relative permeability information (Fig. 9). There are zones with relatively moderate to high raw permeability index (>5) i.e., zones 1-1, 1-2, 2-1, 2-2, 3, 4, 5, 6-1, 6-2 and 7-1. Data from more wells are required to establish a transformation function to obtain an absolute permeability profile for the Asmari reservoir of the Pazanan field (Fig. 10).
 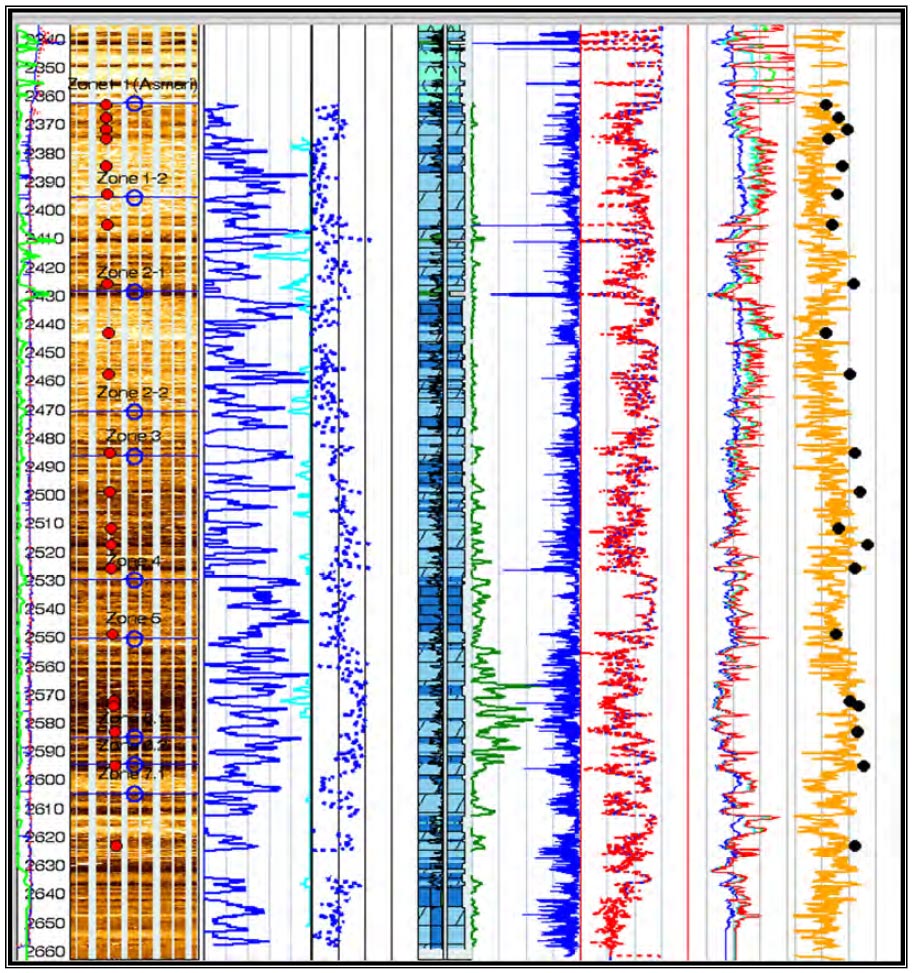 |
| Fig. 10(a-b): | Summary of whole studied zones in Asmari reservoir, (a) Header and (b) Composite plot of orthogonal callipers (C1 and C2), HCGR, FMI static normalized images, open fracture density and aperture and porosity, resistivity curves, PHIT, NPHI curves, MDT pressure, MDT mobility points, lithology, FMI image and log analysis for porosity and FMI raw permeability indicator across the Asmari formation |
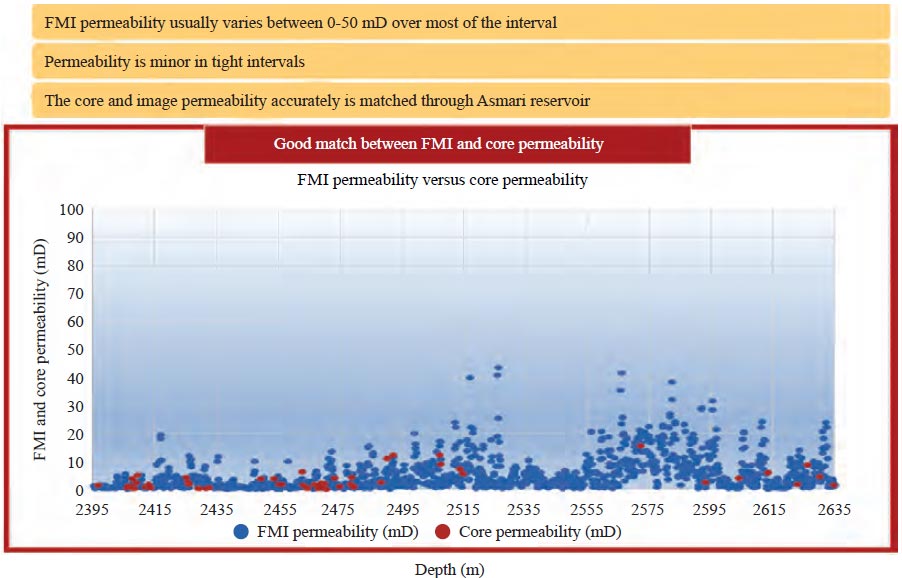 |
| Fig. 11: | Good match between FMI and core permeability |
The raw FMI permeability indicator shows quite a few zones with high permeability index, e.g., overall, permeability profile has alternating high and low values over the entire interval. Generally, permeability is between 1 and 10 mD for the interval 2363-2660 m. An abrupt change in permeability trend is indicated below 2518 m.
Calibration of FMI permeability with MDT permeability: Since the core permeability is not always available, another external permeability is needed. Dynamic methods pursue to define the effect of fractures by calculating or straightly illustrating the drive of the fluid through fractures and matrix. These dynamic procedures include medium scale interval, pressure transit testing which delivers information on fractures, fracture-related flow and fracture conductivity. This test could be gained with a Modular Formation Dynamic Tester. The MDT modular formation dynamics tester tool delivers accurate pressure measurements in real-time. Accurate permeability measurements result from high-resolution gauges combined with precise flow line control to ensure monophasic flow10. With one trip you get the most representative data you need for timely decisions. MDT sampling identifies and collects high-quality reservoir fluid samples for downhole fluid analysis (DFA) or further laboratory analysis. The MDT tool has been used to record the sand face pressure of PZ-126. This well was the only well among lots of wells drilled in the last couple of years that both WOC and GOC could be calculated with high confidence. The result of the previous workflow is a continuous permeability curve from FMI which has been calibrated to external permeability such as MDT. This calibration has to be done cautiously as the two techniques has different ways of measuring permeability i.e., MDT measure fluid mobility through a probe whereas FMI measure estimate permeability from porosity around the borehole. As a result, the FMI permeability index gives a reasonable permeability profile after scaling it against MDT mobility (Fig. 10a-b).
Calibration of FMI permeability with core permeability in PZ-126: Common methods for measuring permeability, in this fractured reservoir, were acquiring and testing core, while core analysis is typically pessimistic because the most highly fractured reservoirs are not covered and analyzed. Subsequently, a limited amount of core was taken for calibration with core data. FMI permeability generally varies between 0-50 mD over most of the interval. However, some zones are tight intervals where permeability tends to be negligible. Consequently, the continuous permeability from FMI is calibrated with limited core permeability. The core-image permeability correlation is agreeable. As mentioned and explained formerly, the core permeability measurement in this interval is thought to be erroneous or affected by the directional nature of core and image analysis (Fig. 11).
MDT tests such as dual packer mini DST and VIT could be very beneficial to better characterize the formation properties measured/determined in this study i.e., secondary porosity, permeability and RRTs. For the sound study of RRTs over the Pazanan field, it is highly recommended to plan for systematic formation images plus production logging/coring evaluation. With a precise RRTs determination over the field and extensively efficient production plan could be possible.
A very beneficial tool for textural and pore system study in carbonate formations is the combination of FMS/FMI and CMR tools. Better characterization of the Asmari formation in such fields like Pazanan in which the most production is coming from matrix and fractures could be very effective using the abovementioned high-technology tools.
CONCLUSION
In a heavily fractured reservoir the tectonic structures related to compression either corresponds to pressure solution features or old fractures that are generally cemented by calcite, these structures must induce a permeability reduction. On the opposite, some fractures related to the Pazanan Fault correspond to permeability enhancement because they are wide open and their cementation is partial. In the non-highly fractured reservoir was observed that the core permeability has a very good match with image permeability based on the connectedness coefficient of porous spots and patches over the reservoir interval. It means that the connectivity of the pore system is well developed in this section and secondary porosity is effective and it could have increased the effectiveness of primary porosity through connecting pores.
SIGNIFICANCE STATEMENT
This study will be used as a standard workflow for other fractured carbonate reservoirs and the National Iranian South Oil Company will use this method in cases where no coring data is available. So, image logs also will help in optimizing coring and saving project drilling costs and at the same time allowing more wells to be drilled in the field.
REFERENCES
- Alavi, M., 2004. Regional stratigraphy of the Zagros fold-thrust belt of Iran and its proforeland evolution. Am. J. Sci., 304: 1-20.
CrossRefDirect Link - Aghli, G., R. Moussavi-Harami and R. Mohammadian, 2020. Reservoir heterogeneity and fracture parameter determination using electrical image logs and petrophysical data (a case study, carbonate Asmari formation, Zagros Basin, SW Iran). Pet. Sci., 17: 51-69.
CrossRefDirect Link - Nelson, R.A., 2001. Geologic Analysis of Naturally Fractured Reservoirs. 2nd Edn., Gulf Professional Publishing, London, United Kingdom, ISBN: 978-0-88415-317-7, Pages: 352.
Direct Link - Khoshbakht, F., H. Memarian and M. Mohammadnia, 2009. Comparison of Asmari, Pabdeh and Gurpi formation's fractures, derived from image log. J. Pet. Sci. Eng., 67: 65-74.
CrossRefDirect Link - Shariatinia, Z., M. Haghighi, S. Feiznia, D. Hall, G. Levresse, A.M. Dehghani and M. Rashidi, 2013. Paleofluid analysis from fracture-fill cements in the Asmari limestones of the Kuh-I-Mond field, SW Zagros, Iran. Arabian J. Geosci., 6: 2539-2556.
CrossRefDirect Link - Bonter, D.A. and R. Trice, 2019. An integrated approach for fractured basement characterization: The lancaster field, a case study in the UK. Pet. Geosci., 25: 400-414.
CrossRefDirect Link - Delleur, J.W., 2006. The Handbook of Groundwater Engineering. 2nd Edn., Crc Press, United States, ISBN-13: 978-0-8493-4316-2, Pages: 1320.
Direct Link - Alade, O.S., A. Hassan, M. Mahmoud, D. Al-Shehri and A. Al-Majed, 2020. Novel approach for improving the flow of waxy crude oil using thermochemical fluids: Experimental and simulation study. ACS Omega, 5: 4313-4321.
CrossRefDirect Link - Movahed, Z., R. Junin, Z. Safarkhanlou and M. Akbar, 2014. Formation evaluation in Dezful embayment of Iran using oil-based-mud imaging techniques. J. Pet. Sci. Eng., 121: 23-37.
CrossRefDirect Link - Movahed, Z., R. Junin and P. Jeffreys, 2014. Evaluate the borehole condition to reduce drilling risk and avoid potential well bore damages by using image logs. J. Pet. Sci. Eng., 122: 318-330.
CrossRefDirect Link - Movahed, Z., R. Junin, H.A. Bakhtiari, Z. Safarkhanlou, A.A. Movahed and M. Alizadeh, 2015. Introduction of sealing fault in Asmari reservoir by using FMI and RFT in one of the Iranian naturally fractured oil fields. Arabian J. Geosci., 8: 10919-10936.
CrossRefDirect Link - Zheng, Y., X. Fang, M.C. Fehler and D.R. Burns, 2013. Seismic characterization of fractured reservoirs by focusing Gaussian beams. GEOPHYSICS, 78: A23-A28.
CrossRefDirect Link - Yang, W., J. Wang, F. Ma, Y. Zhang and Y. Bai et al., 2020. Characterization of the weathered basement rocks in the dongping field from the Qaidam Basin, Western China: Significance as gas reservoirs. Sci. Rep., Vol. 10.
CrossRefDirect Link