
Masdi Muhammad
Department of Mechanical Engineering, Universiti Teknologi PETRONAS, Bandar Seri Iskandar, 31750 Tronoh, Perak, Malaysia
Hilmi Hussin
Department of Mechanical Engineering, Universiti Teknologi PETRONAS, Bandar Seri Iskandar, 31750 Tronoh, Perak, Malaysia
Ainul Akmar Mokhtar
Department of Mechanical Engineering, Universiti Teknologi PETRONAS, Bandar Seri Iskandar, 31750 Tronoh, Perak, Malaysia
Mohd Amin Abdul Majid
Department of Mechanical Engineering, Universiti Teknologi PETRONAS, Bandar Seri Iskandar, 31750 Tronoh, Perak, Malaysia
Journal of Applied Sciences
Year: 2012 | Volume: 12 | Issue: 24 | Page No.: 2568-2573


ABSTRACT
System reliability assessment serves as one of the decision tools in selecting the right maintenance strategy. However, scarcity of failure data which is the prerequisite of traditional reliability analysis, proved to be a formidable challenge in getting an accurate assessment. This study presents an alternative method of assessing repairable system reliability by utilizing the abundantly available system performance data. The proposed method is presented using an actual case study and validated based on actual failure data. The results proved the applicability of the proposed method based on statistically similar results to the actual failure data.
PDF Abstract XML References Citation
Received: September 18, 2012;
Accepted: November 01, 2012;
Published: January 10, 2013
How to cite this article
Masdi Muhammad, Hilmi Hussin, Ainul Akmar Mokhtar and Mohd Amin Abdul Majid, 2012. Reliability Assessment of Repairable System based on Performance Data. Journal of Applied Sciences, 12: 2568-2573.
DOI: 10.3923/jas.2012.2568.2573
URL: https://scialert.net/abstract/?doi=jas.2012.2568.2573
DOI: 10.3923/jas.2012.2568.2573
URL: https://scialert.net/abstract/?doi=jas.2012.2568.2573
INTRODUCTION
Effective maintenance management is essential and critical as a way to reduce the adverse effect of equipment failures and to maximize equipment availability. The increase in equipment availability means higher productivity which translates into higher profitability provided that the maintenance optimization does include the cost reduction factor. This has lead to increase research interest in the subject of optimizing maintenance management. It is estimated that 15 to 45% of total production cost are attributed to maintenance cost with 30% of total manpower involvement (Al-Najjar and Alsyouf, 2003). The total cost of maintenance will be significant; however, the consequence of an inefficient maintenance management is far beyond the direct cost of maintenance where, in most cases, it is not easily quantifiable. The maintenance’s high cost and low efficiency is one of the last costs saving frontier for companies to improve profitability (Al-Najjar and Alsyouf, 2003).
One of the ways to improve maintenance efficiency is to have a better prediction of the next failure occurrence so that all the resources involved can be optimized. There are a number of models available to predict reliability and subsequently equipment failure, however, there are obvious gaps observed between researchers and practitioners of maintenance (Louit et al., 2009). This is due to two main challenges, one, most models are based on specific assumption that rarely represent actual operating conditions and two, the scarcity of failure and maintenance data making statistical inferences inaccurate. Various failure data sources have also been used to predict system reliability as presented by Peiravi (2009). However, this approach might introduce error due to different assumption of operating condition represented by the failure data.
The current research focuses on the development of reliability assessment model for repairable equipment by utilizing equipment performance data instead of failure data. A repairable system is defined as a system which can be restored to satisfactory working condition by repairing or replacing the damaged components that caused the failure to occur other than replacing the whole system (Feingold and Ascher, 1984).
The model was developed by utilizing system performance data which can either be discrete or continuous. The performance data is defined as set of data that are used to monitor the system output performance and is assumed to be directly representing the health of a system. The data could be in the form of hourly flow rates from a pump or amount of cooling in an hour for an air conditioning system or other forms of measurement that can correlate to the condition of the system. It is in a way analogous to the measurement of blood compositions to indicate the state of person with respect to cancer progression (Gibson, 2008). In a lot of cases, these data are commonly available and closely monitored as they are directly linked to total plant production output and thus to revenue or income of an organization (Roberts and Barringer, 2001). For instance, the flow rate of a critical pump in a gas production system is measured and monitored continuously with a calibrated flow meter. Similarly, for a district cooling plant, the output from chillers in terms of Refrigeration Ton hour (RTh) is also continuously monitored. The idea behind this research is to use the abundantly available performance data to relate to the system’s degradation and to predict the system reliability particularly in cases where the failure data is limited or unavailable.
The use of performance data in reliability analysis is based on the following assumptions:
| • | The system is assumed to be in operation if the performance is above the minimum required level. If the performance falls below the required level, the system is assumed to be in failed state |
| • | The performance level during standby is excluded from analysis as the system is not considered operational, thus assumed no degradation in performance. Standby time is identified based on production or maintenance records and can be either in warm standby or cold standby |
| • | The changes in performance level and thus the system’s states occur purely at random with no external intervention except for repairs and maintenance. Changes to the performance level due to manual adjustments are excluded from the analysis |
| • | The performance level as random variable is assumed to be Independent and Identically Distributed (IID) from one interval to another. This means that the level of system performance at one interval would not influence the performance level at the next interval and they are both of same distribution |
MATERIALS AND METHODS
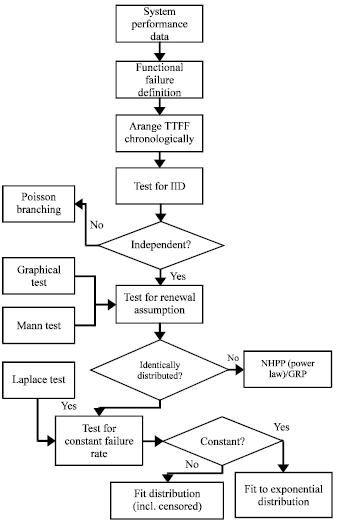
The proposed steps in performing the analysis are as shown in Fig. 1 which is based on the method proposed by Louit et al. (2009) and is summarized as follows:
| • | Acquire performance data for the selected system. The data chosen has to be from a calibrated metrology and would be able to represent overall system performance |
| • | Define the minimum performance level where any performance falls below this level is considered functionally failed. From the definition, Time to Functional Failure (TTFF) can be calculated |
| • | Arrange the TTFF chronologically. Plot cumulative failures versus time. Observe the trend |
| • | Perform independent test. This test is to confirm whether the there is any influence from one functional failure to the next. The test is done by plotting Tn (current failure) versus Tn-1 (previous failure) and observe whether there is any clustering or trending indicating dependent sample. Model for dependent TTFF is not part of the scope of study |
| • | Perform Mann test (NIST, 2011). The null hypothesis for this non-parametric test is that the TTFF can be assumed as Renewal Process (RP) and thus if this hypothesis is accepted, the TTFF can be analyzed using distribution fitting. The alternative hypothesis is a monotonic trend which will invalidate the analysis using distribution fitting. The test statistic, M, is calculated based on the reverse arrangement of the data. This means that if T1, T2, …, Tn, were the n failure data, then the reverse arrangement occurs whenever Ti<Tj for each i<j. Therefore, in general: |
| (1) |
where I(.) is an indicator variables taking the value of 1 whenever the condition is met.
 | |
| Fig. 1: | Proposed process flow for the TTFF (time to functional failure) data to apply the appropriate model |
As M can be approximated by normal distribution, the calculated M value is then compared to the standard value to decide whether the null hypothesis can be accepted. The equation in relating M to z factor is as shown in Eq. 2:
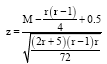 | (2) |
where, r is the number of repair (or failure).
| • | Perform Laplace test which has the null hypothesis of homogenous Poisson process versus an alternative hypothesis of non-homogenous Poisson process. If the hypothesis is accepted, then the times to failures are assumed to be independent and identically (IID) exponentially distributed. The principle behind the test is to compare the mean value of time to failures in an interval with the midpoint of the interval. If the mean deviates from the midpoint, then the data exhibit trending and thus cannot be assumed to be IID. The test statistical value, L, follows a standard normal distribution and can be calculated as below: |
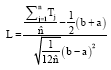 | (3) |
where, Tj is the time to jth failure and [a,b] is the interval of the observation. ![]() on the other hand is given by:
on the other hand is given by:
| • | Apply the appropriate model based on both graphical test and statistical tests |
Case study
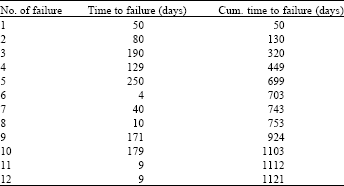
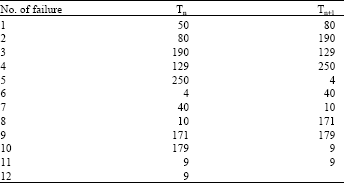
System description: The system chosen to illustrate the applicability of the model is one of the gas powered turbines operating in a gas district cooling. The capacity of the turbine is 4.2 MW. The daily system performance is based on peak hour demand between 8 am to 5 pm during weekdays. A total of 1290 days of data were gathered and used in the analysis. Figure 2 shows the plot system performance data versus days of production. The minimum production limit is set based on research work done by Majid and Nasir (2011) on a similarly configured system. The system is assumed to experience functional failure whenever the system performance falls below the minimum production limit. Based on this assumption, the TTFF is shown in Table 1.
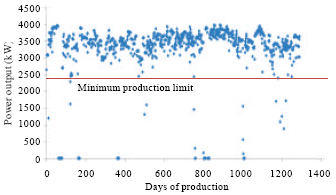 | |
| Fig. 2: | Production output (KW) versus days of production used to calculate the TTFF (time to functional failure) |
| Table 1: | TTFF (time to functional failure) Data calculated based on the time the system falls below the minimum production limit |
 | |
RESULTS AND DISCUSSION
The results provided in the following sections prove the possibility of using performance data in reliability analysis in cases where failure data is not available. This is evident from statistical analysis comparing actual function failures to the predicted failures. However, each TTFF needs be tested according to the proposed process flow so that appropriate analysis can be applied.
Test for independence: Test for independence was performed by using serial correlation test (Kumar and Klefjso, 1992) which will detect the presence of dependent data. In this test, the TTFF data was plotted against a one lag time data as shown in Table 2 and Fig. 3. Since the data was randomly scattered based on Fig. 3, it can be concluded that one failure to the next was independent. In other words, the current failure did not have any influence over immediate subsequent failure.
Trend test: The second step in the analysis is to perform a graphical trend test based on the plot of cumulative time versus number of failure of the data in Table 1.
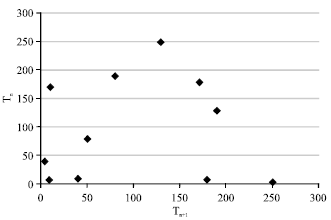 | |
| Fig. 3: | Result of dependency test for TTFF (time to functional failure) which shows no correlation, thus failures are independent |
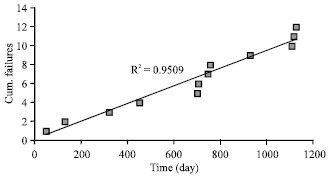 | |
| Fig. 4: | Graphical trend test for TTFF (time to functional failure) which shows good fit to the straight line indicating no trend in the failure data |
The result is shown in Fig. 4 which indicates a good fit for linear regression (R2 = 0.95). This means that the data did not indicate any trend and thus can be assumed to be identically distributed.
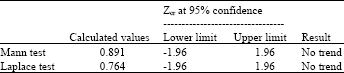
Analytical trend test: To further validate the graphical test of IID, two analytical tests were conducted namely Mann test and Laplace test. Both tests were performed based on 95% confidence limits and the results are shown in Table 3. Since the calculated values for both tests fall between the zcr values at 95% confidence interval, the data can be assumed to be identically distributed.
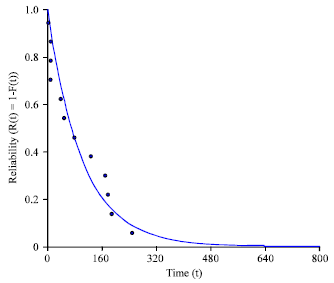
Model assumptions: Based on both graphical and analytical tests, the TTFF data can be safely assumed to be IID and exponentially distributed. As such, the system failure rate can be estimated by fitting exponential distribution to the TTFF data. The Probability Distribution Function (PDF) is shown in Fig. 5. Rank regression method was subsequently used to estimate the failure rate, λ = 0.0097 failure day-1.
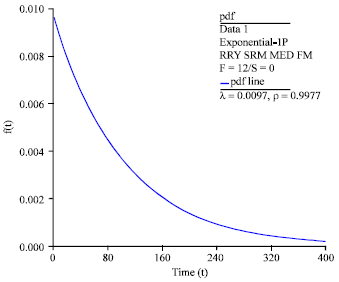 | |
| Fig. 5: | PDF plot for TTFF (time to functional failure) which show a good fit to exponential distribution |
| Table 2: | TTFF (time to functional failure) and lag-time TTFF used to test for independence between two subsequent failures |
 | |
| Table 3: | Mann and Laplace test results showing no trend in failure data at 95% confidence interval |
 | |
With the failure rate, the reliability function for the system with respect to time can be represented as:
| (4) |
The plot of reliability function is shown in Fig. 6.
The reliability plots shows that system reliability is approaching zero at 640 days (or the probability of failure equals 1). This means that, there will be at least 1 system failure when the system operates continuously for 640 days. As mentioned above, the failure is when the system fails to meet the minimum requirement and not the total system failure. This result can be used to schedule a shutdown for planned maintenance.
 | |
| Fig. 6: | Reliability versus time plot showing the expected functional failure to occur at 640 days |
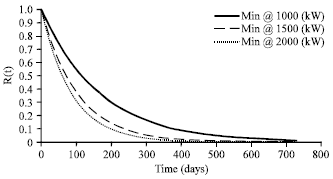 | |
| Fig. 7: | Effect to reliability as demand changes. As the demand increases, the probability of not meeting the demand also increases |
The timing for the shutdown can also be based on system reliability target as required by the organization. For example, a preventive maintenance should be performed when the reliability figure falls below 20% which in this particular case, between 5 to 6 months of operation time. Bear in mind that the reliability is for the whole system with all modes of failure. Further analysis using the maintenance data should be performed to understand failure modes so that proper preventive action can be done during the planned shutdown.
The analysis can be further extended to look at the impact to reliability as demand or the minimum requirement changes. Obviously, the higher the demand, the more likely the system will not be able to meet the requirement. Figure 7 shows the changes in reliability as requirement changes.
Model validation: The proposed approach was validated by comparing the predicted failure data to the actual system failure.
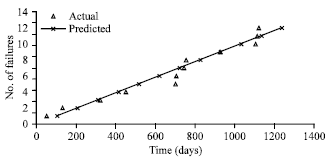 | |
| Fig. 8: | Comparison between predicted failure and the actual occurrence of functional failures |
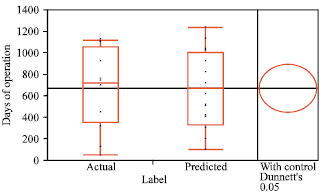 | |
| Fig. 9: | Statistical comparison between actual failures and predicted failure |
The predicted failure is based on mean time between failures which is the reciprocal of failure rate. The result shown in Fig. 8 shows the predicted failure time based on mean time between failures compared with the actual occurrence of failure. A statistical comparison using Dunnett’s test (Walpole et al., 2007) shows statistical equivalent proving the validity of the approach as shown in Fig. 9.
CONCLUSION
This study presents an alternative approach in assessing system reliability based on abundantly available system performance data instead of failure data. Based on the approach, the reliability result is actually measuring the probability that the system is able to meet the minimum requirement for a given operating condition for a stated period of time. The result is valuable in planning a system shutdown depending on the organization’s reliability target.
However, this approach is only valid for a system level reliability encompassing all modes of failures. As such, other information such as component failures or types of failure are not apparent. Thus, maintenance data and condition monitoring data are still essential in assessing the component level of reliability performance.
ACKNOWLEDGMENT
The authors wish to thank Universiti Teknologi PETRONAS for providing the necessary support for this research.
REFERENCES
- Majid, M.A.A. and M. Nasir, 2011. Multi-state system availability model of electricity generation for a cogeneration district cooling plant. Asian J. Applied Sci., 4: 431-438.
CrossRefDirect Link - Al-Najjar, B. and I. Alsyouf, 2003. Selecting the most efficient maintenance approach using fuzzy multiple criteria decision making. Int. J. Prod. Econ., 84: 85-100.
CrossRefDirect Link - Kumar, U. and B. Klefjso, 1992. Reliability analysis of hydraulic system of LHD machines using power law process model. Reliab. Eng. Syst. Saf., 35: 217-224.
CrossRef - Louit, D.M., R. Pascual and A.K.S. Jardine, 2009. A practical procedure for the selection of time-to-failure models based on the assessment of trends in maintenance data. Reliab. Eng. Syst. Saf., 94: 1618-1628.
CrossRef - Peiravi, A., 2009. Redundancy for reliability growth of electronic systems under various operating conditions. J. Applied Sci., 9: 2941-2947.
CrossRefDirect Link