
A. Khorramnazari
Department of Physics, Islamic Azad University, Tehran North Branch, Iran
H. Golnabi
Institute of Water and Energy, Sharif University of Technology, Tehran, Iran
Journal of Applied Sciences
Year: 2011 | Volume: 11 | Issue: 15 | Page No.: 2823-2829


ABSTRACT
Design and operation of a light reflection system for surface profiling is reported in this article. This system consists of a double-fiber optical probe and a mechanical scanning system. In this arrangement one fiber transmits the source light to the object surface and the second one transmits the light reflected off the surface to a photodetector. By scanning the double-fiber probe assembly in one direction the reflection properties of different plane surfaces are investigated. The reported system can be used to monitor the surface profile of target surfaces made from metallic and non-metallic materials. Obtained results show that the reported method can be utilized to obtain structural information from the object surface with different materials and coatings. The variation of the background light for about 160 m sec scanning time is from 4.35 mV to about 4.75 mV that shows a very good time stability of the detection system. Considering a typical signal value of 30 mV an average signal-to-noise ratio of approximately 7 is obtained for this experiment. The reproducibility error is approximately 0.82% for the full scale measurements which is a good figure of merit. The reported opto-mechanical system provides a simple method for the object shape study and determination of different surface structures through the optical reflection monitoring.
PDF Abstract XML References Citation
Received: April 19, 2011;
Accepted: June 08, 2011;
Published: July 02, 2011
How to cite this article
A. Khorramnazari and H. Golnabi, 2011. Object Surface Characteristics Monitoring using Light Reflection Measurements. Journal of Applied Sciences, 11: 2823-2829.
DOI: 10.3923/jas.2011.2823.2829
URL: https://scialert.net/abstract/?doi=jas.2011.2823.2829
DOI: 10.3923/jas.2011.2823.2829
URL: https://scialert.net/abstract/?doi=jas.2011.2823.2829
INTRODUCTION
In recent years a variety of optical systems has been reported in literature for different sensing applications (Yuan et al., 2009; Babchenko and Maryles, 2007; Baptista et al., 2006; Peng et al., 2005; Donlagic and Cibula, 2005; Qiu et al., 2004). Some of the successful optical designs are reported in which the intensity modulation technique is used in sensing operations (Golnabi, 2002; Golnabi and Jafari, 2006; Golnabi et al., 2007; Golnabi, 2000; Golnabi and Azimi, 2007). The ease of operation, cost factor and precise performance requirements have led to the design of the plastic fibers in a double-fiber probe arrangement (Golnabi and Azimi, 2008). Many advantages of the plastic optical fibers also have resulted the application of all plastic double-fiber design in different sensing schemes. Recently surface profiling using an optical design for small object is reported (Golnabi, 2010). Dynamic range limitation on the reported experiment described in that article motivated us to introduce a new opto-mechanical design for surface profiling of large objects which is more suitable for the real field applications. In many optical systems optical fibers are used to transmit the source light for power delivery or image processing (Asadpour and Golnabi, 2008; Jafari and Golnabi, 2008; Haghighatzadeh et al., 2009; Asadpour and Golnabi, 2010). Some attempts have been made to accomplish the light transmission in free space instead of using optical fibers. For example there is a report on the effects of second order dispersion in free space optical communication (Yap et al., 2010).
Considering such limitations in design, here operation of the new opto-mechanical design is reported, which operates based on a new scanning system. The reported method can be used in a variety of applications. This design implements a small double-fiber optical probe that can be used for local and remote surface analysis, which is required in many applications. In this study, the application of such a method is given for the surface monitoring of different plane object surfaces. In view of the key elements of the system we report the main features of the double-fiber design for the optimum operation. Considering the obtained experimental results notable progress is made in respect with the results from the previous optical design (Golnabi, 2010).
MATERIALS AND METHODS
Development of the reported method, experimental work and related computations are performed for the period of 2010-2011 in the Institute of Water and Energy of the Sharif University of Technology.
 | |
| Fig. 1: | Block diagram of the experiment. It includes a light source, a scanning double- fiber probe, a photodetector, a digital voltmeter and a PC |
The experimental arrangement used in this research is shown in Fig. 1 which consists of a light source, a double-fiber probe assembly, a mechanical translational stage, a stepping motor, a stepper motor driver interface for scanning, a photodetector, a digital multimeter and a PC for signal processing and monitoring. The light source can be either a coherent laser light, white or color LED or a white filament lamp. As can be seen in Fig. 1, the optical part consists of the light source a double-fiber assembly and a light photodetector. A double-fiber design is used in this set up in which in one end; two fibers are separated, and they are attached to each other at the other end. The double-fiber designs used in this modeling consist of a pair of similar plastic optical fibers. As can be seen in Fig. 1, a double fiber assembly is used in this modeling in which in one end; two fibers are separated and they are close to each other at the other end. The double-fiber end is mounted in a fixed holder assembly in line with the reflecting target. The separated fiber ends can be connected to the light source and photodetector accordingly. More experimental details about the double-fiber sensor designs can be found in other references (Golnabi and Azimi, 2008).
The fiber tip holder is fixed on a double-rail mechanical stage that can be scanned in one direction by using a stepper motor. For scanning purpose a smooth double-rail translational stage equipped with two-end micro-switches is used in this device. The dynamic range of the electro-mechanical scanning system is about 60 cm and offers an accuracy of better than 1 mm. A 200 step/rev stepping motor is used in this design for the scanning of the reflection probe in the x-direction. This assembly provides a simple and precise way to collect all the reflected light even by using a small area photodetector. A written MATLAB program is used to control the stepper motor with the PC and two electro-mechanical micro switches are used at the two limit points of the scanning range.
The light source used here is a white LED operating at a supply voltage of 5 V. The Plastic Optical Fibers (POFs) can operate successfully at visible wavelength range and thus are used in this experiment. Some general benefits of POFs are the simpler and less expensive components, lighter weight, operation in the visible wavelength range, greater flexibility, ease in handing and connecting, and greater safety than glass optical fibers. However, the high-loss problem is notable for POFs and being addressed with the new perfluorinated polymer materials which have brought losses down to potentially 10 dB km-1. Because of the ease of coupling light from light source, it is possible to embed the source and drive electronics into the connector housing, such as for transceivers used in automotive and consumer products. The POF used here are effective but, better fibers and a better treatment of the fiber ends can improve the coupling efficiency of the fiber to source, to surface under study and finally to the photodetector. Since the cross section of the fiber is large enough, therefore, the source light is directly coupled to the fiber end.
A silicon photodiode (BPX 65 Centronic) is used for the light detection and conversion of optical signal to an electric one. It is reversed biased to 18 V and operates in the photoconductive mode. The electric output signal of this detector is connected to a digital voltmeter by a coaxial cable. A digital Multimeter (SANWA Electronic Instrument Co. LTD, PC 5000 DMM) is used for the output voltage reading and data processing (±0.1 mV precision). The general specifications of this instrument are such that provides a 0.03% basic accuracy and 0.01 mV AC/DC voltage resolutions and equips with an optional optical isolated interface port at the meter back for data communication with a PC.
Methodology: Operation of the double fiber probe used here is based on the intensity modulation of the light reflected off the surface of an object. The reflection concept of light from a surface based on the geometrical and physical optics can be derived. Here, for simplicity we use the geometrical optics analysis. The image of the transmitted light on the receiving fiber entrance plane (image plane) is considered for analysis. In general three cases can be recognized. First, when there is no crossing between the two light cones (dead area). In this situation detector does not receive any specular/diffusion radiation. Second, when there is a crossing between the two cones (circles) of the beams, then crossing area can change from zero to a maximum value of transmitter fiber core area. Third, when the circle is totally inside the spot light or image circle, then the amount of beam crossing (ΔS) is always a constant but intensity of the received light in this area is decreased by increasing the distance of the moving target plane. For a similar double-fiber such as the one used here the core radius for two fibers are equal. The reflected power, P, from the target plane to be received by the receiver fiber is obtained by the relation:
| (1) |
where, I is the launching intensity by the transmitter fiber at the target plane, ρ shows the reflection coefficient for the target plane and (ΔS) the beam crossing as mentioned. More details about the reflection theory can be found in another reference (Jafari and Golnabi, 2010).
RESULTS
In the first experiment a fixed target surface is used for the calibration of the scanning system. For this purpose the reflected signal for the surface as a function of scanning time is obtained. Then by knowing the interval time and scanned distance the speed of the scanning probe is determined. The calibration result for the tested scanner shows a scan speed of 1.97 mm sec-1 for the tested range of 350 mm. The given calibration line can be used to convert the scanning time into the traversed distance for the scanning system.
All the experiments for a given light source for different object surfaces are performed at the same incident probe angle and illumination flux. For a better comparison the double-fiber arrangement is horizontal for all the experiments reported in this article. The scanning of the reflection probe is from left to right for all the reported experiments. The background signal when the room light is on is about 30-40 mV but it can be reduced by cutting the stray lights using a black cover on the light sensitive portions of the system. The variation of the suppressed background light is shown in Fig. 2 which can be the limit of the signal detection for the reported reflection results. As can be seen in Fig. 2, the variation of the background light for about 160 m sec scanning time is from 4.35 mV to about 4.75 mV that shows a good time stability of the detection system used in this experiment.
In the series of experiments performed here we briefly describe the total reflection (specular and diffusion reflection) signals for the typical metallic and none-metallic surfaces. In the first experiment reflections are recorded from three different plane mirror surfaces. Figure 3 shows the reflection voltage signals for the two surfaces coated with Al material and the third one with the gold coating. As can be seen in Fig. 3, the reflection signal for the Al mirror 1 is about 43.61 mV, for Al mirror 2 approximately 42.62 mV and for the gold mirror is only 14.92 mV at the given visible wavelength range. Present result shows that the optimum signal is recorded for the plane Al mirror 1 with the highest reflection signal.
 | |
| Fig. 2: | Background signal for the light detection system |
 | |
| Fig. 3: | Reflection signal from different mirror surfaces |
 | |
| Fig. 4: | Comparison of the reflection signals from different color paper surfaces |
In the next study, a similar experiment is performed for the paper materials with different colors. The quality of the paper material is in the grade of regular available printing paper (A4 paper). The reflection voltage signals as a function of paper color are shown in Fig. 4. For a better comparison the reflected light signal from the white A4 paper is also shown in Fig. 4. As can be seen in the bar graph plot the reflection signal for the white paper is the maximum value (20.38 mV) and for the violet color is the minimum of about 14.25 mV. Figure 4 clearly shows the effect of the painting color since the surface materials are almost made from a similar material.
Figure 5a shows the real photograph picture of a 3-hole Al piece. As can be seen in the picture in top part there are three holes with a diameter of 6 mm. The probe is scanned horizontally from left to right as the illumination light height is about the center line height of the Al piece. The scan length of the object is about 60 mm and the physical size of the object can be determined by using the scale shown in Fig. 5a. The center line distance between the holes is approximately 20 mm. The surface quality for of the Al piece is just as good as the final machined surface quality.
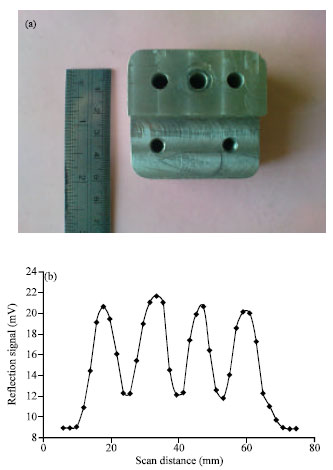 | |
| Fig. 5: | Recorded signal from a structured al piece (a) photograph picture and (b) Reflection signal |
The corresponding reflection signal for the part Fig. 5a is plotted in Fig. 5b. In Fig. 5b the reflection signal is plotted as a function of the scan distance for a range of 5-75 mm. As can be seen some undulations are observed in the reflection response curve. As shown in Fig. 5b, for the tested Al part with three holes the reflection signal starts from a background voltage level of about 9 mV and reaches to a maximum value of about 21.0 mV at scanning distance of 15 mm and from that point on a periodic response is observed. After the first maximum peak corresponding to the regular Al flat surface the reflection signal decreases to about 12 mV at a scan distance of 25 mm as shown in Fig. 5b. This voltage signal drop is due to the presence of the first hole in the Al piece from left as can be seen in Fig. 5a. A similar pattern is observed for the reflection signals from the second hole and the third hole.
For the second hole the minimum in signal occurs at about 40 mm and for the third hole at the scanning distance of about 52 mm. The average distance between the two minimums corresponding to the center-hole distance of the piece which is 15 mm. After the third minimum as shown in Fig. 5b the reflection signal is maximum again (20 mV at 72 mm) related to the flat part of the surface at the end part of the piece. The reflection signal as shown drops to the background level of 9 mV at the scan distance of 75 mm which shows the end part of the scanned Al piece. As can be seen there is a good correlation between the real surface structure and the obtained reflection information. This point shows that the reported method can be a good way to obtain structural information from the object surface.
Figure 6a shows the real photograph picture of the grooved-bronze piece. As can be seen in the picture in the horizontal direction there are three flat parts while the middle part has a deeper flat surface. The real size of the each flat part and the groove can be determined from the scale shown in Fig. 6a. The width of the first flat part is 6 mm, second grooved part 10 mm and the third edge part is approximately 2 mm. The probe is scanned horizontally from left to the right of the object as the illumination light height is about the middle height of the bronze piece. The scan length of the object is about 18 mm considering the real size of the bronze piece shown in Fig. 6a.
The corresponding reflection signal curve for the part of Fig. 6a is shown in Fig. 6b. Here, in a similar way the reflection signal is plotted as a function of the scan distance for a range of 0-30 mm. A careful look at Fig. 6b shows that two pronounced undulations are observed in the reflection response curve. As can be seen in Fig. 6a, the tested bronze piece has two edges and a groove in between. The reflection signal for this piece starts from a background voltage level of about 11.24 mV and reaches to a maximum value of about 16.0 mV at scanning distance of 11.76 mm and from that point a second maximum with a reflection signal of 23 mV is observed at a scan distance of 17.64 mm. The second maximum peak corresponds to the grooved part of the surface in which it is adjusted for the maximum reflection signal. As shown in Fig. 6b the reflection signal decreases to about 16 mV at a scan distance of 22 mm. The reflection signal as shown drops to the background signal level of 11.76 mV at the scan distance of 27 mm. As can be seen there is a good correlation between the real surface structure and the obtained reflection information from the experimental results. This point indicates that the reported method can be a good way to obtain structural information about the grooves and edges in the object surface.
In the last study, the reproducibility of the results for the reported system is investigated. For this purpose the results of two different measurements at similar experimental conditions are plotted together in Fig. 6b. As can be seen, the experimental data points for the given tests are shown with the square and diamond symbols, respectively. Considering the results there is a good agreement between the measured reflection signals for the two cases.
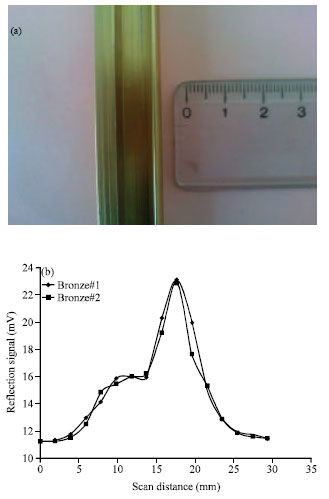 | |
| Fig. 6: | Recorded signal from a bronze structured step-piece (a) photograph picture and (b) Reflection signal |
For example, consider the observed deviation for the maximum peaks occurring at 117.64 mm scanning distance that is about 0.19 mV. The averaged reproducibility error is approximately 0.82% for the full scale measured value of 23.09 mV which is a quite reasonable number in such measurements.
DISCUSSION
Experimental results reveal some points that are discussed in more details in this section. As can be seen in results, the respond curve includes valuable information concerning the surface shape, small features in the surface, material types and the surface coating materials. For example result shown in Fig. 3 displays the reflection results for different flat mirror surfaces. The important point is that Al coated mirror is superior to the gold coating mirror for the white light illumination. Comparison of the other mirror surfaces with different coating materials at different light wavelengths is possible by using the reported method.
Fibers core and overall size and as a result the fiber lateral distance has a great impact on the double-fiber probe sensitivity and dynamic range as described in the previous reports and in agreement with the previous findings. Fiber core radius and fiber overall size play also important role in the maximum intensity and the bandwidth of the respond curve of such a probe in support of other reports (Golnabi, 2010; Jafari and Golnabi, 2010). The dead region is controlled by parameters such as fiber lateral distance, fiber numerical aperture but fiber core radius has a little effect in this respect. Maximum place in the intensity curve is governed mainly by the lateral distance and fiber numerical aperture NA. Maximum peak value of the intensity curve is governed mainly by the fiber core radius and numerical aperture.
The reflection signals as a function of paper color is shown in Fig. 4. As can be seen in the bar graph the reflection signal for the white paper is the maximum value (20.38 mV) while for the violet color is the minimum of about 14.25 mV. The result of Fig. 4 clearly shows the effect of the painting color since the surface materials are almost made from a similar material. As a result different color surfaces can be distinguished by the reported reflection measurement system in support of the previous report (Golnabi, 2010).
As shown in Fig. 5, for the tested Al part with three holes there is a correlation between the real photograph picture of the Al piece and that of the reflection information. For example the presence of the three symmetrical holes is recognized in the periodic pattern of the reflection signal. As can be seen there is a good correlation between the real surface structure and the obtained reflection information.
A similar observation is noted for the grooved bronze piece. As displayed in Fig. 6, for the tested piece there is a correlation between the real photograph picture of the bronze piece and that of the reflection information. For example the presence of the two flat edges and a groove in between are recognized in the reflection signal. The results of Fig. 5 and 6 show that the reported method can be a valuable mean to obtain structural information from the plane object surface as was the case for the small curved surfaces described before (Golnabi, 2010). By comparing the results for the mirror surfaces (Fig. 3), color papers (Fig. 4) and metallic surfaces (Fig. 5, 6) as expected it is noted that reflection signal for the mirror surface is the highest, next for the metallic surface and finally from the color paper is the minimum value for the white light illumination. A similar signal variation is observed for the same reflecting materials from curved surfaces (Golnabi, 2010).
The reproducibility in results, detection noise level, and the time stability are important factors for any light detecting and monitoring system. The variation of the suppressed background light is described in Fig. 2 which can be the limit of signal detection for the reported system. As can be seen in Fig. 2, the variation of the background light for about 160 m sec scanning time is from 4.35 mV to about 4.75 mV that shows very good time stability. Considering a typical signal value of 30 mV a direct signal-to-noise ratio of approximately 7 is obtained for this experiment. In the last study, the reproducibility of the results for the reported system is investigated. There is a good agreement between the measured reflection signals for the two different runs. For example the observed deviation for the maximum peaks occurring at 117.64 mm scanning distance is about 0.19 mV. The averaged reproducibility error is approximately 0.82% for the full scale measured value of 23.09 mV which is a good figure of merit in such measurements (Golnabi and Azimi, 2008).
CONCLUSION
The flat shape surfaces of the metallic and non-metallic objects were investigated by the new optical method. Useful information for different surfaces is given here and it is shown that reflection data can be used in surface profiling. Present results show that reflecting signals can provide information about the structure of the surface and in particular, can provide information about the shape and structure of the object surface under study. By experimenting different object surfaces it is noticed that the reflected signal depends on both the axial position of the object surface, surface curvature and the double-fiber arrangement probing distance. Using this technique one can extract information concerning the shape or physical properties of a surface under study and as a result surface structures, steps and existence of a reflecting layers or coating on a surface can be recognized with a high accuracy.
ACKNOWLEDGMENT
This study was supported in part by the Sharif University of Technology Research program. The authors gratefully acknowledge the grant money devoted to this research project (Grant#3104).
REFERENCES
- Asadpour, A. and H. Golnabi, 2008. Beam profile and image transfer study in multimode optical fiber coupling. J. Applied Sci., 8: 4210-4214.
CrossRefDirect Link - Asadpour, A. and H. Golnabi, 2010. Fiber output beam shape study using imaging technique. J. Applied Sci., 10: 312-318.
CrossRefDirect Link - Babchenko, A. and J. Maryles, 2007. Graded-index plastic optical fiber for deformation sensing. Opt. Lasers Eng., 45: 757-760.
CrossRef - Baptista, J.M., S.F. Santos, G. Rego, O. Frazao and J.L. Santos, 2006. Micro-displacement or bending measurement using a long-period fibre grating in a self-referenced fibre optic intensity sensor. Opt. Commun., 260: 8-11.
CrossRef - Donlagic, D. and E. Cibula, 2005. An all-fiber scanning interferometer with a large optical path length difference. Opt. Lasers Eng., 43: 619-623.
CrossRef - Golnabi, H., 2002. Mass measurement using intensity modulated optical fiber sensor. Opt. Lasers Eng., 38: 537-548.
CrossRef - Golnabi, H. and R. Jafari, 2006. Design and performance of an optical fiber sensor based on light leakage. Rev. Sci. Instrum., 77: 1-3.
CrossRef - Golnabi, H., M. Bahar, M. Razani, M. Abrishami and A. Asadpour, 2007. Design and operation of an evanescent optical fiber sensor. Opt. Lasers Eng., 45: 12-18.
CrossRef - Golnabi, H., 2000. Simulation of the interferometric sensors for pressure and temperature measurements. Rev. Sci. Instrum., 71: 1608-1613.
CrossRef - Golnabi, H. and P. Azimi, 2007. Design and performance of a plastic optical fiber leakage sensor. Opt. Laser Technol., 39: 1346-1350.
CrossRef - Golnabi, H. and P. Azimi, 2008. Design and operation of a double-fiber displacement sensor. Opt. Commun., 281: 614-620.
CrossRef - Golnabi, H., 2010. Surface profiling using a double-fiber optical design. Opt. Lasers Eng., 48: 421-426.
CrossRef - Jafari, R. and H. Golnabi, 2008. Spectral analysis using a new opto-mechanical instrument. J. Applied Sci., 8: 3669-3675.
CrossRefDirect Link - Jafari, R. and H. Golnabi, 2010. Simulation of three different double-fiber probes for reflection sensing. J. Applied Sci., 10: 20-28.
CrossRefDirect Link - Haghighatzadeh, A., H. Golnabi and M. Shakouri, 2009. Design and operation of a simple beam shaping system. J. Applied Sci., 9: 3350-3356.
CrossRefDirect Link - Peng, P.C., K.M. Feng, W.R. Peng, H.Y. Chiou, C.C. Chang and S. Chi, 2005. Long-distance fiber grating sensor system using a fiber ring laser with EDWA and SOA. Opt. Commun., 252: 127-131.
CrossRef - Qiu, T., L.S. Kuo and H.C. Yeh, 2004. A novel type of fiber optic displacement sensor based on Gaussian beam interference. Opt. Commun., 234: 163-168.
CrossRef - Yap, D.F.W., Y.C. Wong, S.P. Koh, S.K. Tiong and M.A.E.M. Tahir, 2010. Effects of second order dispersion in free space optical communication. J. Applied Sciences, 10: 595-598.
CrossRefDirect Link - Yuan, B., H.M. Yan and X.Q. Cao, 2009. A new subdivision method for grating based displacement sensor using image array. Opt. Lasers Eng., 47: 90-95.
CrossRef