
R. Kalpana
Department of Electronics and Communication Engineering, CEG Campus, Anna University, Chennai, India
S. Muttan
Department of Electronics and Communication Engineering, CEG Campus, Anna University, Chennai, India
R. Emmanuel
Bharat Scans, Chennai, India
Journal of Applied Sciences
Year: 2011 | Volume: 11 | Issue: 15 | Page No.: 2800-2807


ABSTRACT
The aim of this study was to analyze the changes in myelination of the brain on ageing under normal and pathological conditions. The human brain is an embodiment of a huge number of subsystems that interact spatially and/or temporally with stochastical attributes which are viewed in terms of its anatomical and physio/neurological activities in spatial and temporal domains. The physical and functional aspects of the brain complex significantly changes with age. Specifically, the cerebral white matter undergoes degenerative changes in its physical and functional stochastic with aging process. In this study a method has been indicated, using parameters of structural morphology observed in the CWM (and measured via Diffusion Tensor Magnetic Resonance Imaging, (DTMRI)) using statistical technique and relating such parametric attributes to ageing via. an Artificial Neural Network (ANN). Clinical DTMRI data from subjects of different age groups under normal and neurological pathology is used to study the efficacy in the ANN predictions on the aging process. The obtained results suggest the morphological changes in CWM on normal ageing and also its changes on specific conditions like infarct and HIV+. The proposed method could be useful for the physician in understanding the micro-structural changes in CWM and hence reasons for cognitive impairment specifically among neurologically affected subjects.
PDF Abstract XML References Citation
Received: February 16, 2011;
Accepted: April 28, 2011;
Published: July 02, 2011
How to cite this article
R. Kalpana, S. Muttan and R. Emmanuel, 2011. Taxonomy of Brain White Matter under Normal and Abnormal Conditions using Stochastic Properties of Brain. Journal of Applied Sciences, 11: 2800-2807.
DOI: 10.3923/jas.2011.2800.2807
URL: https://scialert.net/abstract/?doi=jas.2011.2800.2807
DOI: 10.3923/jas.2011.2800.2807
URL: https://scialert.net/abstract/?doi=jas.2011.2800.2807
INTRODUCTION
The white matter of the brain contains nerve fibers. Many of these nerve fibers (axons) are surrounded by a type of fat called myelin. The myelin gives the whitish appearance to the white matter. Myelin acts as an insulator and it increases the speed of transmission of all nerve signals. The prevalence of white matter hyperintensities increases with age. White matter hyperintensities are associated with impaired cognition, balance and gait (Murray et al., 2005). Cerebral white matter undergoes various degenerative changes with normal aging, including decreases in myelin density and alterations in myelin structure. The association between major depressive disorder and increased prevalence of brain white-matter hyperintensities has been reported in elderly people (Iosifescu et al., 2006). CWM lesions are observed frequently in human ischemic cerebrovascular disease and have been thought to contribute to cognitive impairment (Wakita et al., 2002).
The morphology of the brain manifests, for example, the so-called cerebral white matter exhibits degenerative changes with normal aging. Such changes are observed as decrease in myelin density as well as alterations in myelin structure (Ota et al., 2006). Assessing the texture of such degenerative CMW can be done via Diffusion Tensor Magnetic Resonance Imaging (DTMRI) technique. It is a non-invasive tool for determining white matter connectivity in the brain. This modality images by measuring the water molecule motion within the tissues, using magnetic resonance techniques David and Rachid, (2003) and hence could provide directional information of the microtubular structure (Davoodi-Bojd and Soltanian-Zadeh, 2009). The self-diffusion of water molecules in the human brain is affected by the underlying tissue structure. Water diffuses more along fiber tracts than across the fiber tracts. A myelinated CWM tract can pose more restriction on water molecules than an unmyelinated tract. So by monitoring diffusion of water with DTMRI information on tissue structure can be obtained ziz (Ulug, 2002).
In this study, DTMR images that are obtained under normal and pathological conditions are subjected to statistical method of texture analysis. Texture features provide integral, quantitative information about structural properties at a millimeter scale (Kovalev and Kruggel, 2007). This texture pattern of CWM changes with respect to age and depending on neurological conditions of the subject. Commensurate with the complex system profile of the brain (and its white matter), described in this study is an Artificial Neural Network (ANN)-based approach to relate age versus the extent of morphological changes observed in the clinical scans (with DTMRI) of the brains of human subjects (in the age group of about 50 to 80 years). Experimental/clinical data on the brain complex vis-α-vis ageing profile of the subjects are validated using a test ANN. This study could lead to understanding the morphology of CWM versus age. ANN is used to solve a vast variety of problems in science and engineering; particularly in some areas where the conventional modeling method may be too complex or may not give good result. Inspired from biological neuron, a well trained ANN would be able to become a predictive model for a specific application (Rashid et al., 2010). Back propagation neural network (BPNN) is one of the most popular models applied in various fields. The theory and algorithm has been clearly defined by the propagation rule i.e. generalized delta rule (Chiu et al., 2008).
The brain is a structure made of innumerable interconnected neural cellular parts that interact across the spatial domain; also, the associated neural activity depicts a temporal interaction between the cells. Further, depending on the nature of temporal activity involved and spatial proliferation of the neural information, the underlying interaction is largely stochastical and partly deterministic. In this perspective, as in any complex system, a partial change in the physical organization and/or functional activity would lead to a significant change in the self-organizational attributes of the system as indicated by Wakita et al. (2002). Pertinent to the brain complex, the normal ageing process will cause distinct degenerative alterations in the mass of the brain, normally observed as decreases in myelin density as well as alterations in myelin structure across the CWM. Knowing such changes can lead to diagnosing neurological disorders in elderly people. Hence attempts of this research are the following:
| • | Age versus degenerative attributes of the CWM: Assessment via an ANN trained with clinical data |
| • | Correlating the age to the extent of clinically observed morphology in the CWM under neurological normal and abnormal conditions |
MATERIALS AND METHODS
Work flow: DTMR images are obtained from 48 volunteers of age group between 50 and 80 are segmented for white matter using automated segmenting procedure and analyzed for age-related changes in brain fiber tracts. The procedure adopted is as follows:
| • | Obtaining the DTMR images from the volunteers under normal and abnormal conditions |
| • | Segmenting the image for white matter |
| • | Finding co-occurrence matrix of the quantised white matter image |
| • | Finding the appropriate statistical features from GLCM |
| • | Classifying pathological images |
| • | Using back propagation neural network, the image is classified against the age |
Image acquisition: MRI acquisition was performed on a GE 3 Tesla Signa HDX system equipped with a 8-channel brain array coil using a Diffusion Tensor Imaging with Fourier transform. Protocol: Field-of-view (FOV) 240x240 mm; matrix 256x256; TR = 7400; Number of diffusion direction = 25; b value = 1000; voxel size 0.9375x0.9375x5 mm; slice thickness = 5 mm; scanning time = 8 min. Scanning done in axial plane parallel to the long axis of the body of corpus callosum. Total of 48 images under age group of 50 to 80 years with no neurological disorders (with mean age = 64.4483, SD = 8.7841) from both male and female, with no neurological problem, another 5 images between the age 60 and 70 (mean = 65 , SD = 3.1113) with cerebral infarction and one 54 years old HIV+ case are considered for the purpose. Image analysis methods are implemented in MATLABTM (Version 7.6).
DTMR imaging is a noninvasive tool for determining white matter connectivity in the brain by measuring random motion of water molecules which is called diffusion. This motion is restricted in the axons due to the existence of myelin sheath and hence the important characteristic of DTMR imaging is to fetch the directional information of microtubule living structure (Davoodi-Bojd and Soltanian-Zadeh, 2009). Axial view of DTMRI modality, images both gray matter and white matter tissues, since anisotropy is dominant in the latter, segmenting of this tissue alone becomes necessary.
ENVISAGING CLINICAL DATA ON ANN
The procedure adopted in this study to correlate changes in BWM with respect to age involves acquisition of clinical DTMRI data, analysis of the data to capture its statistical features and application of the collected data on an ANN towards the intended prediction of age versus observed changes in BWM.
 | |
| Fig. 1: | Flow-chart depicting ANN-based test procedure to correlate the changes measured in BWM versus aging. GLCM: Gray level co-occurrence matrix; BPNN: Backpropagation neural network (used as the test ANN) |
These steps are indicated in Fig. 1 as a flow chart:
TEXTURE ANALYSIS
An image is not just a random collection of pixels; it is a meaningful arrangement of regions and objects. A region in an image has a constant texture if a set of local statistics or other local properties of the picture function are constant, slowly varying, or approximately periodic. Image texture, defined as a function of the spatial variation in pixel intensities (gray values), is useful in a variety of applications and has been a subject of intense study by many researchers. One immediate application of image texture is the recognition of image regions using texture properties. The analysis of texture parameters is a useful way of increasing the information obtainable from medical images with applications ranging from the segmentation of specific anatomical structures to detection of a lesion. Texture analysis can be approached by any of the methods like geometrical, statistical, model-based and signal processing methods.
Depending on the complexity of the image and amount of information to be extracted from the image, statistical method is divided into first order, second order and higher order statistics. First order statistics estimates mean, variance, skewness and flatness. Method based on second-order statistics uses GLCM to extract features. Statistical methods analyze the spatial distribution of gray values, by computing local features at each point in the image and deriving a set of statistics from the distributions of the local features. The reason behind this is the fact that the spatial distribution of gray values is one of the defining qualities of texture (Srinivasan and Shobha, 2008).
Gray level co-occurrence matrix (GLCM): Images containing repeating patterns are said to be “textured”. Texture analysis of such images mainly concerns with feature extraction and image coding. An application of image texture analysis, for example, is the recognition of image regions in terms of texture properties. By representing a complex texture with a small number of measurable features or parameters, significant dimension reduction is feasible enabling automated texture processing. Texture analysis implies formulating a set of statistical measures on the image section being analyzed. The texture is an important characteristic in the analysis of many types of images. Texture classification consists in partitioning a set of images into different classes in such a way that all images belonging to the same class are homogeneously textured. The fundamental problem in texture classification is to determine a proper set of features that can be used to make a distinction between textures (Loum et al., 2007).
The GLCM estimates image properties in terms of second-order statistics defined via co-occurrence matrix of the gray level (GLCM). This second order statistics corresponds to the likelihood of observing a pair of voxel v1 and v2 separated by a distance vector dxy in 2D space (x, y). That is, considering a pair of voxel with intensities i and j occurring at some distance dxy apart, the co-occurrence matrix measures the frequency that a gray scale value appears in relation to another grayscale value on the image. Explicitly, the co-occurrence is defined by:
 | (1) |
where, I is the sub-area under consideration and (Δx, Δy) is the distance vector between corresponding voxels. Further, f(x, y) is the function that describes the 2D map of the image. In the present work, average of four co-occurrence matrices in the direction of 0, 45, 90 and 135 degrees is taken to ensure rotational invariance as suggested by Caban et al. (2007).
Haralick et al. (1973) has proposed fourteen textural features that can be derived from GLCM for the purpose of classifying images on the basis of texture properties (Freeborough Fox, 1998). Given an image composed of pixels each with intensity (a specific gray level), the GLCM indicated earlier is a tabulation of how often different combinations of gray levels co-occur in an image or an image section. It estimates image properties related to second-order statistics. These image properties (commonly known as Haralick texture features) can be used for image classification (Haralick et al., 1973). Explicitly, the fourteen features extracted from an image exhaustively represents the characteristics of the image and they depict, (1) correlation; (2) contrast (3) variance; (4) inverse difference moment; (5) angular second moment; (6) sum average; (7) sum variance; (8) mean; (9) standard deviation; (10) sum entropy; (11) relative entropy; (12) difference variance; (13) information measure of correlation and (14) difference entropy.
Thus, the qualitative aspects of the image textural features can be translated into their corresponding quantitative feature data set in terms of the associated statistical features using GLCM described above. In addition, first-order statistics indicated below can also be considered to quantify textural features. It is approximate but simpler format of feature representation.
This first order statistical texture analysis computes local features at each point in a texture image and derives a set of statistics from the local features defined by the combination of intensities at specified positions relative to each point in the image. These (first order) texture features denote mean, standard deviation, Shannon entropy and variance (Sharma et al., 2008).
The acquired images are segmented for white matter GLCM is computed at 0, 45, 90 and 135 degrees for all the samples. For each GLCM four Haralick parameters like inverse difference moment, angular second moment, entropy and information measure of correlation are computed. These results in 4*4 = 16 measures for each sample. To ensure the rotational invariance mean value over each feature that was obtained from four directions is computed, totaling four measures for each sample. These are the feature values obtained through second order statistics. First order statistical features like mean, standard deviation, entropy and variance are directly computed for the acquired images.
CONSTRUCTION OF NEURAL NETWORK
Artificial Neural Netwrok (ANN) can provide suitable solutions for highly complex and non-linear problems in classifying the inputs. Back Propagation Neural Network (BPNN) algorithm is suitable for pattern recognition and it is based on weight error correction rules.
 | |
| Fig. 2: | Architecture of the constructed BPNN |
The network constructed (Fig. 2) for this study consists of two hidden layers with eight neurons in each layer, a single output and four input nodes. Four different networks are used to classify normal and abnormal CWM’s. Network weights are updated according to resilient backpropagation algorithm:
 |
where xi, yj, b, zk and O are the input, output of first layer, bias, output of second layer and final output respectively for i = n = 1 to 4, j = k = m = 1 to 8.
ANN training: The ANN simulation has two phases. First, a training input pattern is presented to the network-input layer. The network propagates the input pattern from layer-to-layer until the output neuron generates an output pattern. If this pattern is different from the desired (teacher) output, an error is calculated and then propagated backward through the network from the output layer to the input layer. The weights of the interconnections are then modified proportional to the gradient of the error. (Initial settings of the weights are taken as random numbers (0 to 1) of uniform distribution).
Corresponding to GLCM approach, the textural feature map of the image corresponds to a matrix of fourteen parameters. But, only a subset of this matrix containing four features is given as input to the network.
The network is trained to recognize the various data sets obtained from different samples supervised by the preset teacher value on age at the output. Depending on the error (depicting the difference between output and teacher value), network weights are updated according to resilient backpropagation algorithm.
Traditional sigmoidal transfer function of hyperbolic tangent is used between first hidden layer and second hidden layer. This transfer function enables squashing of the output towards convergence. (Sigmoidal and linear functions are used in and between second hidden layer and output layer. The linear function sets a gin/scaling on the output).
In the simulations carried out, the network reads four feature values (out of fourteen) from each of forty eight clinical volunteers and forms a matrix of size 4x48 with corresponding supervisory vector of 48x1. Learning is accomplished by successively adjusting the weights based on a set of input patterns and the corresponding set of desired output values on age. The above said learning process is also carried out by taking four first order features as input to the constructed ANN.
The learning process continues until the network responds with output signals such that the sum of root mean square errors from the output signals is less than preset or stop criteria. The network is now trained to recognize the age available as output vector corresponding to the four input features. The stop criteria indicated above allow the training to stop whenever a maximum number of (pre-specified) epochs occur or when the performance goal of error being 0.001 is met.
RESULTS
To evaluate the age-related changes in brain fiber tracts, the texture anisotropy of the BWM is examined using textural features obtained from real-time DTMR images. As mentioned earlier, these images are obtained from adults with no brain-related pathology under the age group between 50 and 80 years at a particular location of the brain parallel to the long axis of the body of Corpus callosum. Textural features are computed for each sample and stored in data base.
Analysis on normal condition: To evaluate the age related changes in brain fiber tracts, texture anisotropy is examined using textural features obtained from real-time DTMR images. Figure 3a and b shows a slice of DTMRI images under normal and abnormal conditions.
BPNN is trained with four features as input and apriori known age as output. The network is trained separately with first order features and with second order features.
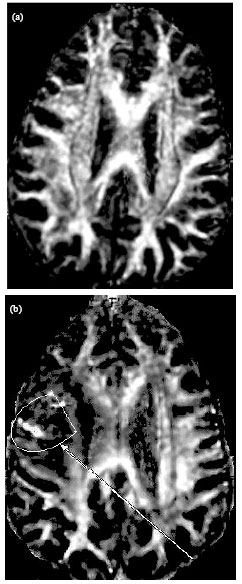 | |
| Fig. 3: | DTMRI 2D-brain slice: (a) image from normal brain and (b) image obtained from stroke affected l brain (cerebral infarction)) |
The network converges for given input and output. Training curve that is obtained is shown in Fig. 4. Now the trained ANN is tested using five unknown sample (data that was not used in training). Also, the predicted age in each case is compared with the age known a priori. The percentage of accuracy of the network lies in the range 90 to 96.
Analysis on infarct condition: A sample of brain white matter with cerebral infarction is shown in Fig. 3b. Used in this study are five subjects in the age group of 60 to 70 years and are diagnosed as stroke (cerebral infarction). These images are processed for textural features and classified using the trained BPNN.
 | |
| Fig. 4: | BPNN training curve (a) first order parameters as input to BPNN (b) second order parameters as input to BPNN |
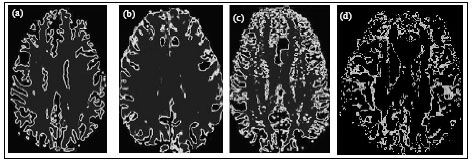 | |
| Fig. 5: | Segmented BWM images, (a and b) normal brain, (c) stroke affected brain and (d) HIV infected brain |
They are classified as approximately 10 to 12 years older than their original age leading to network accuracy approximately as 80%.
Analysis on HIV+ case: One male subject infected by HIV+ was presented to the clinic with difficulty in moving his limbs. He was 54 years old and was diagnosed as Progressive Multifocal Leukoencephalopathy (PML). His BWM was damaged and worst demyelination was observed. When this clinical DTMRI was processed using the proposed technique, the constructed BPNN could not recognize age of the subject. Segmented images under normal, infarct and HIV+ cases are shown in Fig. 5.
DISCUSSION
The brain consists of more than 100 billion neurons and each of these neurons has one axon. Each axon branch communicates with multiple neurons. Notably, axons that share similar destinations tend to form bundles and as they travel toward the deep regions of the brain to achieve long-range connections, they form huge axonal bundles called white matter tracts (Faria et al., 2010). Courchesne et al. (2000) claim that morphology of brain changes throughout the life. The value increases from child hood to 4th decade of life and starts decreasing from late 5th decade onwards and also almost static condition was observed in-between. However the present study is between 50 and 80 years, where the obtained features from the image sample changes such that they were able to be modeled using BPNN and hence age was predicted correctly under normal conditions. However, when the constructed BPNN is used for subjects with neurological problems, the network could not recognize correctly because of change in feature value. This is due to the fact that the computed features replicates the morphology of BWM and such type of study is also discussed by Kalpana et al. (2011). Christos and Susan (2002), claims that their results provide the first demonstration of longitudinal age changes in gray matter and white matter tissue contrast and in regional WM signal intensities, the latter implying degenerative age changes in WM connectivity. Factors that may lead to signal changes include WM demyelination and changes in water, protein and mineral content of tissue. They also claim the possibility of neuropathological abnormalities, such as deposition of amyloidal plaques, may be reflected in signal changes in brain tissue.
Similar type of study is also performed by Freeborough and Fox (1998), where they have computed GLCM, Haralick parameters and classified using a discriminate function for control and Alzheimer’s disease. This study correlates with the present proposed study in the way that here BPNN is used for classification and pathological conditions taken are infarct and HIV+ instead of Alzheimer’s disease.
CONCLUSION
Alterations of the architecture of cerebral white matter in the developing human brain can affect cortical development and result in functional disabilities. In this study, brain maturation as reflected by changes in white matter density with age is investigated. Though the presence of white matter is found in many areas of the brain structure, CWM images are obtained from region parallel to long axis of corpus callosum. This is done because much fiber tracts are found in corpus callosum which interconnects two hemispheres of brain and also CWM is the focus of discussion in this study.
The following conclusions are drawn from this study:
| • | Fiber tracts of the brain changes with respect to age and also based on neurological problems |
| • | Adopted in this paper is the first order and second order statistical technique. Four Haralick’s feature parameters are extracted from GLCM and four first order statistical features are extracted from the samples |
| • | BPNN (with four features as input) is constructed to classify BWM based on age under normal and abnormal conditions |
| • | Though Haralick features are fourteen in number, any four features (a subset of fourteen features) gone almost same result, which is discussed in detail in Kalpana et al. (2010) |
| • | Constructed BPNN could correctly recognize test images of controlled subjects. It could recognize infracted subjects at different age of 10 to 12 years more than the clinical value |
| • | On the other hand the network could not recognize HIV+ case |
| • | This could be due to the fact that high demyelination was clinically reported in the present HIV+ case |
| • | In stroke affected subjects BWM damage is comparatively much less |
| • | Since the constructed BPNN is trained with textural features (that are representatives of BWM morphology), any change in its value could alter the result of the network (age) |
| • | Since the level of demyelination in infarcted subject is much less than HIV+ case, network could recognise stroke affected subjects at lesser accuracy, whereas HIV+ case could not be recognized by the network |
| • | This could also be observed in the figure 5, which shows DTMRI, segmented BWM images on normal, infarct and HIV+ conditions |
REFERENCES
- Iosifescu, D.V., P.F. Renshaw, I.K. Lyoo, H.K. Lee and R.H. Perlis et al., 2006. Brain white-matter hyperintensities and treatment outcome in major depressive disorder. Br. J. Psychiatry, 188: 180-185.
PubMed - Ota, M., T. Obata, Y. Akine, H. Ito, H. Ikehira, T. Asada and T. Suhara, 2006. Age-related degeneration of corpus callosum measured with diffusion tensor imaging. Neuroimage, 31: 1445-1452.
PubMed - Murray, A.D., R.T. Staff, S.D. Shenkin, I.J. Deary, J.M. Starr and L.J. Whalley, 2005. Brain white matter hyperintensities: Relative importance of vascular risk factors in nondemented elderly. Radiology, 237: 251-257.
PubMed - Freeborough, P.A. and N.C. Fox, 1998. MR image texture analysis applied to the diagnosis and tracking of alzheimers disease. IEEE Trans. Med. Imaging, 17: 475-478.
CrossRef - Haralick, R.M., K. Shanmugam and I.H. Dinstein, 1973. Textural features for image classification. IEEE Trans. Syst. Man Cybern., SMC-3: 610-621.
CrossRefDirect Link - Davoodi-Bojd, E. and H. Soltanian�Zadeh, 2009. Grid based registration of diffusion tensor images using least square support vector machine. Adv. Comput. Sci. Eng., 6: 621-628.
CrossRef - Srinivasan, G.N. and G. Shobha, 2008. Statistical texture analysis. Proc. World Acad. Sci. Eng. Technol., 36: 1264-1269.
Direct Link - Caban, J.J., A. Joshi and P. Rheingans, 2007. Texture-based feature tracking for effective time-varying data visualization. IEEE Trans. Visualization Comput. Graphics, 13: 1472-1479.
CrossRef - Sharma, N., A.K. Ray, S. Sharma, K.K. Shukla, S. Pradhan and L.M. Aggarwal, 2008. Segmentation and classification of medical images using texture-primitive features: Application of BAM-type artificial neural network. J. Med. Phys., 33: 119-126.
CrossRef - Faria, A.V., K. Oishi and S. Mori, 2010. Study of white matter anatomy and 3D tract reconstruction by diffusion tensor imaging. Int. J. Imaging Syst. Technol., 20: 51-56.
Direct Link - Ulug, A.M., 2002. Monitoring brain development with quantitative diffusion tensor imaging. Dev. Sci., 5: 286-292.
Direct Link - Chiu, M.C., Y. Long-Jyi and H. Che-Jung, 2008. The deficiency recognition in PCBA's automatic optical inspection system by using back-propagation network method. J. Applied Sci., 8: 2814-2824.
CrossRefDirect Link - Rashid, R., S.M.M. Esivan, S.R. Radzali and A. Idris, 2010. Software sensor for measuring lactic acid concentration: Effect of input number and node number. J. Applied Sci., 10: 2578-2583.
CrossRefDirect Link - Loum, G., C.T. Haba, J. Lemoine and P. Provent, 2007. Texture characterisation and classification using full wavelet decomposition. J. Applied Sci., 7: 1566-1573.
CrossRefDirect Link - Courchesne, E., H.J. Chisum, J. Townsend, A. Cowles and J. Covington et al., 2000. Normal brain development and aging: Quantitative analysis at in vivo MR imaging in healthy volunteers. Radiology, 216: 672-682.
Direct Link - Christos, D. and M.R. Susan, 2002. Degenerative age changes in white matter connectivity visualized in vivo using magnetic resonance imaging. Cerebral Cortex, 12: 767-771.
CrossRefDirect Link - Kalpana, R., S. Multan and B. Agrawala, 2010. Changes in brain white matter assessed via textural features using a neural network. Int. J. Healthcare Inform. Syst. Informatics, 5: 37-48.
Direct Link