
H. Hussin
Department of Mechanical Engineering, University Teknology PETRONAS, Bandar Seri Iskandar, 31750 Tronoh, Perak, Malaysia
F. M. Hashim
Department of Mechanical Engineering, University Teknology PETRONAS, Bandar Seri Iskandar, 31750 Tronoh, Perak, Malaysia
Journal of Applied Sciences
Year: 2011 | Volume: 11 | Issue: 9 | Page No.: 1573-1579


ABSTRACT
Appropriate modeling of maintenance downtime distribution requires sufficient and good quality data. However, in the absence of those conditions of data, an alternative method using expert opinion inputs is usually employed. Literature on the applications of expert opinion in modeling maintenance downtime is found fairly limited. This study aims to fill in that gap and suggest a practical way of incorporating expert opinion in the modeling. A case study of an offshore gas compression train system is presented here to describe the approach used in modeling of preventive maintenance downtime using expert opinion. Using right set of questionnaires and a fractile technique, downtime distributions are successfully elicited from expert. The comparison analysis shows that the downtime distribution derived from expert opinion is tighter than the one estimated solely based on raw plant maintenance data, indicating that the expert opinion approach is a good alternative for estimating the downtime measures of maintenance tasks.
PDF Abstract XML References Citation
Received: October 22, 2010;
Accepted: November 01, 2010;
Published: April 18, 2011
How to cite this article
H. Hussin and F. M. Hashim, 2011. Modeling of Maintenance Downtime Distribution using Expert Opinion. Journal of Applied Sciences, 11: 1573-1579.
DOI: 10.3923/jas.2011.1573.1579
URL: https://scialert.net/abstract/?doi=jas.2011.1573.1579
DOI: 10.3923/jas.2011.1573.1579
URL: https://scialert.net/abstract/?doi=jas.2011.1573.1579
INTRODUCTION
The equipment or system downtime in a plant can be related to two particular events; failures and Preventive Maintenance (PM). This study focuses on the modeling of PM downtime distribution. Accurate modeling of PM downtime distribution is necessary for proper maintenance planning and estimation of system’s availability. The modeling of PM downtime distribution normally uses historical data of equipment downtime. In many cases, the data are limited and in poor quality thus make them inappropriate for modeling purpose. An alternative way is to use expert opinion. Expert is a skillful person who has extensive training and knowledge on the specific area. Expert opinion can be defined as the expert’s formal judgment on the matter in which the expert’s opinion is sought (Ayub, 2001).
The application of expert opinion has been found in various studies covering a wide spectrum of disciplines such as nuclear, chemical, aerospace, health and banking industries (Goossens et al., 2008). In the areas of maintenance and reliability analysis, this application is gaining attention mainly due to unavailability of sufficient and good quality maintenance data to be used in the studies. Coolen et al. (1992) use expert inputs to estimate the prior distribution of the mean life of heat exchangers. Nelson et al. (1998) elicits maintenance engineers’ knowledge to predict a “naked” failure rate (failure rate if no PM actions were being carried out) in light of corrupted maintenance data. The elicitation results are used later to estimate the mean time to failure (MTTF) of shutdown valves. Horkstad et al. (1998) discusses the elicitation process for acquiring failure rate of an offshore umbilical where there is no previous lifetime data exists. The inputs from experts are used in the Fault Tree Analysis (FTA) to predict the probability of the umbilical being tensioned. The application of expert judgments in estimation of delay time distribution for extrusion press failures is presented by Wang (1997). The delay time is the time interval between the first time faults is detected and the time of failure. Kudak and Ercan (2009) study the maintenance time of a jet engine aircraft ignition system failure during the wartime with inputs from military experts.
It is noted that the literatures on applications of expert opinion in the maintenance and reliability field focus primarily on the estimation of failure rate or lifetime distribution. Very little attention has been given on the maintenance downtime estimation. Hence this study aims to fill in that gap and suggests a practical way of incorporating expert opinion in the modeling of maintenance downtime distribution.
ELICITATION OF EXPERT OPINION – AN OVERVIEW
The detailed on elicitation process can be found in Ayub (2001) and Cooke (1991). In general, the elicitation process consists of three stages (Nelson et al., 1998);
| • | Preparation |
| • | Elicitation |
| • | Calculation |
In the preparation stage, the following main activities are done; setting the problem description and objectives, identification of expert(s), formulation of appropriate questionnaire and calculation method. The right design of questionnaires is critical for the elicitation process to be successful (Wang, 1997). The question should be set and asked with simplicity yet able to extract the required information from the actual knowledge of expert (Oien, 1998).
The elicitation stage involves elicitation exercises with the expert. It is normally conducted via an interview and discussion format where the assessor plays critical role in asking the right questions and minimizing expert’s bias (Walls and Quigley, 2001). Two types of elicitation method are commonly employed; direct and indirect (Oien, 1998). The direct method involves a direct estimate of the expert’s believe on a certain issue. The indirect method is applied when seeking the probabilities estimate from the probability-illiterate expert. The interview process should not be too long and it is recommended to be less than half day , since fatigue will normally start to develop after two hours of the session (Cooke and Goossens, 2008).
In the final stage, calculation of inputs from expert is performed to get the results in the required format (e.g., failure rate, lifetime, downtime etc.). Aggregation method is applied when to combine data from more than one expert to establish a single overall output.
Eliciting probability distribution from expert has always been a challenging and uneasy task, particularly when expert has very little knowledge on statistics and probability distribution model (Van der Gaag et al., 1999). Furthermore, the process should be done as short as possible due to the expert time constraint (Mazzuchi et al., 1991) where he is normally busy and has a tight schedule.
Most experts find it difficult if not impossible to state what would be a proper distribution model and its parameters. Elicitation of inputs in a form of discrete distribution (histogram) instead of a continuous distribution has been found to be effective to overcome this problem. Experts usually feel this process more comfortable and easy to comprehend since the concept of probability of failures is being used instead of probability density (Mazzuchi et al., 1991). In addition, the calculation involved in the discrete model is much simpler than the continuous model (Van Noortwijk et al., 1992). The resulted histogram can later be converted into probability density function (pdf) easily using a computer. Another elicitation format which is more effective and popular than a discrete is a quantiles or fractiles format (Cooke and Goossens, 2008). In this method, expert is required to propose pre-defined fractiles on the subjective uncertainty distribution, which are normally set at 5, 50 and 95%. The fractile technique has been widely used for eliciting prior distribution in Bayesian inference study (Kadane and Wolfson, 1998). In their modeling of prior distribution for reliability growth model, Walls and Quigley (2001) use histogram and fractile techniques to develop a Cumulative Distribution Function (CDF). Here, expert is asked to give input on specified distribution percentiles which represent the expert belief on the certain concerns. The percentile distribution is later enhanced by adding more interval data to form a smooth discrete (histogram) distribution which is later converted into a cdf. The corresponding pdf can be later estimated from the cdf.
Siu and Kelly (1998) argue that elicitation process is difficult as far as the result is concern since in practice only rough estimation of expert knowledge is required for applications in decision making. For example, in the elicitation of prior distribution case, the effect of prior distribution on the posterior distribution will reduce with the increasing number of new data, thus there is no point of specifying prior distribution with high degree of accuracy.
CASE STUDY – A GAS COMPRESSION TRAIN
System description: The system under studied is a parallel Gas Compression Train (GCT) (consists of two trains; train 1 and 2), part of a gas compression system on an offshore installation. The GCT main subsystems are gas turbine (GT) and centrifugal compressor. Other subsystems include gearbox, starter, lube oil, fuel, anti-surge valve, turbine control and vibration monitoring system. Figure 1 describes some of main components of the GCT system. Raw gas from well undergoes various treatment processes and later is compressed to higher pressure by a centrifugal compressor driven by a gas turbine before it is transferred to onshore facilities via pipelines.
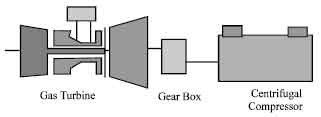 | |
| Fig. 1: | A gas turbine drives a centrifugal compressor to compress gas to higher pressure |
Maintenance data: Maintenance record of the system captures two types of shutdown data; i) unplanned shutdown (USD) due to failures and ii) planned shutdown (PSD) due to preventive maintenance (PM) activities. System shutdown results in downtime. Downtime is defined as the period which the system is in the non-operative state either due to failures or maintenance actions. The downtime data in the maintenance record include the following elements; logistics, administration delay and repair time. More explanation on downtime terminology and elements is given by Smith (2005).
Regular PM works are carried out by maintenance team to keep the GCT system in good operating conditions. The activities include planned PM for every 4000 and 8000 hours operation (4K and 8K) and offline engine detergent wash (engine wash) on a monthly basis. During these activities the affected train experiences a total shutdown. Based on the maintenance data from 2002 till 2008, the shutdown durations for each PM is acquired. The data however are limited, mainly due to poorly recorded data. It is noted that some downtime durations are not clearly specified in the record particularly for the case where PM activities are carried out during unplanned shutdown. Table 1 describes the PM activities and available maintenance downtime data, a combination of train 1 and 2 data.
Motivation for eliciting expert opinion: Table 1 clearly demonstrates a limited number of data for PM events which make it difficult to model PM downtime distribution accurately. Hence, expert opinion is needed. Besides that, the inputs from expert will reflect more up-to-date performances based on the current maintenance capabilities, taking into account changes or improvement made in the maintenance system and team. These changes include improvement in equipment operation and better management of spare parts inventory where a majority of subsystem spares are now available near the site. All of these actions will result in some reduction in downtime duration as PM actions are supposed to be carried out in more effective and efficient manner.
Furthermore, expert opinion can be used as a prior distribution in Bayesian inference analysis. The posterior downtime distribution resulted from Bayesian analysis can be used as input in modeling the availability of the system.
Eliciting maintenance downtime distribution
Elicitation process: Elicitation on PM downtime distribution was done by interviewing experts who were the mechanical and maintenance engineers of that particular offshore plant.
| Table 1: | Descriptions of PM, actions and downtime data |
 | |
They had vast experience on the gas compression system operation, failure data and maintenance system. The elicitation data derived were based on the consensus between them.
Before the downtime distribution for each PM action was elicited, various factors that affect the distribution had to be identified and considered. Neil and Marquez (2009) in their modeling of corrective repair time distribution, refer these conditions as “repair lines” where each line has the probability of the occurrence and can be categorized by a repair time distribution. Examples of types of repair lines include maintenance first line support, second line support and manufacturer support. Following a similar approach, in this study we requested the expert to state various scenarios which will affect the downtime duration of PM actions. In contrast to Neil and Marquez (2009) approach which use arbitrary probability numbers in the model, this study use expert opinion inputs to develop the downtime distribution for each scenario. The question asked during the interview was rather straight forward “what is the probability of scenario A to occur presently”. However, in order to make the expert more comfortable an alternative question was also asked “in 100 events of the particular PM, how many times scenario X occurs”. Table 2 presents the result of this elicitation process where four different scenarios were identified.
The next process involves the estimation of probability distribution of each PM type (4K, 8K and engine wash) for each scenario. Due to expert’s lack of knowledge on the probability distribution family, an indirect elicitation approach using a fractile technique similar to Walls and Quigley (2001)was employed. Here, the expert was required to estimate the downtime duration based on specific confidence level in his belief. Instead of asking question, the statement approach was used where the expert was asked to complete the statement.
| Table 2: | Expert inputs on various scenarios affecting downtime distribution |
 | |
| Table 3: | Results of eliciting downtime distribution by percentiles |
 | |
An example of the statement is as follows “there is a 95% chance that the specific PM action will be completed in x hours”, where the expert had to estimate that x downtime hours. The estimation of downtime hours were also sought for 50 and 5 percentile. The result of this process is shown in Table 3.
Modeling of downtime distribution: The expert inputs in Table 3 represent indirectly the cdf for the downtime distribution. The 50 percentile result represents the median in which half of the downtime distribution is below that point. In this study, we first assume the downtime to follow a lognormal distribution since this is the most commonly used distribution for downtime found in the literature. This assumption, however, is subjected to change if the expert believes otherwise. The lognormal cdf can be expressed as:
| (1) |
where ![]() and s are the mean and standard deviation of downtime’s natural logarithm,
and s are the mean and standard deviation of downtime’s natural logarithm, ![]() is a standard normal distribution cdf and x is the estimated downtime hours. The pdf equation is given by
is a standard normal distribution cdf and x is the estimated downtime hours. The pdf equation is given by
| (2) |
The mean and standard deviation (std) of the actual downtime distribution is given by
| (3) |
| (4) |
For the case of 4K scenario 1, Eq. 1 can be expressed as:
| (5) |
| (6) |
| (7) |
Referring to the normal distribution table, the corresponding equations are as follows:
| (8) |
| (9) |
| (10) |
Solving for ![]() and s based on these three equations resulted in no single value for each parameter. Thus an approximation technique using Solver function in Excel worksheet was employed. The estimated values of
and s based on these three equations resulted in no single value for each parameter. Thus an approximation technique using Solver function in Excel worksheet was employed. The estimated values of ![]() = 4.27 and s = 0.194 were obtained and later being used to create a smoothed cdf plot as shown in Fig. 2. This histogram plot was later shown to the experts for further verification and agreement.
= 4.27 and s = 0.194 were obtained and later being used to create a smoothed cdf plot as shown in Fig. 2. This histogram plot was later shown to the experts for further verification and agreement.
The corresponding pdf plot is shown in Fig. 3. The downtime mean and std were calculated to be 72.9 and 14.2 h, respectively.
RESULTS AND DISCUSSION
Downtime distribution model: The complete analysis results on each scenario for each PM type are presented in Table 4 which shows the proposed distribution and the estimated parameters for each scenario. Lognormal distribution was accepted to be the best model for all PM types.
To get a single distribution for every PM type, all distributions from each scenario need to be combined taking into consideration the weighting factor of probability of occurrence.
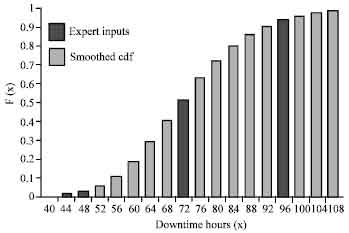 | |
| Fig. 2: | A lognormal cdf for 4K scenario 1 |
 | |
| Fig. 3: | A corresponding lognormal pdf for 4K scenario 1 |
This distribution is called a marginal distribution and can be calculated using a linear opinion pooling technique (Clemen and Winkler, 1999):
 | (11) |
Where:
| f(D) | = | Marginal downtime probability distribution for a particular PM type |
| f(d | scenario =I) | = | The probability distribution for scenario i ( i = 1,2,3,4) |
| P(scenario =I) | = | Probability of scenario i as given in Table 2. |
The resulted marginal distribution for 4K PM is illustrated in Fig. 4. The best estimation of lognormal distribution (Fig. 4) based on that marginal distribution was determined also by using Solver function in Excel. The summary of the estimated lognormal distribution parameters and calculated sum of squared errors (SSE) for all PM types is shown in Table 5.
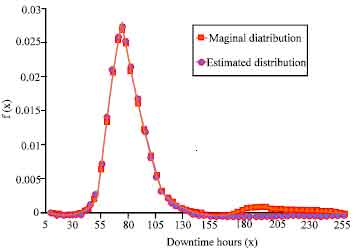 | |
| Fig. 4: | Marginal distribution and estimated lognormal distribution for 4K PM |
| Table 4: | Summary of Pdf distributions |
 | |
| Table 5: | Estimated lognormal distribution parameters and errors |
 | |
| Table 6: | Downtime distribution based on plant maintenance data |
 | |
Plant maintenance data vs. expert opinion: The conventional method to determine the downtime distribution is by solely using plant data. The PM downtime distributions from plant maintenance data in Table 1 are analyzed using Reliasoft Weibull software and the estimated parameters are presented in Table 6.
Based on these parameters, the pdf plots of downtime for each PM type are plotted and then compared against the one derived from expert opinion.
 | |
| Fig. 5: | Expert opinion vs. plant data for 4K |
 | |
| Fig. 6: | Expert opinion vs. plant data for 8K |
 | |
| Fig. 7: | Expert opinion vs. plant data for Engine Wash |
Figure 5-7 show the comparison plot for each PM type. The summary of downtime measures, which includes the downtime mean and downtime length up to which 90, 50 and 10% of PM tasks carried out will be completed, is shown in Table 7.
| Table 7: | Comparison of downtime measures between plant data and elicited expert opinion |
 | |
From the results it can be seen that expert opinion produces tighter downtime distributions for 8K and Engine wash. At 90% of PM task completion rate, expert opinion data have much shorter downtime period. In the case of 4K, the distribution variation is comparable; however, the experts’ prediction on downtime mean is more pessimistic than the prediction based on plant data. Based on the latest data on 2009, the PM recorded downtime of that year for 4 and 8 K PM were 83.5 and 95 h respectively (there was no Engine wash downtime data recorded ). These data are relatively closer to the downtime mean predicted by expert which signifies that the method based on expert opinion is a good alternative to the conventional approach. Better estimation of downtime measure is important since it can provide useful information for plant management regarding the maintenance performance and logistics support issue (Knezevic, 2009) so that more effective and efficient maintenance management system can be planned and implemented.
CONCLUSION
The study has demonstrated how expert input can be incorporated into the analysis of PM downtime distribution, in the absence of sufficient and quality data. The use of fractile technique and right set of questionnaires are found to be very effective in eliciting the required information from the expert. Compared with the downtime distribution estimated solely from raw plant data, the downtime distribution predicted using expert opinion approach is found to have tighter spread, thus indicating that the expert opinion method is a good alternative for estimating the downtime measures of PM tasks.
ACKNOWLEDGMENT
The authors would like to thank UTP for the financial support during this project and anonymous experts for participating in this study.
REFERENCES
- Goossens, L.H.J., R.M. Cooke, A.R. Hale and L. Rodic-Wiersma, 2008. Fifteen years of expert judgement at TUDelft. Safety Sci., 46: 234-244.
CrossRef - Coolen, F.P.A., P.R. Mertens and M.J. Newby, 1992. A Bayes-competing risk model for the use of expert judgement in reliability estimation. Eng. Syst. Safety, 35: 23-30.
CrossRef - Oien, K., 1998. Improved quality of input data for maintenance optimization using expert judgement. Reliabil. Eng. Syst. Safety, 60: 93-101.
CrossRef - Horkstad, P., K. Oien and R. Reinertsen, 1998. Recommendations on the use of expert judgement in safety and reliability engineering studies. Two offshore case studies. Reliabil. Eng. Syst. Safety, 61: 65-76.
CrossRef - Wang, W., 1997. Subjective estimation of the delay time distribution in maintenance modeling. Eur. J. Operat. Res., 99: 516-529.
CrossRef - Kudak, M.H. and S. Ercan, 2009. Uncertainty assessment of aircraft maintenance times. J. Aeronautics Space Technol., 4: 89-97.
Direct Link - Walls, L. and J. Quigley, 2001. Building prior distributions to support Bayesian reliability growth modeling using expert judgement. Reliabil. Eng. Syst. Safety, 74: 117-128.
Direct Link - Cooke, R.M. and L.H.J. Goossens, 2008. TU Deft expert judgement data base. Reliability Eng. Syst. Safety, 93: 657-674.
CrossRef - Van Noortwijk, J.M., R. Dekker, R.M. Cooke and T.A. Mazuzuchi, 1992. Expert judgement in maintenance optimization. IEEE Trans. Reliability, 41: 427-432.
Direct Link - Siu, N.O. and D.N. Kelly, 1998. Bayesian parameter estimation in probabilistic risk assessment. Reliabil. Eng. Syst. Safety, 62: 89-116.
CrossRef - Neil, M. and D. Marquez, 2009. Dependability modelling of repairable systems using bayesian networks. Proceedings of 2nd IFAC Workshop on Dependable Control of Discrete Systems, June 10-12, Bari, Italy, pp: 1-6.
Direct Link - Clemen, R.T. and R.L. Winkler, 1999. Combining probability distributions from experts in risk analysis. Risk Anal., 19: 187-203.
CrossRef