
M.J. Amiri
Department of Water Engineering, School of Agriculture, Isfahan University of Technology, Isfahan, Iran
A. Ebrahimizadeh
Department of Desert Region Management, School of Agriculture, Shiraz University, Shiraz, Iran
S. Amiri
Department of Food Science and Technology, Faculty of Agriculture and Natural Resources, Science and Research Branch, Islamic Azad University, P.O. Box 14515-775, Tehran, Iran
M. Radi
Department of Food Science and Technology, School of Agriculture, Shiraz University, Shiraz, Iran
M. Niakousari
Department of Food Science and Technology, School of Agriculture, Shiraz University, Shiraz, Iran
Journal of Applied Sciences
Year: 2009 | Volume: 9 | Issue: 5 | Page No.: 938-943


ABSTRACT
In this study, the effects of different irrigation methods (furrow, surface drip and subsurface drip) and water qualities (municipal treated effluent and fresh water) with irrigation scheduling based on soil moisture and root depth monitoring were evaluated on the composition and physicochemical quality of the corn flour. A split plot experiment with three main treatments (irrigation methods) and two sub-main treatments (irrigation water qualities) with four replications were designed and executed in Marvdasht sewage station. The magnitude and extent of the factorial influence were measured/conducted using the effects on Water Absorption Capacity (WAC), Swelling Index (SI), solubility (TSS) and Gelatinization Temperature (GT). Based on the results, the corns, irrigated by furrow irrigation method showed higher protein and oil contents than those irrigated by other methods. In each irrigation method, the samples irrigated with effluent, had higher protein content than those irrigated with fresh water. However, the protein content of the grains probably improved with increasing the volume of irrigation water in furrow methods than the other irrigation methods. The sub-surface drip using wastewater can be a good choice from the point view of agriculture (due to its higher water saving and greater yield) and also food industry (because of the high starch content, solubility and swelling index and the least gelatinization point of the corn flours).
PDF Abstract XML References Citation
How to cite this article
M.J. Amiri, A. Ebrahimizadeh, S. Amiri, M. Radi and M. Niakousari, 2009. Comparative Evaluation of Physicochemical Properties of Corn Flours Through Different Water Qualities and Irrigation Methods. Journal of Applied Sciences, 9: 938-943.
DOI: 10.3923/jas.2009.938.943
URL: https://scialert.net/abstract/?doi=jas.2009.938.943
DOI: 10.3923/jas.2009.938.943
URL: https://scialert.net/abstract/?doi=jas.2009.938.943
INTRODUCTION
The great challenge of the agricultural sector is to produce more food from less water, which can be achieved by increasing Crop Water Productivity (CWP). Iran is a country with limited water supplies. Irrigated agriculture is the largest water consuming sector and it faces competing demands from other sectors (Sander and Bastianssen, 2004). With rapidly growing world population, the pressure on limited fresh water resources is being increased (George et al., 2000). Increasing urbanization is producing large volume of wastewater that has become a serious environmental problem. An effective solution for needs is the re-use of municipal effluents for irrigation. Implementing an effective irrigation management program in conjunction with using new irrigation methods and re-use of municipal effluents are effective tools in the management for improvement of water saving (SothSamapundo et al., 2007). As cereals are providing 56% of each person energy in developing countries, the nutritional worth of such crops is vital in these countries. Corn (Zea mays) is one of the most important cereals in the world, not only as a staple food for approximately 400 million people in developing countries, but also as a food ingredient and animal feed. Although, it is the most widely cultivated cereal crop, it ranks third after rice (Oryza sativa) and wheat (Triticum aestivum) in terms of global production (SothSamapundo et al., 2007). As corns are major food crops in the world, quality of the produced flour is a great challenge of food industry. Interactions between flour quality and the quality of water, which has been used for crop irrigation, may be also of great importance for the characteristics of the final products, which is for marketing. Few studies have evaluated the effects of water qualities and irrigation methods on physicochemical qualities of produced flour. Therefore, a comprehensive investigation in this field is necessary. The objectives of this study were to achieve higher water saving from different irrigation methods and to evaluate the effect of water quality and irrigation methods on the quality of the produced flours.
MATERIALS AND METHODS
The corn seeds used in this experiment were Single Cross 704 variety. All other chemicals were reagent grade and were commercially available.
Generation of samples: Three irrigation methods including: Sub-Surface Drip (SSD), Surface Drip (SD) and furrow irrigation with Hydro-Flumes (FH) with two water quality treatments (treated wastewater effluent and fresh water) (Totally six treatments: SSDE (sub-surface drip with effluent)]. SSDF (sub-surface drip with freshwater), SDE (surface drip with effluent], SDF (surface drip with freshwater), FHE (furrow irrigation with effluent) and FHF [furrow irrigation with freshwater] were studied. Three filtration systems (screen, sand media and disc) were set up to filter the effluent before irrigation. The experimental site was located in Marvdasht, Southern of Iran (29° 47 N, 52° 43 E, ASL = 1650 m) with annual rainfall of 340 mm and annual evaporation of 2585 mm (Fig. 1). Study was carried out from April 2006 to September 2006 and April 2007 to September 2007, two full growing seasons for corn production. The experimental design was a split plot with 6 treatments and four replications (total of 24 plots and area of each plot was 42 m2). As the irrigation efficiency was not equal for the different methods of irrigation, the volume of required water within the root zone, for achieving the field capacity, was estimated by monitoring the soil moisture deficit within the root zone. This volume was divided by the efficiency of each method and the applied irrigation water was provided for each plot. The corns were planted on 18 cm wide beds in rows spaced 75 cm apart and depth of 3-5 cm. The growth period was 115 days. There was 20 cm distance between the emitters in SSD and SD methods and the tubes were chosen from the tape type. In SSD treatment, the pipes were buried at 15-20 cm depth from the soil surface. The chemical properties of the soil prior to the experiment are shown in Table 1. Net depth of irrigation water was calculated using the equation below (Bremner and Mulvaney, 1982):
dn = (θƒc – θw) ASxR |
Where:
| dn | = | Net depth of irrigation water (mm) |
| θƒc | = | Soil moisture in field capacity (%) |
| θw | = | Soil moisture, in irrigation time (%) |
| AS | = | Relative density |
| R | = | Root depth, in irrigation time (mm) |
In the time of harvesting, the corn grains were dried in the oven (at 40 °C temperature, for 24 h) and their efficiency was measured for each plot (Woo and Seib, 2002).
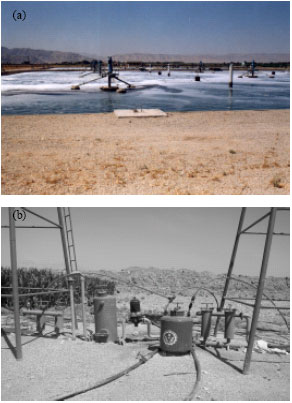 | |
| Fig. 1: | (a) The sewage treatment site and (b) the filtration systems |
| Table 1: | Soil chemical properties prior to the cultivation |
 | |
| *SAR: Sodium Adsorption Ratio | |
One kilogram of grains were selected from each plot randomly and they were grounded in a portable mill (Kenwood, USA, 1995) into flour to pass through a 1 mm sieve. The sampling was done from six treatments and four replications separately.
Samples from wastewater and freshwater were taken to be analyzed in the lab. Water pH was measured with a pH meter. Electrical Conductivity (EC) was determined by conductivity meter (Bremner and Mulvaney, 1982). Total N was determined using the Kjeldahl procedure (Bremner and Mulvaney, 1982). Concentration of soluble Ca and Mg was measured using the EDTA titration method and Na and K was measured using flame photometer (Richards, 1954).
Analysis of samples: Ash and crude fat were measured according to AOAC (Method 984.13; AOAC, 1990). Protein content was measured by Micro-Kjeldahl method (Nx5.7).
Moisture content determination: Two gram of each test flour samples (dry base) were dried in a conventional oven at 105 °C to the constant weight (approximately 3 h).
Water absorption capacity determination: The method of Abbey and Ibeh (1998) was adopted for determination of water absorption capacity. Flour sample (1 g, dry base) of each treatment was weighed separately (and also together with a clean, dry centrifuge tube, into which it was placed). Distilled water was mixed with the flour to make up to 10 mL of dispersion. It was then centrifuged at 3500 rpm for 15 min. The supernatant was discarded and the tube with its contents re-weighed as gram. The gain in mass was the water absorption capacity of the flour sample.
Swelling index determination: Three gram portions (dry base) of each flour were transferred into clean, dry, graduated (50 mL) cylinders. Flour samples were gently leveled and the volumes noted. Distilled water (30 mL) was added to each sample; the cylinder was swirled and allowed to stand for 60 min while the change in volume (swelling) was recorded every 15 min. The swelling power of each flour sample was calculated as a multiple of the original volume as done by Ukpabi and Ndimele (1990).
Solubility determination: The cold water extraction method, as described by Udensi and Onuora (1992), was adopted. Flour dispersion (10% w/v, db) was prepared with each of the flour samples by dispersing 1 g (dry base) of flour in 5 mL distilled water and making it up to 10 mL. It was left for 60 min while it was stirred every 10 min. Then it was allowed to settle for 15 min, after which 2 mL of the supernatant were weighed in a dry Petri dish, evaporated to dryness and re-weighed. The difference in mass is the total soluble solids (Udensi and Onuora, 1992). Solubility was calculated as follows (Udensi and Onuora, 1992):
Solubility = TSS (%) = [(VS Me – Md)/(2 Ms)]x100 |
Where:
| Vs | = | Total supernatant/filtrate |
| Md | = | Mass of empty, dry Petri dish |
| Me | = | Mass of petri dish plus residual solids after evaporative drying |
| Ms | = | Mass of flour sample used in the preparation of the dispersion |
Gelatinization point determination: The method of Narayana and Narasinya-Rao (1982) was adopted in the determination of gelling temperature. The flour sample (10 g dry base) was dispersed in distilled water in a 250 mL beaker and made up to 100 mL of flour suspension. A thermometer was clamped on a retort stand with its bulb submerged in the suspension, with a magnetic stirrer and the system heated. The heating and stirring were continued until the suspension began to gel and the corresponding temperature was recorded.
Statistical analysis: All analyses were performed using the ANOVA procedure of COSTAT and the comparison of means was performed using Duncan multiple range test (DMRT, p ≤ 0.05) (Heidarpour et al., 2007).
RESULTS AND DISCUSSION
Electrical Conductivity (EC) is typically used to indicate soluble salt concentration. In this research, the EC value of wastewater was greater than freshwater. Therefore, the application of wastewater would be expected to cause greater soil EC than freshwater. On the other hand, the Na concentration of effluent as well as the SAR (sodium adsorption ratio) of wastewater was significantly greater than that of freshwater (Table 2). High Na concentration in the soil may cause clay particle swelling and dispersion, resulting in the deterioration of soil physical conductivity (Heidarpour et al., 2007). However, a separate research is needed to evaluate the long- effect of high Na content of wastewater on the soil properties.
There was no significant difference between the pH of wastewater and freshwater (p>0.05). Therefore, there would not be significant effects on soil pH due to wastewater application. Since Ca and Mg concentration of the wastewater was higher than that of freshwater, (p<0.05), irrigation with wastewater generated a greater Ca and Mg concentration than freshwater.
| Table 2: | Chemical properties of effluent and fresh water |
 | |
| The data are the means of two experiments conducted in 2006 and 2007 | |
| Table 3: | Statistical analysis of CWP and yield for irrigation systems |
| Water Productivity, FH: Furrow irrigation, SSD: Sub-Surface Drip, SD: Surface Drip | |
| Table 4: | Statistical analysis of CWP and yield for effluent and fresh water |
| aFor each factor, values with different following letter(s) are significantly different (p<0.05); *CWP: Crop Water Productivity | |
Ca and Mg are known to moderate the influence of Na on soil physical properties. Increasing in Ca and Mg content would lead to a potential decrease in Na damage or influence on soil (Heidarpour et al., 2007).
SSD method with 6100 m3 ha-1 water mean applied had the highest water saving that was followed by SD (6480 m3 ha-1) and FH (7150 m3 ha-1), respectively. SSD has not been applied much in Iran and SD for crops is very new. However, a significant increase has been observed in CWP for corn from 1.43 to maximum 1.91 kg m-3 in FH and SSD methods, respectively. Details are shown in Table 3.
The comparison of results from different irrigation methods on the corn yield showed that SSD increased the yield in compared to SD, but this increasing was not significant at 5%. However, the two mentioned methods, increased the corn yield significantly in compared with FH method (p<0.05). According to Table 4, irrigation with effluent increased the grain yield and CWP as compared to the fresh water, but these differences were not significant at 5%. The statistical analysis of CWP with respect to different irrigation methods showed that SSD increased the CWP comparing to SD method, which was followed by FH (p<0.05).
As water and nutritional factors are considered as limiting factors, it is important to decrease the consumption of water and increase the nutritional quality of the product. In Table 5, the productivity of compositional elements of the corn (Crop Protein Productivity (CPP), Crop Water Productivity (CWP), carbohydrate (CCP) and fat productivity (CFP)) is mentioned. Based on the results of analytical experiments, irrigation method and the quality of irrigation water caused significant differences (p<0.05) in the composition of the flour. According to the data of Table 6, the corns, which were irrigated by furrow methods, had higher protein and fat content and therefore lower carbohydrate content than those of the other methods. In each irrigation method, the corns, which were irrigated with wastewater effluent, showed higher protein contents (10.32%, 10.32 and 8.47% for FHE, SDE and SSDE, respectively) and therefore lower carbohydrate values (75.18, 76.18 and 81.53 for FHE, SDE and SSDE, respectively) than those of fresh water.
| Table 5: | The productivity of different compositional elements of the corn under three irrigation methods with two water qualities |
 | |
| CWP: Crop Water Productivity, CPP: Crop Protein Productivity, CFP: Crop Fat Productivity, CCP: Crop Carbohydrate Productivity | |
| Table 6: | Quality characteristics of flours |
 | |
| For each property, values with different following letter(s) are significantly different (p<0.05), SSDE: Sub-Surface Drip with Effluent, SSDF: Sub-Surface Drip with Freshwater, SDE: Surface Drip with Effluent, SDF: Surface Drip with Freshwater, FHE: Furrow Irrigation with Effluent, FHF: Furrow Irrigation with Effluent | |
The protein content of the grains was increased with the water amount consumed for irrigation. It seems that higher nitrogen content was absorbed by the root as the irrigation water increased. As mentioned before, water quality in addition to water amount, affected the protein content of the grains (however, there was no significant differences between the SDE with FHE treatments).
Water Absorption Capacity (WAC): The properties of a food made from corn flour vary with the amount of water used in a formula (Oh et al., 1986). Comparing the WAC as a function of water quality or irrigation method, The SDE and FHE showed the highest WAC values (75, 76%), while SSDF and SDF showed the lowest values (49, 39%). The WAC of FF and SSDE was 69 and 58%. The WAC values for SDE and FE indicates statistical equivalent (p>0.05). According to the data of Fig. 2., irrigation with effluent gives the best results with reference to the WAC. It seems that the higher protein content of the samples, surrounding the starch granules, has increased the capacity of the flour to adsorb more water. This implies that FHE and SDE methods (especially SDE method, because of higher saving water) can serve as our alternatives with reference to the WAC criterion for corn flours and then the FHF can be chosen.
 | |
| Fig. 2: | Effect of different water qualities and irrigation methods on the water absorption capacity of the corn flours. Values with different following letter(s) are significantly different (p<0.05) |
 | |
| Fig. 3: | Effect of different water qualities and irrigation methods on the swelling index of the corn flours. Each point is the average of four replicates. Different letter(s) show differences statistically (p<0.05). |
Swelling Index (SI): Swelling is evidently a property of amylopectin and amylase is thus a diluent. Polysaccharide (amylose, amylopectin or both depending on the starch) leached from the granules is generally highly correlated with the extent of swelling for each starch (Tester and Morrison, 1990). According to the data of Fig. 3, for SI (ml mL-1) of flour as a function of time for different irrigation methods, the greatest value was for the SSDF, which was followed by SSDE and SDF, respectively. From the ANOVA results of SI as a function of time, no significant differences were observed between FE, SDE and FF (p>0.05). However, FE, SDE and FF showed the lowest SI. It seems that flours with higher carbohydrate content, showed higher SI. This fact expresses the view that the bonding forces of the starch granules are responsible for these flours to exhibit high swelling (Ayernor, 1985). Therefore, SSDE and then SSDF and SDF can serve as our alternatives with reference to the SI criterion.
 | |
| Fig. 4: | Effect of different water qualities and irrigation methods on the solubility of the corn flours. Values with different following letter(s) are significantly different (p<0.05) |
| Table 7: | Effect of different water qualities and irrigation methods on the gelatinization point of the corn floursab |
| The data are the means of two experiments conducted in 2006 and 2007. For each property, values with different following letters are significantly different (p<0.05) | |
Solubility (TSS): Instantaneous data from solubility, TSS (%, dry base) measures of flours are shown in Fig. 4. The SSDE, SSDF and SDF showed the highest solubility values which were 10 in an ambient aqueous environment, while the lowest was 5 from the SDE, FF and FE samples (without significant differences between them (p>0.05)). It seems that TSS was affected by the carbohydrate content of the samples.
Gelatinization Temperature (GT): In the case of SSDF, the least GT (71.5 °C) was obtained. This temperature for the SSDE and SDF was 73 °C, while the least for FF, FE, SDE were 75, 77 and 76 °C, respectively (Table 7). It can be argued that the samples, which have the greatest carbohydrate content (higher starch content) will accordingly gel earliest at relatively lower temperature. ANOVA proved it to be significantly lowest (71.5 and 73 °C, p<0.05).
CONCLUSION
The best water saving and water productivity was obtained with sub-surface drip and surface drip irrigation, respectively. Water quality did not affect CWP and the corn yield, significantly but it affected the protein content of the corn flours. The furrow irrigation system significantly affected the protein and oil contents of the corns, which are so important economically. A dramatic increase in the use of the corn oil (for production of margarines, using in the diet,…) has occurred in the oil market, as it can be stored for long periods without appreciable deterioration (Reiners and Gooding, 1970). In contrast, the corn yield and water productivity were less in this system as compared with the other methods of irrigation.
The SSD increased corn yield and water productivity in compared to the other systems and corn yield and water productivity are two critical factors in the agriculture. However, using the SSD method is not under question from the view of food industry, because in this situation the starch content of the corn increased and corn is considered as an industrial source of starch. As a whole, we can conclude that the SSDE and then SDE can be the choice for using in the agriculture of arid and semiarid regions and also in the food industry (with the highest solubility values and swelling index).
REFERENCES
- Abbey, B.W. and G.O. Ibeh, 1988. Functional properties of raw and heat processed cowpea (Vigna unguiculata, Walp) flour. J. Food Sci., 53: 1775-1777.
CrossRefDirect Link - AOAC, 1990. Official Methods of Analysis. 15th Edn., Association of Official Analytical Chemists, Washington, DC., USA., pp: 200-210.
Direct Link - George, B.A., S.A. Shende and N.S. Raghuwanshi, 2000. Development and testing of an irrigation scheduling model. Agric. Water Manage., 46: 121-136.
CrossRefDirect Link - McLean, E.O., 1982. Soil pH and Lime Requirement. In: Methods of Soil Analysis, Part 2: Chemical and Microbiological Properties, Page, A.L., R.H. Miller and D.R. Keeney (Eds.). 2nd Edn., ASA and SSSA, New York, USA., pp: 199-224.
Direct Link - Heidarpour, M., B. Mostafazadeh-Fard, J.A. Koupai and R. Malekian, 2007. The effects of treated wastewater on soil chemical properties using subsurface and surface irrigation methods. Agric. Water Manage., 90: 87-94.
CrossRefDirect Link - Narayana, K. and M.S.N. Rao, 1982. Functional properties of raw and processed winged bean (Psophocarpus tetragonolobus) flours. J. Food Sci., 47: 1534-1538.
CrossRefDirect Link - Oh, N.H., P.A. Seib, K.F. Finney, Y. Pomeranz and V. Noodles, 1986. Determination of optimum water absorption of flour to prepare oriental noodles. Am. Assoc. Cereal Chem., 63: 93-96.
Direct Link - SothSamapundo, S., F. Devlieghere, B. Meulenaer, A. Atukwase, Y. Lamboni and J. Debevere, 2007. Sorption isoterms and isosteric heats of sorption of whole yellow dent corn. J. Food Eng., 79: 168-175.
CrossRefDirect Link - Zwart, S.J. and W.G.M. Bastiaanssen, 2004. Review of measured crop water productivity values for irrigated wheat, rice, cotton and maize. Agric. Water Manage., 69: 115-133.
CrossRefDirect Link - Tester, R.F. and W.R. Morrison, 1990. Swelling and gelatinization of cereal starches. I. Effects of amylopectin, amylose and lipids. Am. Assoc. Cereal Chem., 67: 551-557.
Direct Link - Woo, K.S. and P.A. Seib, 2002. Cross-linked resistant starch: Preparation and properties. Cereal Chem., 79: 819-825.
CrossRefDirect Link