
A. Malekzadeh Shafaroudi
Research Center for Ore Deposit of Eastern Iran, Ferdowsi University of Mashhad, P.O. Box 91775-1436, Mashhad, Iran
M.H. Karimpour
Research Center for Ore Deposit of Eastern Iran, Ferdowsi University of Mashhad, P.O. Box 91775-1436, Mashhad, Iran
C.R. Stern
Department of Geological Sciences, University of Colorado, CB-399, Co 80309-399, Boulder
S.A. Mazaheri
Research Center for Ore Deposit of Eastern Iran, Ferdowsi University of Mashhad, P.O. Box 91775-1436, Mashhad, Iran
Journal of Applied Sciences
Year: 2009 | Volume: 9 | Issue: 5 | Page No.: 829-842


ABSTRACT
Advanced Spaceborne Thermal Emission and Reflection Radiometer (ASTER) image processing have been used for mapping hydrothermal alteration in Eastern Iran. Eastern Iran has a great potential for the discovery of different types of mineralization. This technique works very well in eastern Iran due to low precipitation causing very minor soil development and the small amount vegetation and therefore good rock exposure. ASTER images processing can identify areas with hydrothermal alteration for further exploration. Application of ASTER false color composite images, color composite ratio images, principal component analysis and Spectral Angle Mapper (SAM) techniques detected five altered areas in the district of SW Birjand, Eastern Iran. Spectral Angle Mapper (SAM) classification proved to be the best method for mineral mapping. This technique shows very good results for identification of different type of alteration with distinct mineral assemblages. The SAM method has also detected argillic and alunitization zones in areas that had not been clearly recognized by earlier techniques.
PDF Abstract XML References Citation
How to cite this article
A. Malekzadeh Shafaroudi, M.H. Karimpour, C.R. Stern and S.A. Mazaheri, 2009. Hydrothermal Alteration Mapping in SW Birjand, Iran, Using the Advanced
Spaceborne Thermal Emission and Reflection Radiometer (ASTER) Image Processing. Journal of Applied Sciences, 9: 829-842.
DOI: 10.3923/jas.2009.829.842
URL: https://scialert.net/abstract/?doi=jas.2009.829.842
DOI: 10.3923/jas.2009.829.842
URL: https://scialert.net/abstract/?doi=jas.2009.829.842
INTRODUCTION
Advanced Spaceborne Thermal Emission and Reflection Radiometer (ASTER) images processing have been successfully used for hydrothermal alteration and geological mapping in recent years (Abdeen et al., 2001; Danishwar, 2001; Rowan and Mars, 2003; Liu and Mason, 2002; Ninomiya, 2002, 2004; Rowan et al., 2003, 2005, 2006; Tommaso and Rubinstein, 2007). Hydrothermally altered rocks have received considerable attention because of their potential economic implication and favorable spectral characteristics for remote identification. Clay and sheet silicates, which contain Al-OH- and Mg-OH- bearing minerals, in sericitic, argillic, potassic and alunitic zones and iron oxides, which contain Fe-OH- bearing minerals, in gossan zones, can both be detected by multispectral image data.
ASTER was launched on board NASA’s TERRA spacecraft in December 1999. This instrument is an advanced multispectral imager that covers a wide spectral region of the electromagnetic spectrum from the visible near infrared (VNIR) to the thermal infrared (TIR). The ASTER spectral range was selected for detecting the main alteration mineral spectral features. The instrument consists of three separate subsystems with a total of 14 bands. The VNIR subsystem obtains optical images (0.52 to 0.86 μm), with a spatial resolution of 15 m. Stereoscopic capability in the track path is also implemented by the 3B band in VNIR. The shortwave infrared (SWIR) subsystem also scans optical images of six bands (1.6 to 2.43 μm), with a spatial resolution of 30 m. The TIR subsystem obtains optical images of five bands (8.125 to 11.65 μm) with a spatial resolution of 90 m (Table 1).
| Table 1: | ASTER spectral passband |
 | |
The swath width of the optical system is 60 km, but a pointing function is provided in the cross-track direction for covering a distance of 172 km at the equator, between neighboring orbits (Fujisada et al., 2001). Compared to the Enhanced Thematic Mapper Plus (ETM+), ASTER has better spectral range and better spatial resolution in the VNIR (Abdeen et al., 2001).
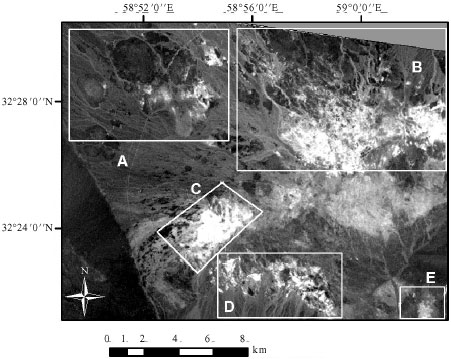
The investigated area in Eastern Iran, covering a region of approximately 400 km2, is situated Southwest of Birjand city, in the center of South Khorasan Province. The area has a semi-arid to arid type of climate and a mountainous topography. Vegetation cover is poor in the area and rocks have good exposure. Therefore, ASTER data can to be an excellent low-cost and short-time method to delineate areas with a high degree of alteration in this region.
Five prospect areas associated with well-developed alteration represented in this area include both Cu-Au porphyry and epithermal gold-type mineralization prospects. Porphyry type deposits are associated with hydrothermal alteration zones such as potassic, sericitic, silicification, argillic and propylitic. Alteration zones associated with epithermal type deposits are alunitization, intermediated and advanced argillic, sericitic, silicification and propylitic. At the same time, iron oxide minerals are developed around many of the porphyry and epithermal deposits due to oxidation sulfide minerals. The purpose of this study is to describe the capability of ASTER for mapping the hydrothermally altered rocks and the country rocks in the study area. The ASTER images processing can identified both type and intensity of well developed of alteration zones.
Geologic setting: The area investigated is situated within the eastern part of the so-called Lut block of eastern Iran. Eastern Iran and particularly the Lut block, has a great potential for different types of mineralization as a result of its past subduction zone tectonic setting, which lead to extensive magmatic activity forming igneous rocks of different geochemical compositions. The Lut block is characterized by extensive exposure tertiary volcanic and subvolcanic rocks formed due to subduction prior to the collision of the Arabian and Asian plates (Camp and Griffis, 1982; Tirrul et al., 1983; Berberian et al., 1999).
Most of the study area is covered by upper Eocene-Oligocene altered volcanic rocks including andesite, dacite, tuff and ignimbrite. These rocks are intruded by felsic to intermediate intrusive porphyritic rocks consisting of monzonite, diorite and microgranodiorite porphyry stocks. Sedimentary rocks in this area consist of conglomerates, minor middle Eocene to upper Eocene tuffaceous marls in the southeastern to eastern area and Quaternary sediments (Fig. 1).
One A prospect area studied, in northwestern part of study region, is a Cu-Au porphyry system. This prospect is dominated by subvolcanic intrusive rocks such as monzonite and diorite porphyry stocks that intruded into upper Eocene-Oligocene volcanic rocks (andesite, tuff and dacite) (Fig. 1). Quartz-Sericite-Pyrite (QSP), argillic and propylitic alteration are most common in the area. Alteration minerals include quartz, sericite, carbonate, chlorite, epidote and clay minerals. Intense quartz stockwork associated with pyrite and minor chalcopyrite as well as oxidized zone minerals such as malachite, iron oxides, clay minerals and copper wad is associated with mineralization in this region. Cu (300 ppm to up to 1 wt. %) and Au (200 to up to 500 ppb) anomalies are coincident with the alteration zones.
Another B prospect, in northeastern part, consists of argillic, alunitization, sericitic and silicified zones which are best developed within upper Eocene-Oligocene andesite, tuff, ignimbrite and dacite that are partly intruded by diorite porphyry dikes (Fig. 1). Disseminated minor pyrite and secondary iron oxides are present in this region. Au and Cu anomalies are coincident. This area can be a high-sulfidation epithermal gold system, which formed above a Cu-Au porphyry deposit.
The C prospect area is similar to low-sulfidation epithermal systems. The rocks are dominantly altered andesite and dacite (Fig. 1). Argillization, sericitization and silicification are common hydrothermal alteration in this area. Mineralization is not seen at surface.
The D prospect area is a Cu-Au porphyry deposit. The geology of this prospect area is partly characterized by hornblend-monzonite porphyry associated with potassic alteration (secondary biotite + magnetite + quartz±chlorite±K-feldspar±calcite), which is in faulted contact with volcanic rocks such as andesite and dacite. Diorite to monzodiorite porphyry unit is other subvolcanic rock in this area. Most of this area is dominantly volcanic rocks (Fig. 1). Other hydrothermal alteration includes sericitic, argillic, tourmalinization and propylitic zones that have been telescoped with potassic alteration by faulting activity. Stockwork, open space filling and disseminated mineralization are recognized. Pyrite and magnetite as well as minor chalcopyrite are common in this area. The oxidized zone consists of malachite and iron oxides. Geochemical data show that Cu (300 ppm to up to 1.5%) and Au (150 to up to 2000 ppb) concentration are coincident.
The E prospect area is situated in southeastern part of study area. This region is dominantly by volcanic rocks such as andesite and gypsiferous marly tuff which they have weekly altered. Argillic zone consist of clay minerals is common hydrothermal alteration in this area. Mineralization is not seen at surface. This area is also similar to low-sulfidation epithermal systems.
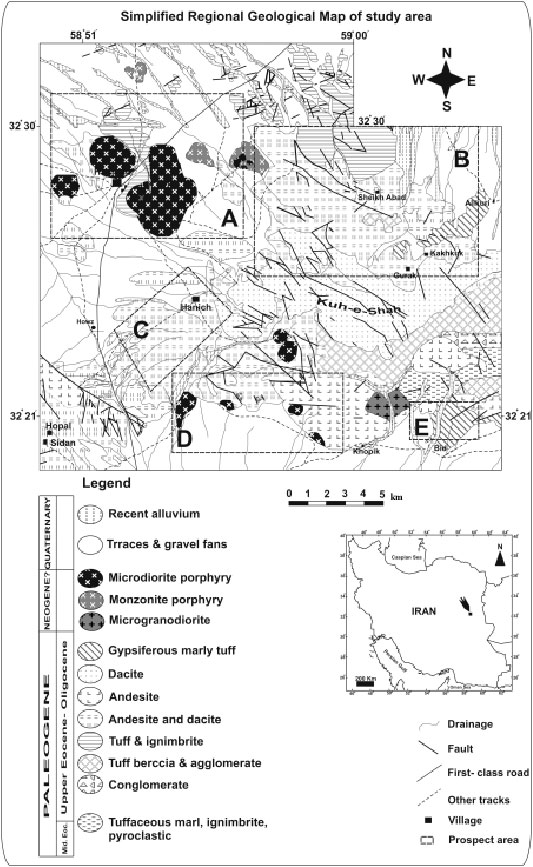 | |
| Fig. 1: | Simplified regional geological map of study area modified after the Sar-e-chah-e-shur map (Vassigh and Soheili, 1975), Mokhtaran map (Movahhed-avval and Emami, 1978) and Khosf map (Eftekharnezhad et al., 1989). Locations of the five known prospect areas A-E are shown |
MATERIALS AND METHODS
In this research, we have analyzed ASTER level 1B data for the identification of hydrothermal alteration. Processing procedures were done by ENVI 4.0 software. The investigated area is within an approximately 400 km2 subset of the ASTER scene (1b-090601-322, Acquisition data 2001/06/18). VNIR and SWIR bands have been used for this study. The images have been corrected by using control points from topographic sheets. Both subscenes are jointed together to form a single image. Different image processing techniques such as false color composite images, ratio images, color composite ratio image, Principal Component Analysis (PCA) image, Intensity-Hue-Saturation (IHS) transformation, filtering, supervised classification and unsupervised classification are normally used for delineating the favorable areas for further exploration. In this study, we have used four different processing techniques for detection of porphyry Cu-Au and epithermal Au deposits in eastern Iran. These are as follow: 1-false color composite, 2-color composite ratio images, 3-Principal Component Analysis (PCA) and 4-supervised classification.
RESULTS AND DISCUSSION
Figure 2 shows reflectance spectra of alunite and three common hydrothermal clay minerals illite, kaolinite and montmorillonite. These minerals have distinctive absorption features (reflectance minima) as wavelengths within ASTER bands 5 (2.145-2.185 μm), 6 (2.185-2.225 μm) and 8 (2.295-2.365 μm). The alteration minerals have higher reflectance values within ASTER band 4 (1.600-1.700 μm) (Fig. 2).
Figure 3 shows spectra of the iron oxide minerals which have low reflectance and high reflectance within ASTER band 1 (0.52-0.60 μm) and band 2 (0.63-0.69 μm), respectively (Fig. 3). These bands provide a useful tool for detection of alteration minerals assemblage in different image processing techniques described below.
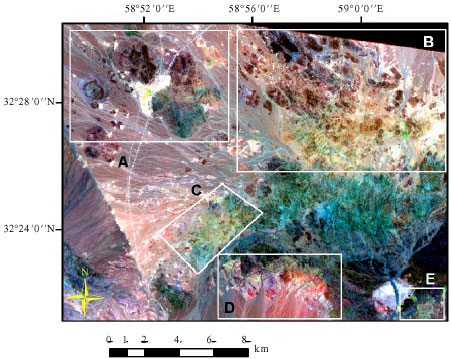
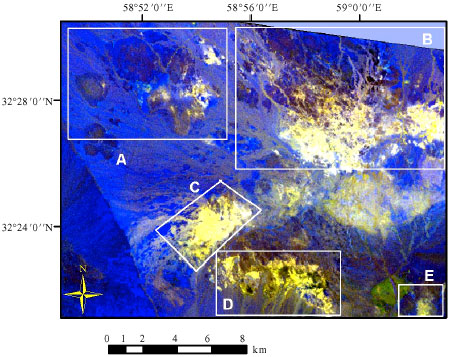
False color composite image: Several false color composite images were produced for enhancing the identification of hydrothermal alteration in the study area. Figure 4 is a false color composite image of ASTER bands 6-3-1 shown in red, green and blue, respectively. Sericitic and argillic alteration zones in A, B, C, D and E prospect areas can be distinguished by a white, bright brown and bright green colors. The propylitic zones were recognized by red color. In D area, this is clearly recognizable due to intense chloritization and epidotization. Vegetation locations were shown by yellow-green color in the study area.
 | |
| Fig. 2: | Reflectance spectra of some common clay minerals |
 | |
| Fig. 3: | Spectral reflectance curves for jarosite, hematite and goethite |
The color composite RGB:631 did not show very good results for lithologic (rock type) discrimination. The Kuh-e-Shah dacite and volcanic rocks south of it were recognized by green and blue-violate color, respectively. Microgranodiorite unit in the southeastern part of district were characterized by white color, whereas tuff unit in northwestern part of the area has a similar color. Volcanic rocks in the northern part of the study area were detected by dark brown, violet and other dark colors (Fig. 4).
Color composite ratio images: In the Ratio technique, bands with high reflectance are divided by bands with high absorption. Ratio images can emphasize and quantify spectral differences between these bands (Sabins, 1999). Therefore ratios such as band 4/band 5, band 4/band 6, band 4/band 8, band 7/band 6, band 5 + band 7/band 6, band 7/band 5 and etc. would yield very high values for altered zones comprising dominantly hydroxyl-bearing minerals.
 | |
| Fig. 4: | Red-Green-Blue color composite of bands 6, 3 and 1 |
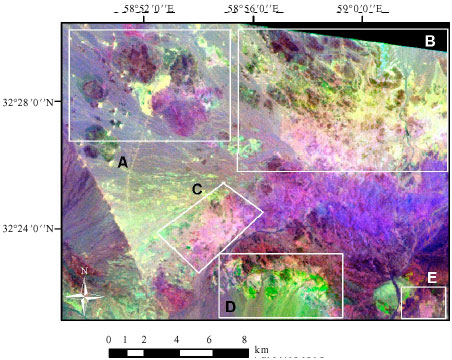 | |
| Fig. 5: | Red-Green-Blue color composite ratio image of 2/1, 5+7/6, 7/5 |
This characteristic of phyllosilicates has been used in numerous mineral exploration investigations. With the same technique, iron oxide minerals can be detected by the band 2/band 1 ratio.
Color composite ratio images are produced by combining three ratio images in red, green and blue. An advantage of the color composite ratio images is that it combines the distribution patterns of both iron minerals and hydrothermal clays. A disadvantage is that the color patterns are not as distinct as in the individual density-sliced images (Sabins, 1999).
More than 15 color composite ratio images have been produced for the target locations. One of these is presented here. In the RGB: 2/1, 5+7/6, 7/5 (Fig. 5), 2/1 ratio can detect iron oxide minerals. 5+7/6 and 7/5 ratios enhance sericite and clay minerals, respectively. The area with sericitic and argillic alteration can be recognized by white to bright violate colors. The five prospect areas can be detected by this technique. Propylitic alteration can be distinguished by green color in this area. Vegetation is detected by yellow color (Fig. 5). Discrimination of different rock unites is better than earlier technique shown in Fig. 4. In violate is Kuh-e-Shah dacite, in purple is unaltered volcanic rocks south of it, in green-white is microgranodiorite unit and in bright yellow is tuff unit of northwestern study area. Volcanic rocks in the northern part of the study area are in brown, violate and other dark colors (Fig. 5).
Principal Component Analysis (PCA): The Principal Component Analysis (PCA) is widely used for alteration mapping in metallogenic provinces (Tangestani and Moore, 2002; Jing and Panahi, 2006). This technique is a multivariate statistical technique that selects uncorrelated linear combinations (eigenvector loadings) of variables in such a way that each successively extracted linear combination, or Principal Component (PC), has a smaller variance (Singh and Harrison, 1985).
Two PCA techniques have been used for ASTER images processing: (1) standard PCA on VNIR + SWIR bands and (2) selective PCA on six (SWIR bands), four or three bands.
In this study, the general statistics and principal component eigenvectors and eigenvalues for VNIR + SWIR bands, SWIR bands, four and three bands have been calculated in different ways. More than 15 different alteration maps of this area have been produced by these PCA techniques and their color compositions. The best images have been selected and are described here.
The statistics and principal component transformation (eigenvectors and eigenvalues) are described in Table 2A-C, using VNIR + SWIR ASTER bands as input bands (bands 1 to 9). It is observed the PC1 does not contain spectral features relevant in this analysis as it is a combination of all bands. This component contains 97.59% of the variance of the nine bands (Table 2C). The PC1 gives information mainly on albedo and topography. The PC3 has higher loadings of band 4 (-0.80).
| Table 2A: | General statistics for 9 bands (VNIR+SWIR) |
 | |
| Table 2B: | Correlation matrix for 9 bands (VNIR+SWIR) |
 | |
| Table 2C: | Principal components for 9 bands (VNIR+SWIR) |
 | |
 | |
| Fig. 6: | The hydroxyl (-PC3) image shows the altered areas in bright pixels |
This PC should detect the hydroxyl minerals in dark pixels because of negative contributions of band 4 and positive contributions of band 5 (0.35) or 6 (0.39). The PC8 has a higher negative loading of band 2 (-0.61). This PC should represent iron oxides in dark pixels because of negative contributions of band 2 and positive contributions of band 1 (Table 2C). The PC3 image clearly detects the location of alteration zones in dark pixels. In order to show the areas with hydroxyl minerals in bright pixels (Fig. 6) an inverse of this PC is obtained by using Eq. 1.
PC3 = -0.16 (band 1) - 0.01 (band 2) + 0.13 (band 3) + 0.80 (band 4) - 0.35 (band5) - 0.39 (band 6) + 0.06 (band 7) - 0.03 (band 8) - 0.14 (band 9) | (1) |
The selected principal component analysis on 6 and 3 bands has also been applied in study area. The statistics and PC eigenvectors and eigenvalues have been calculated in Table 3A-C, using bands 4, 5, 6, 7, 8 and 9 (SWIR) as input bands. The PC2 has higher positive loadings of band 4 (0.81). This PC detects the hydroxyl minerals in bright pixels because of positive contributions of band 4. The PC3 has a higher negative loading of band 4 (-0.34). This PC should represent hydroxyl minerals in dark pixels because of negative contributions of band 4 (Table 3C). In order to show the areas with hydroxyl minerals in bright pixels an inverse of this PC is obtained by using Eq. 2.
PC3 = 0.34 (band 4) + 0.43 (band 5) + 0.40 (band 6) - 0.10 (band 7) - 0.54 (band 8) - 0.47 (band 9) | (2) |
The statistics and PC eigenvectors and eigenvalues have been calculated in Table 4A-C, 5A-C and 6A-C using bands 4, 6 and 7, 4, 5 and 7 and 2, 5 and 8 as input bands, respectively.
Table 4C shows that clay minerals and sericite should be enhanced in PC2 because of higher loadings of band 4 (0.74). This PC should detect these minerals with dark pixel due to positive contributions of band 4 and negative contributions of bands 6 and 7. In order to show the areas with hydroxyl minerals in bright pixels an inverse of this PC is obtained by using Eq. 3.
PC2 = -0.74 (band 4) + 0.65 (band 6) + 0.11 (band 7) | (3) |
Table 5C shows that alunite should be detected in PC2 because of higher loadings of band 4 (0.74). This PC should detect these minerals with dark pixel due to positive contributions of band 4 and negative contributions of bands 5 and 7. In order to show the areas with hydroxyl minerals in bright pixels an inverse of this PC is obtained by using Eq. 4.
PC2 = -0.74 (band 4) + 0.64 (band 5) + 0.15 (band 7) | (4) |
Table 6C shows that propylitic zone should be detected in PC2 because of higher loadings of band 2 (0.78). This PC should detect this zone with dark pixel due to positive contributions of band 2 and negative contributions of bands 5 (-0.62) and 8 (-0.04). In order to show the areas with hydroxyl minerals in bright pixels an inverse of this PC is obtained by using Eq. 5.
PC2 = -0.78 (band 2) + 0.62 (band 5) + 0.04 (band 8) | (5) |
| Table 3A: | General statistics for 6 bands (SWIR) |
 | |
| Table 3B: | Correlation matrix for 6 bands (SWIR) |
 | |
| Table 3C: | Principal components for 6 bands (SWIR) |
 | |
| Table 4A: | General statistics for 3 bands |
 | |
| Table 4B: | Correlation matrix for 3 bands |
 | |
| Table 4C: | Principal components for 3 bands |
 | |
| Table 5A: | General statistics for 3 bands |
 | |
| Table 5B: | Correlation matrix for 3 bands |
 | |
| Table 5C: | Principal components for 3 bands |
 | |
Color composition PC images are also useful technique for hydrothermal alteration mapping (Ranjbar et al., 2004; Roustaei et al., 2006).
 | |
| Fig. 7: | Red-Green-Blue color composite image of PC2 (467), PC2 (457) and PC3 (258) |
| Table 6A: | General statistics for 3 bands |
 | |
| Table 6B: | Correlation matrix for 3 bands |
 | |
| Table 6C: | Principal components for 3 bands |
 | |
This technique is produced by combining three PC images in red, green and blue. Color composition of PC2 (467), PC2 (457) and PC3 (258) in red-green-blue is shown in Fig. 7. Sericitic and argillic alteration have been characterized by yellow-white color. Discrimination of these zones is not possible in this method. In southern part of (B) prospect area can also be distinguished by yellow pixels differ from other areas. Propylitic zone is in brown-green color which can recognize in D area. Discrimination of different rock units is not good in this image. All of rocks are in blue or minor green color (Fig. 7).
Supervised classification: Multispectral classification is a computer routine for information extraction that assigns pixels into classes based on similar spectral properties. In a supervised multispectral classification, the operator specifies the classes that will be used (Sabins, 1999). This method has been used for hydrothermal alteration mapping in porphyry copper deposit (e.g., Infiernillo, Argentina, Tommaso and Rubinstein, 2007).
In this research, we have used Spectral Angle Mapper (SAM) method for supervised classification. Quantitative spectral mapping techniques, such as the Spectral Angle Mapper (SAM) method (Kruse et al., 1993), operate by comparing image spectra with reference spectra. It was developed for hyper spectral images, but can be used in lower resolution systems (Rowan and Mars, 2003). Hyper spectral and ASTER images have up to 255 and 14 bands, respectively, therefore hyper spectral is more accuracy to mapped the minerals.
The image spectra were compared with the USGS Digital Spectral Library (Minerals) (Clark et al., 1993) loaded in ENVI 4.0 software in the study area. Three minerals spectral representative of propylitic zone include chlorite, epidote and zoisite and five minerals spectral representative of sericitic and argillic alteration consist of quartz, sericite, kaolinite, montmorillonite and pyrophyllite were selected.
 | |
| Fig. 8: | Chlorite, epidote and zoisite spectral library plots from USGS library as representative of propylitic zone |
 | |
| Fig. 9: | Kaolinite, montmorillonite, pyrophyllite, sericite and quartz spectral library plots from USGS library as representative of sericitic and argillic zones |
At the same method, alunite, jarosite, gypsum, hematite, goethite and limonite spectrals can be also selected as secondary minerals zone representative. Fig. 8 to 10 show selected minerals spectral library plots.
This technique shows very good results for identification of type of alteration, its developing, mineral assemblages and locating of each mineral. Figure 11 shows the SAM’s result of propylitic zone overlain on band 1 include of chlorite in green pixels, epidote in red and zoisite in blue. Propylitic alteration is recognized in A, B, C and D prospect areas associated with different amount. High chlorite, epidote and zoisite represented in D area due to intense propylitic alteration. Some alteration minerals distinguished in drainages in southern part of D area as result of altered rocks erosion (Fig. 11).
Figure 12 shows the SAM, s result of sericitic and argillic zones overlain on band 1 include of quartz in red pixels, sericite in yellow, kaolinite in blue, montmorillonite in bright green and pyrophyllite in green. Five altered areas can be clearly distinguished by this method. Quartz and sericite are the most common minerals in A, B, C and D prospect areas.
 | |
| Fig. 10: | Alunite, jarosite, gypsum, hematite, goethite and limonite spectral library plots from USGS library as representative of secondary minerals zone |
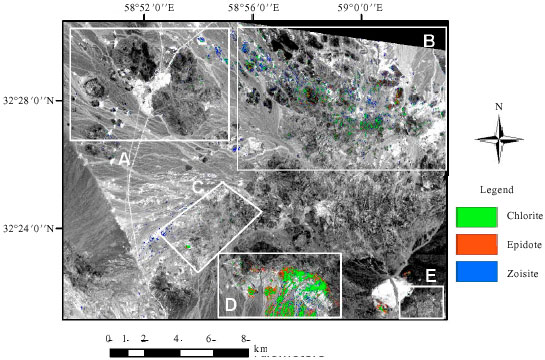 | |
| Fig. 11: | Results of SAM classification method for propylitic zone, overlain on band 1 |
Kaolinite is also common clay mineral in this region. E area is recognized by argillic alteration. South of B prospect area (Kuh-e-Shah) can also been clearly enhanced by argillic zone. Location of clay minerals, quartz and sericite sometimes coincides with together due to approximately spectral similarity (Fig. 9). Microgranodiorite unit, in southeastern part of area, is also detected by argillic alteration that had not been clearly recognized in earlier techniques (Fig. 12).
Figure 13 shows the SAM’s result of secondary minerals zone overlain on band 1 include of alunie in green pixels, jarosite in bright green, gypsum in brown, hematite in red, limonite in yellow and goethite in blue. Hematite and jarosite are the most common gossan zone minerals in A, B, C and D prospect areas. Alunite can clearly detect in southern part B prospect area. Some alunite has also been recognized the east of B area (Fig. 13).
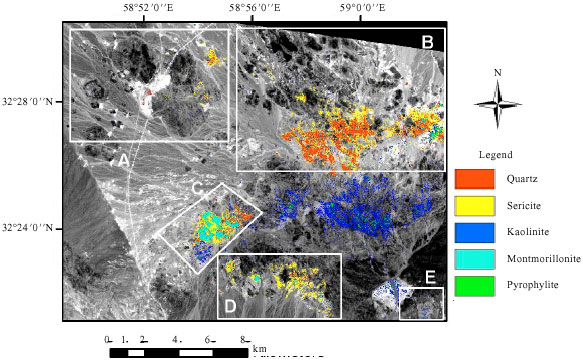 | |
| Fig. 12: | Results of SAM classification method for sericitic and argillic zone, overlain on band 1 |
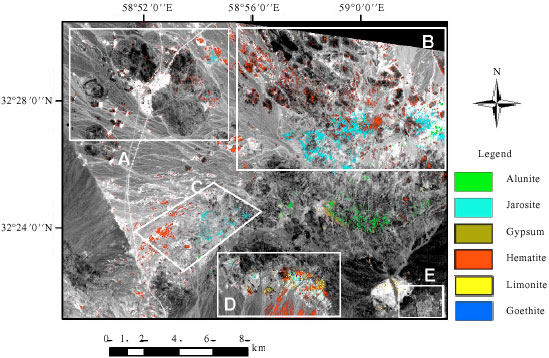 | |
| Fig. 13: | Results of SAM classification method for secondary minerals zone, overlain on band 1 |
The obtained results from ASTER SAM classification method have been confirmed by on the ground field geology such as alteration and mineralization mapping in the district.
CONCLUSION
Most of mineral resources in eastern Iran have remained unknown and virgin due to semi-arid to arid type of climate, presence of developed desert, lack of suitable access roads and finally imperfect information. The Lut block has a great potential for different types of mineralization, particularly porphyry copper and epithermal gold deposits, as result of its suitable subduction zone tectonic setting resulting in the presence of calc-alkaline subvolcanic rocks. Five porphyry and epithermal prospect areas in this area are the best documents for this claim.
ASTER images processing is a successfully low-cost and short-time technique for delineating favorable areas for further exploration. This technique works very well in eastern Iran due to low precipitation causing very minor soil development and the small amount vegetation and therefore good rock exposure.
In this study, different image processing methods were used. SAM classification is the best method for identification of type of alteration and different alteration mineral assemblages. The SAM method have also detected argillic and alunitization zones in the south part of the (B) area and argillic alteration in microgranodiorite unit in southeastern area that had not been clearly recognized in earlier techniques.
ACKNOWLEDGMENT
This research project was sponsored by Ferdowsi University of Mashhad, Iran with grant No. {P/85- 2008-03-20).
REFERENCES
- Abdeen, M.M, A.K. Thurmond and M.G. Abdelsalam, 2001. Application of ASTER band ratio images for geological mapping in arid region: The Neoproterozoic Allaqi Suture, Egypt. GSA Annual Meeting, 5-8 November, 2001, Boston, Massachusetts. http://gsa.confex.com/gsa/2001AM/finalprogram/abstract_27348.htm.
- Berberian, M., J.A. Jackson, M. Qorashi, M.M. Khatib, K. Priestley, M. Talebian and M. Ghafuri-Ashtiani, 1999. The 1997 may 10 Zirkuh (Qaenat) earthquake (Mw 7.2): Faulting along the Sistan suture zone of eastern Iran. Geophys. J. Int., 136: 671-694.
CrossRef - Camp, V. and R. Griffis, 1982. Character, genesis and tectonic setting of igneous rocks in the Sistan suture zone, eastern Iran. Lithous, 15: 221-239.
Direct Link - Fujisada, H., A. Iwasaki and S. Hara, 2001. ASTER stereo system performance. Int. Soc. Opt. Eng., 4540: 39-49.
Direct Link - Jing, Q.C.L. and A. Panahi, 2006. Principal component analysis with optimum order sample correlation coefficient for image enhancement. Int. J. Remote Sens., 27: 3387-3401.
CrossRef - Kruse, F.A., A.B. Lefkoff, J.B. Boardman, K.B. Heidebreicht, A.T. Shapiro, P.J. Barloon and A.F.H. Goetz, 1993. The spectral image processing system (SIPS)-interactive visualization and analysis of imaging spectrometer data. Remote Sens. Environ., 44: 145-163.
CrossRefDirect Link - Roustaei, M., M. Dehghani, J. Gingerich and C. Durocher, 2006. Mineral potential mapping in Khoy- Oshnavieh area of NW Iran, using Landsat ETM+ and ASTER images. J. Geologi. Soci. Iran, 1: 43-51.
Direct Link - Rowan, L.C. and J.C. Mars, 2003. Lithologic mapping in the mountain pass, california area using advanced spaceborne thermal emission and reflection radiometer (aster) data. Remote Sens. Environ., 84: 350-366.
Direct Link - Rowan, L.C., S.G. Hook, A.J. Abrams and J.C. Mars, 2003. Mapping hydrothermally altered rocks at Cuprite, Nevada, using the advanced spaceborne thermal emission and reflection radimeter (ASTER), a new satellite-imaging system. Econ. Geol., 98: 1019-1027.
CrossRef - Rowan, L.C., J.C. Mars and C.J. Simpson, 2005. Lithologic mapping of the mordor, nt, australia ultramafic complex by using the advanced spaceborne thermal emission and reflection radiometer (aster). Remote Sens. Environ., 99: 105-126.
CrossRef - Rowan, L.C., R.G. Schmidt and J.C. Mars, 2006. Distribution of hydrothermally altered rocks in the Reko Diq, Pakistan mineralized area based on spectral analysis of ASTER data. Remote Sens. Environ., 104: 74-87.
CrossRef - Singh, A. and A. Harrison, 1985. Standardized principal components. Int. J. Remote Sens., 6: 883-896.
CrossRef - Tangestani, M.H. and F. Moore, 2002. Porphyry copper alteration mapping in the Meiduk area, Iran. Int. J. Remote Sens., 23: 4815-4825.
CrossRef - Ranjbar, H., M. Honarmand and Z. Moezifar, 2004. Application of the crosta technique for porphyry copper alteration mapping, using ETM+ data in the southern part of the Iranian volcanic sedimentary belt. J. Asian Earth Sci., 24: 237-243.
CrossRef - Tommaso, I.D. and N. Rubinstein, 2007. Hydrothermal alteration mapping using ASTER data in the Infiernillo porphyry deposit, Argentina. Ore Geol. Rev., 32: 275-290.
CrossRef - Tirrul, R., I.R. Bell, R.J. Griffis and V.E. Camp, 1983. The sistan suture zone of Eastern Iran. Geol. Soc. Am. Bull., 94: 134-156.
CrossRef