
M.H. Karimpour
Research Center for Ore Deposit of Eastern Iran, Ferdowsi University of Mashhad, P.O. Box 91775-1436, Iran
C.R. Stern
Department of Geological Sciences, University of Colorado, CB-399, Boulder
Journal of Applied Sciences
Year: 2009 | Volume: 9 | Issue: 5 | Page No.: 815-828


ABSTRACT
Thirty scenes of Aster data from eastern Iran were processed using the Multispectral supervised classification method for identifying hydrothermal alteration zones related to possible mineral deposits. Several areas having great potential for mineral exploration were identified. ASTER mineral mapping from three known types of gold mineralization in eastern Iran were compared. Chah Shaljami, a high sulfidation Au (lithocap of porphyry Cu) prospect, shows alunite, silica, jarosite, dickite, montmorillonite and gypsum. Alteration is intense and covers an area of 3x4 km2. Aeromagnetic data show low magnetism within the area of alteration, indicating that magnetite was destroyed during alteration. Qaleh Zari is a specularite-rich Iron oxide Cu-Au deposit (IOCG). ASTER mineral mapping shows only epidote and chlorite. Alteration is narrow and is linear. Aeromagnetic data show high magnetism in most of the area, therefore alteration did not destroy the primary magnetite. Hired is a reduced-intrusion-related Au prospecting area. ASTER mineral mapping shows tourmaline, chlorite, silica and minor sericite. Alteration is local and is not as extensive as at Chah Shaljami. Aeromagnetic data show a very broad area of low magnetism that is associated with reduced ilmenite series intrusive rock.
PDF Abstract XML References Citation
How to cite this article
M.H. Karimpour and C.R. Stern, 2009. Advanced Spaceborne Thermal Emission and Reflection Radiometer Mineral Mapping to Discriminate High Sulfidation, Reduced Intrusion Related and Iron Oxide Gold Deposits, Eastern Iran. Journal of Applied Sciences, 9: 815-828.
DOI: 10.3923/jas.2009.815.828
URL: https://scialert.net/abstract/?doi=jas.2009.815.828
DOI: 10.3923/jas.2009.815.828
URL: https://scialert.net/abstract/?doi=jas.2009.815.828
INTRODUCTION
Aster and Landsat are two important commercial satellites that were launched to study by remote sensing different aspect of the earth surface, especially mineral resources. The Advanced Spaceborne Thermal Emission and Reflection Radiometer (ASTER) is an advanced multispectral imager that was launched on board NASA’s Terra spacecraft in December, 1999 (Abrams and Hook, 2000). Landsat-1 was launched in 1972 and the most recent, Landsat-7 ETM+, was launched in 1999.
A remote sensing system has several components, including the sun as the source of electromagnetic radiation, the transmission path of this radiation, the target and the sensor. These components work together to provide information about a target without actually coming into physical contact with it. To study different aspect of the earth’s surface, the satellite sensor must provide the spatial, spectral and temporal resolution necessary to meet the needs of the application. Spatial resolution refers to the amount of detail that can be detected by a sensor. ASTER has greater spatial resolution than Landsat. The spatial resolution of ASTER varies with wavelength: 15 m in the visible and near-infrared (VNIR), 30 m in the short wave infrared (SWIR) and 90 m in the thermal infrared (TIR). Spectral resolution refers to the width or range of each spectral band measured by a sensor. ASTER covers a wide spectral region with 14 bands from the visible to the thermal infrared, each with high spatial, spectral and radiometric resolution.
Spectra of common alteration minerals related to hydrothermal ore deposits such as alunite, sericite, kaolinite and dickite have several pikes for wave length of 2.1-2.4 (μm). For wave-lengths of 2.1-2.4 (μm) Landsat has only one spectral band, but ASTER has five spectral bands. Therefore ASTER remains far in advance of LANDSAT for differentiating and to identify these minerals. Each ASTER scene covers an area of 60x60 km. Mineral Mapping these and other minerals with ASTER data it is possible to identify important and key minerals associated with specific geologic units and hydrothermal alteration associated with ore deposits.
ASTER mineral mapping is being done for mineral exploration and mapping geological unites.
| Table 1: | Gold classification |
 | |
Selective articles in this field are: Mapping hydrothermally altered rocks at Cuprite, Nevada (Rowan et al., 2003); Application of ASTER data to geological studies (Rowan and Mars, 2003; Yamaguchi et al., 1996); Alteration mineral mapping in the Central Andes (Hubbard et al., 2007); Mapping lithological variations with visible to thermal infrared spectroscopy; a case study from Gold Butte (Hook and Howard, 2001); Alteration mineralogy at the Cerro La Mina epithermal prospect, Patagonia, Argentina (Ducart et al., 2006); Geologic mapping and mineral resource assessment of the Healy and Talkeetna Mountains Quadrangles, Alaska. Regional mapping of phyllic- and argillic-altered rocks in the Zagros magmatic arc, Iran (Mars and Rowan, 2006); Targeting key alteration minerals in epithermal deposits in Patagonia, Argentina, using ASTER imagery and principal component analysis (Crosta et al., 2003); Extraction of promising mineral area and acquisition of mining property using satellite image analysis technique in northern Chile (Yoshizawa et al., 2003); Copper explorations based on a satellite-image analysis technique in northern Chile; the recent results of exploration activity (Asaki et al., 2004).
ASTER mineral mapping will be used to discriminate three types of gold deposits such as high sulfidation Au; Iron Oxide Cu-Au Deposits and Reduced intrusion related. Gold deposits classified as in Table 1: 1-Porphyry gold deposits (Hollister, 1992; Stephens et al., 2004; Sillitoe and Thompson, 1998; Sillitoe, 1997), 2-Reduced intrusion related (Lange and Baker, 2001; Sillitoe, 2002); 3-Iron-oxides Cu-Au (IOCG) (Williams et al., 2005; Sillitoe, 2003; Barton, 2001; Haynes, 2000; Hitzman, 2000) and 4-Epithermal deposits (Hedenquist et al., 2000; Sillitoe, 1993). 5-Shear zones regional metamorphism (Groves et al., 2003).
MATERIALS AND METHODS
Thirty scenes (each is 60x60 km) of Aster data from Eastern Iran were processed for mineral mapping. Geometric Corrections carried out by ENVI 4.2 software to put ASTER image elements in their proper planimetric (x and y) positions. To do so more than 50 points in each ASTER image are registered to corresponding points in digitized topography map (topography maps at scale of 1:100000 and 1:25000). Radiometric corrections, which attempt to remove the effects of sensor errors and/or environmental factors. IAR calibration tools present in ENVI 4.2 software was used to remove solar irradiance, atmospheric transmittance, instrument gain, topographic effects and albedo effects from radiance data.
Different methods are being used for mineral mapping such as: 1-principal component analysis (PCA); 2-Ratio Images (Ratio images are prepared by dividing the DN in one band by the corresponding DN in another band for each pixel, stretching the resulting value and plotting the new values as an image). Ratio of bands 4/6 identifies all types of clay, 7/6 alunite, pyrophyllite, 8/6 alunite, 9/8 calcite, talc, chlorite and epidote. 3-Multispectral Classification (Supervised Classification, Unsupervised Classification, Minimum Distance Classification, Maximum Likelihood Classification, Probabilistic Neural Network Classifier).
The multispectral supervised classification method was used in this research and exploration. Processing procedures were done by ENVI 4.2 software using Multispectral supervised classification method (Sabins, 1999). To establish a GIS database, important information such as geology, mining and geophysics were digitized:
| • | 22 Geological maps at scale of 1:100000 from eastern Iran were digitized. |
| • | Active-abandon mine and mineral index were digitized |
| • | Aeromagnetic, U-Th data (specially taken for mineral exploration) were obtained from Geological Survey of Iran. |
The results of ATER Mineral mapping were checked on the ground to verify the result of image processing.
RESULTS AND DISCUSSION
Geology and mineralization: Three contrasting type of gold deposits were studied, including: 1-Iron Oxides Cu-Au (Qaleh Zari deposit); 2-Reduced intrusion related Au (Hired) and 3-High Sulfidation lithocap porphyry copper (Chah Shaljami). They are located within the Lut Block in Eastern Iran (Fig. 1).
 | |
| Fig. 1: | Schematic map of the location of Hired, Qaleh Zari and Chah Shaljami within the Lut Block |
The Lut Block is essentially a north-south-trending microplate surrounded by the mountain ranges of central and eastern Iran (Fig. 1). The Lut Block extends over 900 km in a north-south direction and is only 200 km wide in an east-west direction. It is confined by the Nayband fault and Shotori Range in the west and the Eastern Iranian Ranges in the east (Fig. 1). The western edge of the Lut Block is cut off by the Nayband normal fault. The northern termination of Lut Block is the depression of Kavir-e-Namak and the Great Kavir Fault. The Bazman volcanic complex and the Jaz-Murian-Depression define the southern edge. The eastern edge is dissected by Sistan suture zone (Fig. 1). The Lut Massif has a relatively low degree of Cretaceous Alpine deformation. Most of the area is covered with Tertiary volcanic and plutonic rocks, continental sediments and scattered outcrops of Mesozoic and Paleozoic rocks.
Qaleh Zari deposit: Qaleh Zari is specularite-rich Cu-Au deposit (IOCG). The oldest rocks exposed in the mine area are Jurassic shale and sandstone (Fig. 2). Tertiary volcanic rocks are dominant in the mine area and in the region (Karimpour et al., 2005). They consist mainly of K-rich andesite and andesitic-basalts, with minor dacite and basalt.
 | |
| Fig. 2: | Geological map of Qaleh-Zari area |
Total Fe of the volcanic rocks in the Qaleh-Zari region is high (TFeO = 6 to 8.4%) and most of Fe is present as Fe2O3 (Fe2O3 = 2.2 to 5.34%) (Karimpour et al., 2005). These volcanic rocks are calc-alkaline to K-rich calc-alkaline with transition to shoshonitic association. They have a geochemical signature typical of subduction-related magma.
Three main mineralized zones were identified in the area. The NW part of the deposit (No. 1), which is associated with three major sub-parallel quartz veins, the SE portion (No. 3) and the central part (the main vein set-No. 2).
Quartz is the most common constituent in all of the veins, forming euhedral crystals, 1 to 10 cm long and the quartz veins and veinlets typically have specularite (hematite) bands at the margins (Fig. 3). Specularite makes up 10 to 25% of the veins and is the most abundant oxide after quartz.
 | |
| Fig. 3: | Mineral paragenesis of Qaleh Zari IOCG deposit (Karimpour et al., 2005) |
In all veins and veinlets, the general paragenetic sequence was: specularite followed by quartz-chlorite associations and finally chalcopyrite (Fig. 3). Different sulfosalts characterize each stage of the mineralization (Karimpour et al., 2005). The ore grade ranges between 2 to 9 wt. % Cu, 100 to 650 ppm Ag and 0.5 to 35 ppm Au.
Propylitic alteration assemblages are very widespread in the Qaleh-Zari area. Epidote and chlorite are the two characteristic minerals of this assemblage. Epidote is very abundant and formed by alteration of plagioclase, pyroxene and hornblende. Epidote is also abundant as veinlets filling the joints. Chlorite formed by alteration of mafic minerals or directly from the ore fluid within the vein (Fig. 2). Chlorites are generally Fe-rich types such as ripidolite with minor bronsvigite and pycnochlorite (Karimpour et al., 2005). Argillic alteration is locally present. Silicification is mainly found within a zone adjacent to the veins.
Chah Shaljami is high sulfidation Au prospecting area (lithocap of porphyry Cu-Au). It is located about 20 km south of Qaleh Zari (Fig. 1). Andesite to andesite basalt is the main rock exposed in this area. Monzonite to quartz monzonite dikes and small stocks intruded the volcanic rocks. Sub-volcanic rocks are part of a bigger stock at depth. Alteration is very broad and covers an area 2x3 km.
Hired is reduced intrusion related Au prospecting area. It is located about 75 km north east of Qaleh Zari mine (Fig. 1). The oldest rocks exposed in the study area are Jurassic shale and sandstone (Fig. 4). Cretaceous rocks are conglomerate, sandstone, limestone and tuff.
 | |
| Fig. 4: | Geological map of Hired Gold prospecting area (Karimpour et al., 2008) |
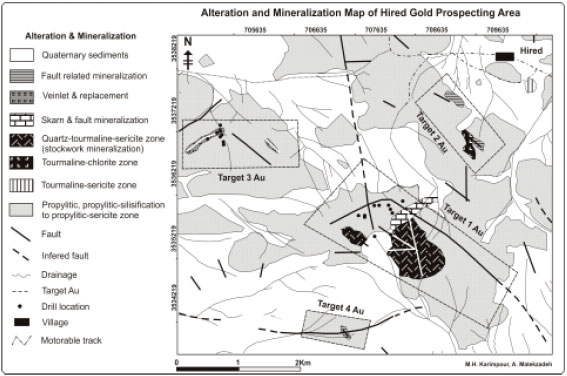 | |
| Fig. 5: | Alteration and mineralization map of Hired Gold prospecting area (Karimpour et al., 2008) |
Magmatic activities during Paleocene-Eocene were mainly andesite in composition (Fig. 4). Two series of granitoids (magnetite and ilmenite-series) were identified in the study area (Fig. 4) (Karimpour et al., 2008). Magnetite suites are exposed in northeast of the study area (Fig. 4). The magnetite suites consist of at least four types of intrusive: gabbro, biotite-hornblende diorite, biotite-hornblende monzodiorite and biotite-hornblende quartz monzonite. The ilmenite suites are exposed in central and some in western portion of the map. Several intrusive rocks belong to the ilmenite series are identified. Four of them are shown on the map. These are granite, biotite granite, biotite-hornblende quartz monzonite and hornblende diorite (Fig. 4).
Four style of mineralization such as stockwork, skarn, vein and replacement were identified (Karimpour et al., 2008). Stockwork mineralization is present within and near the ilmenite series granite porphyry (Fig. 5). It has exposure in the central part of the map Target No-I (Fig. 4). Stockwork consists of different veinlets such tourmaline, quartz, quartz-sulfides, quartz-calcite and quartz-chlorite. The width of veinlets varies between 1-20 mm. Mineral paragenesis of the stockwork is plotted in Fig. 6. Quartz, tourmaline, arsenopyrite, pyrrhotite, galena, sphalerite ± chalcopyrite are the main mineral.
Four types of alteration are identified: propylitic, tourmaline-sericite, chlorite-tourmaline, tourmaline- sericite-quartz. Propylitic dominate and cover large area.
 | |
| Fig. 6: | Mineral paragnesis of Hired Gold prospecting area (Karimpour et al., 2008) |
It consists of chlorite and minor calcite. Tourmaline-sericite-quartz alteration is found with stockwork mineralization (Fig. 5).
ASTER mineral mapping and aeromagnetic: The type of minerals formed due to alteration is mainly control by chemical composition of the hydrothermal fluid. The size and geometry of alteration halos directly related to the volume of hydrothermal fluid. Porphyry Cu are big deposits, therefore their alteration halos are more than several km2.
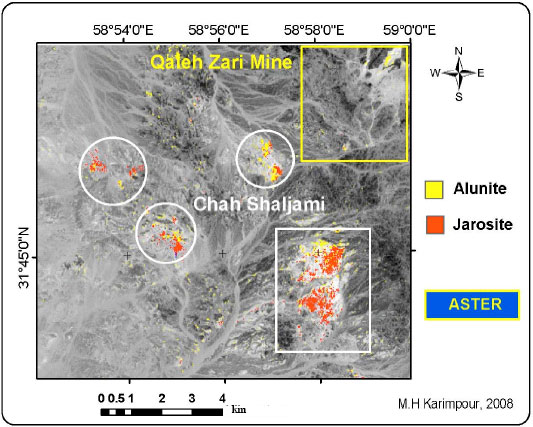 | |
| Fig. 7: | ASTER Mineral mapping show alunite and jarosite |
In order to be able to produce a good ASTER mineral mapping and to be able to identify the type of a deposit before going to the field it is important to know: 1-Petrochemistry and petrogenesis of igneous rocks is the fundamental key for understanding how and where igneous related ore deposits were formed. For instance, porphyry Cu, Sn, Mo and W is associated with intrusive rocks with special petrogenesis and tectonic setting. Porphyry Cu deposits are related to intermediate, calc-alkaline sub-volcanic formed in subduction setting. 2-Geochemistry of hydrothermal ore deposits with respect to alteration and the role of complexes in carrying the metals and how and where they precipitate; 3-Alteration patterns formed in each deposits and 4-knowledge and experiences with remote sensing and mineral mapping.
More than 50 areas having potential for mineral exploration were identified. Amount them three areas chosen for this article. We combined ASTER mineral mapping result with the aeromagnetic data. It turned out that it is possible to identify and discriminate between different deposits. In this article, three types of gold deposits were compared: 1-High-sulfidation (lithocap of porphyry Cu-Au); 2-Iron oxides Cu-Au (IOCG) and 3-Reduced intrusion related Au deposit.
Chah Shaljami and Qaleh Zari: ASTAR mineral mapping for Qaleh Zari and Chah Shaljami areas are shown in Fig. 7-11. Only chlorite, zoisite and epidote are common in both areas (Fig. 10-11). At Qaleh Zari, epidote is very abundant (Fig. 11). At Chah Shaljami two types of chlorites are mapped (Fig. 11). Alunite, silica, dickite, montmorillonite, gypsum, hematite, jarosite are mapped only at Chah Shaljami area (Fig. 7-10). Chlorite and epidote at Qaleh Zari show a linear trend NW-SE (Fig. 11). This indicates that the mineralization is vein type, which has been documented based on the filed work. Mineral mapping shows that alteration within Chah Shaljami area was very intensive and covers a large area. Alteration shows good zoning at Chah Shaljami. A chlorite-epidote propylitic zone surrounds other minerals. One area at Chah Shaljami is about 3x4 km2 (Fig. 7). Based on these data, the chemistry of the hydrothermal fluid was totally difference between Qaleh Zari deposit and Chah Shaljami Au-Cu prospecting area. At Chah Shaljami, the following minerals are the signs of high sulfidation: Alunite, silica, jarosite, dickite, montmorillonite and gypsum. The geometry of the alteration and strong alteration is important sign that this high sulfidation is lithocap of a porphyry Cu mineralized system.
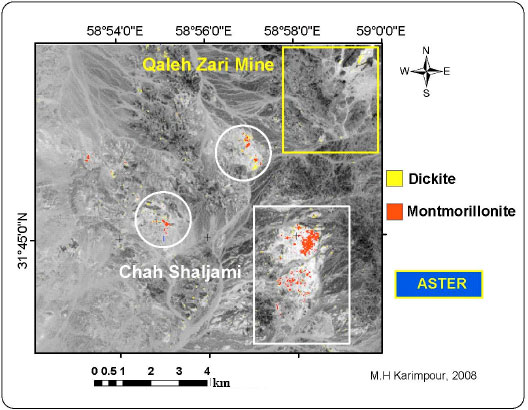 | |
| Fig. 8: | ASTER Mineral mapping show dickite and montmorillonite |
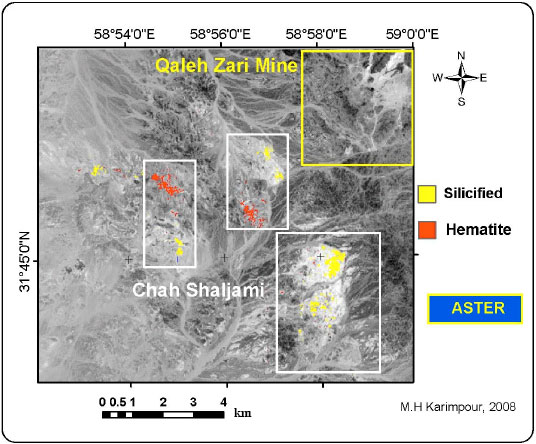 | |
| Fig. 9: | ASTER Mineral mapping show silicified areas and secondary hematite |
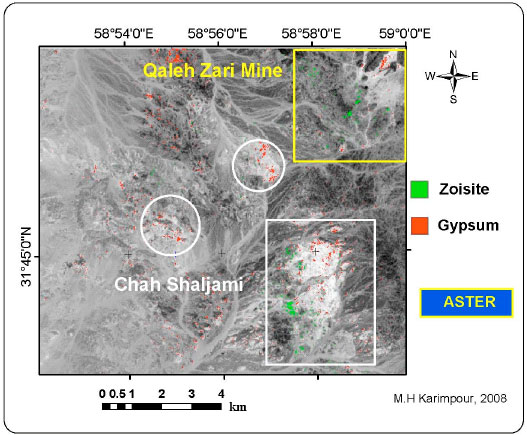 | |
| Fig. 10: | ASTER Mineral mapping show zoisite and gypsum |
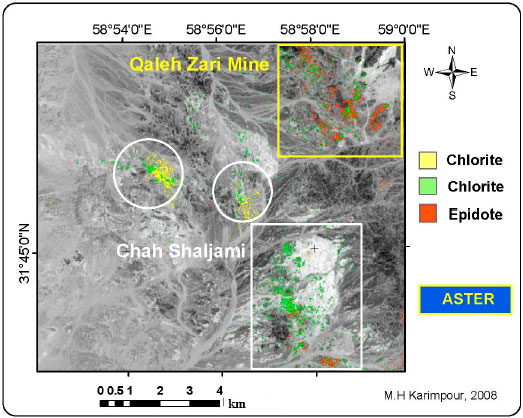 | |
| Fig. 11: | ASTER Mineral mapping show Epidote and two types of chlorites |
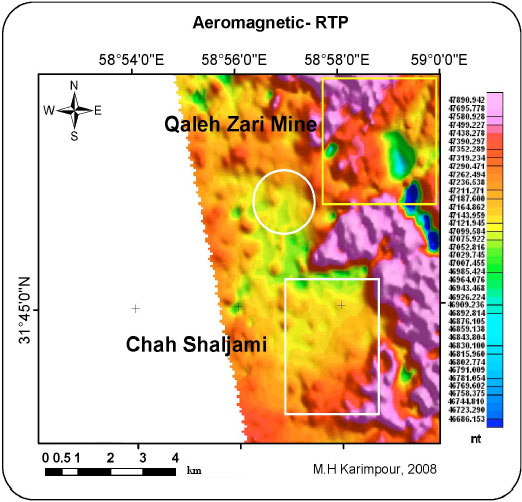 | |
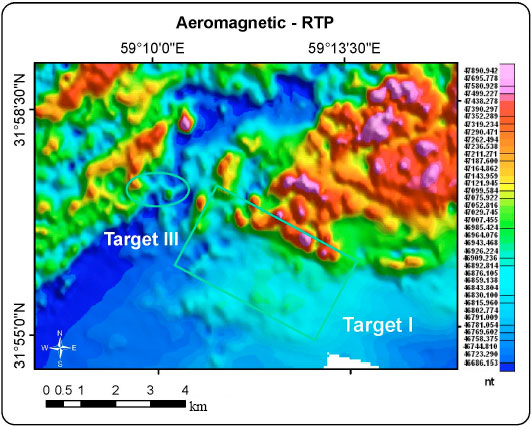
| Fig. 12: | Aeromagnetic, RTP map |
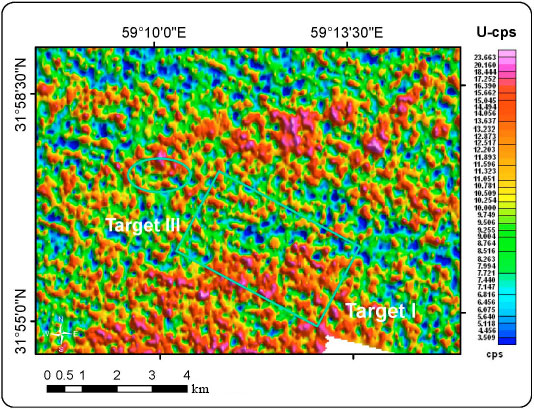
Aeromagnetic data show very low magnetism at Chah Shaljami (Fig. 12). This is a porphyry Cu system and the source rocks were magnetite series granitoids. Due to strong alteration magnetite was destroyed. High magnetism is present within the epidote-chlorite propylitic zone. At Chah Shaljami, low magnetism covers large area (Fig. 12). This corresponds well with ASTER mineral mapping. U (cps) is very high at Chah Shaljami (Fig. 13).
Hired; Doing ASTER mineral mapping, tourmaline, chlorite, silica, calcite and minor sericite are mapped at Hired (Fig. 14, 15). Alteration is local and their mineral assemblages are different from Qaleh Zari and Chah Shaljami. In comparison with Qaleh Zari it has tourmaline, silicification and minor sericite. At Qaleh Zari, epidote is very important. Chlorite at Qaleh Zari is Fe-rich and at Hired they are Mg-rich type. It has major differences with Chah Shaljami such as absence of alunite, jarosite, dickite, montmorillonite, gypsum. The size and shape of altered mineral assemblages is smaller and the intensity is less than Chah Shaljami.
Aeromagnetic data shows very low magnetism at Hired (Fig. 16). This low magnetism is related to reduce intrusive rocks and not to alteration (Fig. 4). Low magnetism covers large area but alteration is local (Fig. 16). High magnetism is associated with oxidant intrusive magnetite-series rocks (Fig. 16). The hydrothermal fluid was associated with the reduced intrusive rocks. U (cps) is high within area having low magnetism (Fig. 16-17). High U is associated with reduced intrusive rocks (Fig. 13).
Based on mineral paragnesis and alteration (pH, Log f O2 - Log f S2, chemical composition of hydrothermal ore bearing solution can be derived). Based on mineral paragnesis and type of alteration Qaleh Zari, Chah Shaljami and Hired are plotted in Fig. 18. Qaleh Zari Iron oxide Cu-Au deposit (IOCG) is highly oxidant, low sulfur; pH>7 and the intrusive source was also highly oxidant (based on hematite, chlorite and epidote) (Table 2). Hired gold prospecting (Fig. 18) is highly reduced, medium sulfur, pH 4-7 and the intrusive source was reduced ilmenite series granitoids and associated elements are Au, Sn, As, Sb, Pb, Zn (based on pyrrhotite, arsenopyrite, tourmaline, sericite and ilmenite series granitoids) (Table 2).
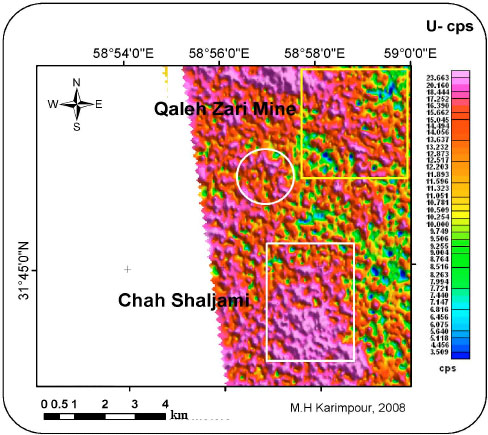 | |
| Fig. 13: | Uranium cps map (Arial data) |
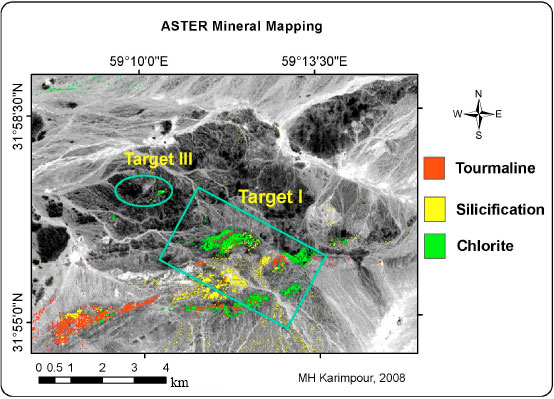 | |
| Fig. 14: | ASTER Mineral mapping show different minerals |
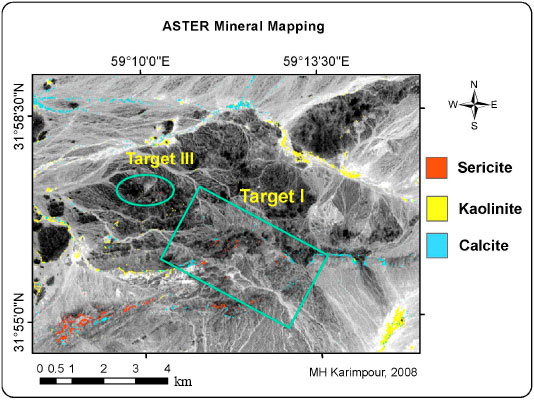 | |
| Fig. 15: | ASTER Mineral mapping show different minerals |
 | |
| Fig. 16: | Aeromagnetic, RTP map from Hired |
 | |
| Fig. 17: | Uranium cps map (Arial data) from Hired |
 | |
| Fig. 18: | Log f O2 versus Log f S2 and location of the three types of gold system |
| Table 2: | Special characteristics of the gold deposits |
 | |
Chah Shaljami is high sulfidation Au (Fig. 18), highly oxidant, high sulfur, pH< 2 and the intrusive source was oxidant (based on alunite, dickite, Gypsum and Jarosite) (Table 2).
CONCLUSION
ASTER mineral mapping is very useful, cheap and fast method of searching and finding important area for mineral exploration especially in Eastern Iran where arid conditions have produced good rock exposure. Several areas having great potential for mineral exploration were identified (Province of South Khorasan, Eastern Iran). Besides this, It is also possible to discriminate between different types of deposits. Specularite-rich Iron oxides Cu-Au deposits show only epidote and Fe-rich chlorite, but no secondary hematite. High sulfidation Au deposits show alunite, jarosite, dickite, chlorite, epidote. Reduced intrusive related Au show tourmaline, carbonate, silica, Mg-rich chlorite and minor sericite.
ACKNOWLEDGMENT
This article is the result of research grant (p/741-date 22-July-2008) from Ferdowsi University of Mashhad, Iran.
REFERENCES
- Asaki, T., S. Sueoka, H. Fukasawa, Y. Ito, M. Furuno and H. Cho, 2004. Copper explorations based on a satellite-image analysis technique in northern Chile: The recent results of exploration activity. Shigen Chishitsu, 54: 27-36.
Direct Link - Crosta, A.P., C.R. De Souza Filho, F. Azevedo and C. Brodie, 2003. Targeting key alteration minerals in epithermal deposits in Patagonia, Argentina, using ASTER imagery and principal component analysis. Int. J. Remote Sens., 24: 4233-4240.
CrossRef - Ducart, D.F., A.P. Crosta, C.R. Souza and J. Coniclio, 2006. Alteration mineralogy at the Cerro La Mina epithermal prospect, Patagonia, Argentina: Field mapping, short-wave infrared spectroscopy and ASTER images. Econ. Geol., 101: 981-996.
CrossRef - Groves, D., R.J. Goldfarb, F. Robert and C.J.R. Hart, 2003. Gold deposits in metamorphic belts: Overview of current understanding, outstanding problems, future research and exploration significance. Econ. Geol., 98: 1-29.
CrossRef - Haynes, D.W., 2000. Iron Oxide Copper Gold Deposits: Their Position in the Ore Deposit Spectrum and Modes of Origin. In: Hydrothermal Iron Oxide Copper-Gold and Related Deposits: A Global Perspective, Porter, T.M. (Ed.). Australian Mineral Foundation, Adelaide, pp: 71-90.
Direct Link - Hedenquist, J.W., A. Arribas and E. Gonzalez-Urien, 2000. Exploration for epithermal gold deposits. Rev. Econ. Geol., 13: 245-278.
Direct Link - Hitzman, M.W., 2000. Iron Oxide-Cu-Au Deposits: What, Where, When, and Why. In: Hydrothermal Iron Oxide Copper-Gold And Related Deposits: A Global Perspective, Porter, T.M. (Ed.). Australian Mineral Foundation, Adelaide, pp: 9-25.
Direct Link - Hollister, VF., 1992. On a proposed plutonic porphyry gold deposit model. Nonrenewable Resour., 1: 293-302.
Direct Link - Hook, S.J. and C.R. Howard, 2001. Mapping lithological variations with visible to thermal infrared spectroscopy: A case study from Gold Butte, NV. Geol. Soc. Am. Abstr. Programs, 33: 291-291.
Direct Link - Hubbard, B.E. and J.K. Crowley, 2001. Alteration mineral mapping in the central andes using hyperion, ALI and ASTER. Geol. Soc. Am. 2001 Annu. Meet. Abstr. Programs, 33: 319-319.
Direct Link - Karimpour, M.H., K. Zaw and D. Huston, 2005. S-C-O isotopes, fluid inclusion thermometry and genesis of ore-bearing fluids at Qaleh-Zari Cu-Au-Ag mine, Iran. J. Sci. Islamic Repub. Iran, 16: 153-169.
Direct Link - Karimpour, M.H., C.R. Stern, A. Malekzadeh Shafaroudi and M.R. Hidarian, 2008. Petrochemistry of the Reduced, Ilmenite-series granitoid intrusion related to the hired au-sn prospect, Eastern Iran. J. Applied Sci.
Direct Link - Lang, J.R. and T. Baker, 2001. Intrusion-related gold systems: The present level of understanding. Mineralum Deposita, 36: 477-489.
CrossRef - Mars, J.C. and L.C. Rowan, 2006. Regional mapping of phyllic-and argillic-altered rocks in the Zagros magmatic arc, Iran, using Advanced Spaceborne Thermal Emission and Reflection Radiometer (ASTER) data and logical operator algorithms. Geosphere, 2: 161-186.
CrossRef - Rowan, L.C., S.G. Hook, A.J. Abrams and J.C. Mars, 2003. Mapping hydrothermally altered rocks at Cuprite, Nevada, using the advanced spaceborne thermal emission and reflection radimeter (ASTER), a new satellite-imaging system. Econ. Geol., 98: 1019-1027.
CrossRef - Rowan, L.C. and J.C. Mars, 2003. Lithologic mapping in the mountain pass, california area using advanced spaceborne thermal emission and reflection radiometer (aster) data. Remote Sens. Environ., 84: 350-366.
Direct Link - Sillitoe, R.H., 1993. Epithermal models: Genetic types, geometrical controls and shallow features: In mineral deposit modeling. Kirkham, R.V., W.D. Sinclair, R.I. Thorpe and J.M. Duke (Eds.). Geological Association of Canada Special Paper, No. 40, pp: 403-417. www.geomineinfo.com/Complimentary Downloads/Types of Ore Deposits.pdf.
- Sillitoe, R.H., 1997. Characteristics and controls of the largest porphyry copper�`gold and epithermal gold deposits in the circum- Pacific region. Aust. J. Earth Sci., 44: 373-388.
CrossRefDirect Link - Sillitoe, R.H. and J.F.H. Thompson, 1998. Intrusion-related vein gold deposits: Types, tectono-magmatic settings and difficulties of distinction from orogenic gold deposits. Resour. Geol., 48: 237-250.
Direct Link - Sillitoe, R.H., 2002. Some metallogenic features of gold and copper deposits related to alkaline rocks and consequences for exploration. Mineralium Deposita, 37: 4-13.
CrossRefDirect Link - Sillitoe, R.H., 2003. Iron oxide-copper-gold deposits: An andean view. Mineralium Deposita, 38: 787-812.
CrossRef - Stephens, J.R., J.L. Mair, N.H.S. Oliver, C.J. R. Hart and T. Baker, 2004. Structural and mechanical controls on intrusion-related deposits of the Tombstone Gold Belt, Yukon, Canada, with comparisons to other vein-hosted ore-deposit types. J. Struct. Geol., 26: 1025-1041.
CrossRef - Williams, P.J., M.D. Barton, D.A. Johnson, L. Fontbote and A. De Haller et al., 2005. Iron Oxide Copper-Gold Deposits: Geology, Space-Time Distribution and Possible Modes of Origin. In: Economic Geology 100th Anniversary, Hedenquist, J.W., J.F.H. Thompdon, R.J. Goldfarb and J.P. Richards (Eds.). SEG, Denver, pp: 371-405.
Direct Link - Yoshizawa, H., S. Machida, H. Fukusawa, S. Sueoka, T. Asaki and S. Yamasawa, 2003. Extraction of promising mineral area and acquisition of mining property using satellite image analysis technique in northern Chile. Shigen Chishitsu, 53: 39-50.
Direct Link