
I. Mutlu
Faculty of Technical Education, ANS Campus, Afyon Kocatepe University, Afyonkarahisar, Turkey
Journal of Applied Sciences
Year: 2009 | Volume: 9 | Issue: 2 | Page No.: 382-386


ABSTRACT
In this study, the use of cedar (cidrus) pine cone (CPC) dust along with boric acid (BA) has been investigated for assessing the effect on friction coefficient. CPC has resin in it. BA is a boron production which is widely used in boron glass production and in ceramic industry for increasing the heat resistant and forming abrasion resistant. Newly formulated brake lining material with five different ingredients has been tested under Friction Assessment and Screening Test (FAST). Friction coefficient, wear rate and scanning electron microscope (SEM) for friction surfaces were examined to assess the performance of these samples.
PDF Abstract XML References Citation
How to cite this article
I. Mutlu, 2009. Investigation of Using Cedar Pine Cone Dust and Boric Acid in Brake Pads. Journal of Applied Sciences, 9: 382-386.
DOI: 10.3923/jas.2009.382.386
URL: https://scialert.net/abstract/?doi=jas.2009.382.386
DOI: 10.3923/jas.2009.382.386
URL: https://scialert.net/abstract/?doi=jas.2009.382.386
INTRODUCTION
Frictions materials which are used in brakes in the automotive sector were formulated around a century ago. In the early 1920s, asbestos fiber was chosen as a friction material for use in all kinds of vehicles. Nowadays, non-asbestos organic (NAO) materials have become main stream to overcome the negative effect of asbestos on human health. A characteristic friction material is a multi-component polymer matrix composite whose formulation is generally developed by experimental studies (Filip et al., 2002).
In the last two decades, rapid developments in the automotive industry have been accompanied by increases of speed, loads and engine power. The friction materials are required to provide a stable friction coefficient and a low wear rate at various operating speeds, pressures, temperatures and environmental conditions. Friction material must also be compatible with the rotor material in order to reduce its extensive wear, vibration and noise during braking. All of these requirements need to be achieved at a reasonable cost and minimum environmental load (Hee and Filip, 2005).
Brake pads that are currently used in industry can contain more than 10 different ingredients. They are often categorized into four classes of ingredients: binders, fillers, friction modifiers and reinforcements (Bijwe, 1997). These ingredients also contain a large number of different constituents like ceramic particles and fibers, minerals, metallic chips, solid lubricants and elastomers in a matrix material such as phenolic resin. A description of more than 100 formulations of patented friction materials can be found in (Mutlu et al., 2005).
Up to now, the development of new friction materials has been done empirically, starting from well-known base compositions which have been successively optimized by adding friction modifiers (Osterle et al., 2001). Earlier studies carried out by earlier researchers have found that there are four failure modes operative during braking: (1) chemical changes, (2) thermal instability, (3) wear mechanism and (4) micro cracks. These phenomena result in the changes of physical properties and microstructure of friction materials with increased braking times and applied loads. The micro structural changes phenomena can be clarified by studying the surface morphology of the wear surface and subsurface (Talib et al., 2003).
In many countries, secondary wood products are diverse and used in different area of the industry. CPC are obtained from wealth cedar pine trees. In this study, CPC is used to obtain friction material for the brake lining since it includes high proportion resin. In many places on the world, including Mediterranean cedar pine trees exist in abundance and its cone has resin in it.
BA is a boron production which is widely used in industry. Due to its capability to increase heat resistant and form abrasion resistant, it is used in boron glass production and in ceramic industry. In addition, BA increases hardness where it is applied. Due to these reasons, it is included in brake lining formulation.
Effect of using friction materials obtained from CPC dust and BA on friction coefficient and abrasion resistant has been investigated through the obtained figures. Different amounts of CPC dust and BA were mixed with other regular ingredients in the brake pad. In the experimental studies, the change of friction coefficient and the amount of wear were measured. In addition, micro-structural characterizations of braking pads were looked at by using a scanning electron microscopy. The results revealed that CPC and BA can in fact be used for friction materials in the brake lining pad.
MATERIALS AND METHODS
In this study, a new automotive brake friction material was developed by using various additive materials along with CPC dust and BA and their performance on brake friction characteristics was specifically examined. To the best of the knowledge, this study is the first to use CPC dust and BA together in brake pads. Friction materials investigated in this study were non-asbestos organic (NAO) type materials containing five different ingredients including CPC and BA. This study was carried out for five different mixtures of brake pads. The ingredients in the friction material comprise binder resin, friction modifiers and space filler. Friction material specimens were produced by a conventional procedure for a dry formulation following dry-mixing, pre-forming and hot pressing. Detailed conditions for each manufacturing step can be found in the author’s other study (Mutlu et al., 2007a). The composition of the friction materials studied in this work is shown in Table 1.
An analytical balance was used to weigh each of the ingredients which were mixed for 10 min using a commercial blender. The final mixture was loaded into a cylindrical (small samples) or a brake lining (brake lining samples) mold. The mixtures in both mold types were hot pressed at 180°C for 15 min and subsequently post cured. During the hot pressing process, pressure was released several times to release the gases that evolved from the cross linking reaction (polycondensation) of the phenolic resin. Post-curing was carried out at a constant temperature of 180°C by placing the samples in a preheated furnace (Fisher scientific Isotem Furnace) for 4 h (Kristkova et al., 2004).
Using the Friction Assessment and Screening Test (FAST) machine, friction tests were performed for each material. For each sample, three friction test procedures were applied and the average of these three tests was recorded. For comparison purposes, FAST testing was also repeated with samples obtained. The FAST machine uses a pearlitic gray cast iron disc (diameter of 180 mm, thickness 38 mm) and a brake lining test sample with dimensions of 12.7x12.7x5.00 mm. The test sample was mounted on the load arm and pressed against the flat surface of the rotating disc. The rotating cast iron disc moved with a constant sliding speed of v = 7 m sec-1 for 90 min and the temperature was increased from room temperature to around 300°C. Before performing the FAST testing, the surfaces of the test samples and the cast iron discs were ground with 320-grid sandpaper. The normal load was varied to achieve a constant friction force. The friction coefficient was calculated by measuring normal and tangential pressures every 5 seconds throughout the 90 min test. The weight and thickness of two pads and a disc for each sample were taken before and after the friction test. In order to obtain average thickness, six measurements (three at the beginning and three at the end) were taken at different locations on the pads and disc before and after the friction test. Wear rate was calculated as weight loss for per mm2 of the sample during the tests.
RESULTS AND DISCUSSION
The coefficient of friction (μ) varied significantly in the initial stage of testing, since the size of the contact area increased and the friction layer was developed on the surface (Filip et al., 2002). The variations of friction coefficient with test time are given in Fig. 1-5. The characteristic time dependences of the coefficient of friction as detected in FAST for all samples are shown in Fig. 1-5. As shown from the Fig. 1-5 the friction coefficient shows a very corrugated feature.
In addition, samples showed a continuous increase in the friction coefficient (μ) between 10 and 20 min of testing in FAST. Such increase can often be attributed to the adhesion of metal chips in the brake lining to the friction surface of the cast iron disc. The observed amount of change in friction coefficient is usually a sign of unstable and aggressive friction. Some middle vibrations and noise were observed after approximately between 10 and 70 min of testing. As can be seen from Fig. 5, samples K20 coded exhibited a sudden decrease of μ after approximately 40 min of testing. This sudden change was typically observed at the beginning of the test before a stable friction layer was developed. Figure 4 reveals that samples K16 coded exhibited a sudden decrease of μ after approximately 70 min of testing. This was the case with K12 coded samples after approximately 80 min of testing as shown in Fig. 3. Samples K4 and K8 demonstrated a relatively stable μ throughout the entire test along with some middle vibrations. This indicates that a stable friction layer was developed after a short run-in with K4 and K8 samples. Neither judder nor rapid changes of the friction coefficient occurred in samples K4 and K8.
| Table 1: | The ingredients of samples (wt%) |
 | |
 | |
| Fig. 1: | The change of friction coefficient as a function of time for samples K4 |
 | |
| Fig. 2: | The change of friction coefficient as a function of time for samples K8 |
 | |
| Fig. 3: | The change of friction coefficient as a function of time for samples K12 |
 | |
| Fig. 4: | The change of friction coefficient as a function of time for samples K16 |
 | |
| Fig. 5: | The change of friction coefficient as a function of time for samples K20 |
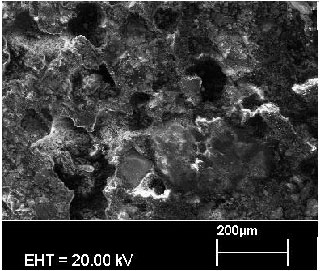 | |
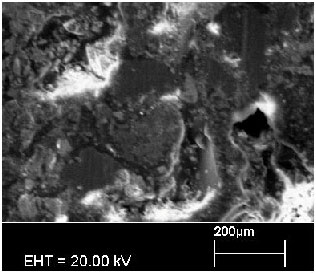
| Fig. 6: | SEM micrographs of brake pad sample for K4 |
 | |
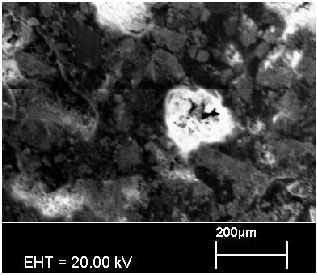
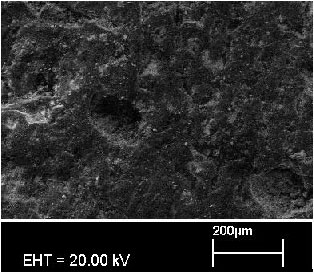
| Fig. 7: | SEM micrographs of brake pad sample for K8 |
 | |
| Fig. 8: | SEM micrographs of brake pad sample for K12 |
 | |
| Fig. 9: | SEM micrographs of brake pad sample for K16 |
 | |
| Fig. 10: | SEM micrographs of brake pad sample for K20 |
| Table 2: | Typical characteristics of the brake pad used in this study |
 | |
It is important to note that the samples which have a higher BA rate better adapted to CPC dust since having more BA can provide better toughness on the pad as can be observed in Fig. 1 and 2. In the same lines, when the BA rates drop, friction coefficient starts to decrease as well. In general, friction coefficient decreases in high temperature such as 300-400°C due to softening of phenolic resin. As a result, fading occurs during the brake action. Furthermore, with the increasing temperatures, the ingredients in the braking pad are affected from each other due to faster diffusion.
SEM photographs of the samples are given in Fig. 6-10. As can be seen from these pictures, there are pores in the body of K4 and K8 samples. These samples have more BA ingredient than other samples. When the BA rate is lowered (e.g., K12, K16 and K20 samples), the number of pores decreases significantly. Moreover, for K4 and K8 samples, a lot of yellow bubbles were observed during the 4 h of heat treatment under 180°C.
As seen from the micrographs, some particles were detached from the body causing micro-voids. The micro-voids on the surface of the samples can be classified as small and big. The big sized micro-voids are due to falling of the metallic particles during the friction. The worn metallic particles imply that they actively participated in friction during braking test. It is known that if the metal-component coherent surface is bigger, friction and wear will be increased. In addition to micro-voids, there are some micro cracks on the surface. Therefore, they stayed as effective in friction surface. All matters were homogeneously distributed in the matrix and thus, very few micro voids were observed in the structure.
Table 2 presents the mean of friction coefficient, standard deviation of friction coefficient and wear per mm2 of the sample during the tests. As can be shown from the Table 2 the μ achieved in samples K4 and K8 are 0.354 and 0.322 respectively which are considered to be very good when compared to friction coefficients achieved in current brake pads (Mutlu et al., 2007b). While the mean of friction coefficients are higher, standard deviation is lower in the samples where the BA rate is higher. In addition, the standard deviation is higher in the samples where the mean of friction coefficients is lower. Finally, less wear was observed with the samples where the BA rate is higher. Note that if an increased toughness is desirable with more BA use, then having lots of pores in the brake pads is inevitable.
CONCLUSIONS
In this study, the following conclusions were drawn:
| • | CPC dust and BA by-product can be effectively used in brake lining formulations when properly combined with other additives |
| • | The experimental results have shown that the friction layer, with the use of BA significantly improved the overall performance. Simultaneous faded reduction and stabilized friction coefficient. Wear improvements were achieved by adding BA and CPC dust to the friction layer formulation |
| • | K16 and K20 samples which have less BA exhibited lower and more quickly decrease and low vibrations and fluctuate for stable friction coefficients. The addition of BA to brake lining formulation stabilized the coefficients of friction |
| • | Sample K4 and K8 were able to exhibit a stable performance observed. In addition, low wear of cast iron disc and disc thickness variation was observed for samples K4 and K8 when compared to others |
| • | Increased additions of CPC dust may lead to excessive wear of brake linings (samples K16 - K20) and formulations have to be optimized (samples K4 - K8) for good performance. With higher rates of CPC dust, there is more decomposition on the friction surface which can be correlated to the thermal fade of sample K20 |
| • | The frictional performance strongly depends on the friction layer generated on the friction surface, chemistry and structure of the friction layer differs from the bulk material formulation and also depends on the environment and applied testing condition |
ACKNOWLEDGMENTS
This research is funded by the Scientific and Technological Research Council of TŰRKEY (TUBITAK) (Grant Reference No: BIDEP 2219) and conducted in Center for Advanced Friction Studies (CAFS) at Southern Illinois University Carbondale (SIUC), IL, USA when the author was a visiting scholar at SIUC from June 2008 to October 2008. The author wishes to acknowledge the TŰBITAK and SIUC CAFS for their support.
REFERENCES
- Bijwe, J., 1997. Composites as friction materials: Recent developments in non-asbestos fiber reinforced friction materials. A review. Polymer Composites, 18: 378-396.
Direct Link - Filip, P., Z. Weiss and D. Rafaja, 2002. On friction layer formation in polymer matrix composite materials for brake applications. Wear, 252: 189-198.
Direct Link - Hee, K.W. and P. Filip, 2005. Performance of ceramic enhanced phenolic matrix brake lining materials for automotive brake linings. Wear, 259: 1088-1096.
Direct Link - Kristkova, M., P. Filip Z. Weiss and R. Peter, 2004. Influence of metals on the phenol–formaldehyde resin degradation in friction composites. Polymer Degradation Stability, 84: 49-60.
Direct Link - Mutlu, I., O. Eldogan and F. Findik, 2005. Production of ceramic additive automotive brake lining and investigation of its braking characterization. Industrial Lubrication Tribol., 57: 84-92.
Direct Link - Mutlu, I., C. Oner and F. Findik, 2007. Boric acid effect in phenolic composites on tribological properties in brake linings. Mater. Design, 28: 480-487.
Direct Link - Mutlu, I., C. Oner, I. Cevik and F. Findik, 2007. Wear performance of some phenolic composites with boric acid. Industrial Lubrication Tribol., 59: 38-45.
Direct Link - Osterle, W., M. Griepentrog, T.H. Gross and I. Urban, 2001. Chemical and microstructural changes induced by friction and wear of brakes. Wear, 251: 1469-1476.
Direct Link - Talib, R.J., A. Muchtar and C.H. Azhari, 2003. Microstructural characteristics on the surface and subsurface of semi metallic automotive friction materials during braking process. J. Mater. Process. Technol., 140: 694-699.
Direct Link