
I. Maroufpoor
Department of Water, Agriculture Collage, Kurdistan University, Iran
S. Emamgholizadeh
Department of Water and Soil, Agriculture Collage, Shahrood University of Technology, Shahrood, Iran
H. Torabi
Department of Water, Agriculture Collage, Lorestan University, Iran
M. Behzadinasab
Regional Water Company of Kurdistan, Kurdistan, Iran
Journal of Applied Sciences
Year: 2009 | Volume: 9 | Issue: 16 | Page No.: 2933-2940


ABSTRACT
For investigation of the effect of soil texture on the calibration of Time Domain Reflectometry (TDR), water content was determined gravimetrically for five textures. The experiments were carried out at the laboratory of Agriculture Collage of University of Kurdistan. For carry out of the experiments five textures and for each of them three repetitions were used. The studied textures were loamy sand, sandy loam, sandy clay-loam, clay loam and clay. The provided textures infuse inside the PVC cylinder with 30 cm height and 25 cm diameter. The vases were inside the water bath nearly 24 h. After 24 h of saturation, the soil water content of the samples was measured by oven-dry gravimetric and TDR methods. For each textures at any stage of measurement the determination of moisture and di-electric constant were carried out at three capture windows and with three repetitions. In each day the moisture measurement of each texture was carried out by these two methods until a moisture range was determined. The results of this research show that: (1) For all soil textures (loamy sand, sandy loam, sandy clay-loam, clay loam, clay) the measured moisture at the capture windows of 20 ns was more accuracy rather than other capture windows. (2) For all soil textures the TDR device can not measure the soil water content at capture window of 40 ns. (3) For loamy-sand and sandy-loam textures when the moisture was less than 20% and also for other textures for total range of measurement, the TDR device measured the moisture values less than the gravimetric method. This difference is increased when the soil ranged from light to heavy textures. (4) the comparison of the studied textures indicated that with increasing of clay content, the fitted lines slope is decreasing, but the RMSE values have increasing rate which it indicated the effect of clay content on the accuracy of TDR device. (5) From the statistical view at probably level of 1% there is not difference between the measured value of moisture by TDR device and gravimetric method. (6) For the all textures the fitted regression lines have high regression coefficient.
PDF Abstract XML References Citation
How to cite this article
I. Maroufpoor, S. Emamgholizadeh, H. Torabi and M. Behzadinasab, 2009. Impact of Soil Texture on the Calibration of TDR for Water Content Measurement. Journal of Applied Sciences, 9: 2933-2940.
DOI: 10.3923/jas.2009.2933.2940
URL: https://scialert.net/abstract/?doi=jas.2009.2933.2940
DOI: 10.3923/jas.2009.2933.2940
URL: https://scialert.net/abstract/?doi=jas.2009.2933.2940
INTRODUCTION
Soil-water content measurement is critical for irrigation research and management (Camilo de Andrade et al., 2003). The recognition of the soil water content and its measurement in the farm is the parts of the water consumption management which it is prevent the economic and environmental losses that arise from low or high water consumption. Different measurement methods are used for determining the soil water content. These methods can determine the soil water content as water content or the soil water potential. Soil water content is the amount of water per volume of soil or weight of dry soil. Soil water potential is the force necessary to remove the next increment of water from the soil.
Soil water content is measured in two very distinctly different methods-quantitatively, which means by amount and qualitatively, which is an indication of how tightly the water is held by the soil particles (Prichard, 1999).
Quantitative methods:
| • | Gravimetric soil sampling |
| • | Neutron scatter |
| • | Di-electric constant |
The di-electric constant methods seek to measure the capacity of a nonconductor (soil) to transmit high frequency electro-magnetic waves or pulses when inserted into the soil. The resultant values are related through calibration to soil water content. The basis for use of these instruments is that dry soil has di-electric values is near 2 to 5 and that of water is 80 when measured between 30 MHZ and 1 GHz. Two approaches have been developed for measuring the di-electric constant of the soil water media and estimating the soil volumetric water content (Prichard, 1999):
| • | Time Domain Reflectrometry (TDR) |
| • | Frequency Domain Reflectrometry (FDR) |
Time Domain Reflectometry (TDR) has become an established method for Soil Water Content (SWC) measurement (Bittelli et al., 2007). This technique is commonly used to obtain laboratory and field measurements of volumetric moisture content in soil (Bittelli et al., 2007). During the last 20 years, the using of this method widely increased (Pumpanen and Ilvesniemi, 2005).
This technique is used for measuring the apparent dielectric constant, Ka, of the soil (Topp et al., 1980) and this can be related to the soil water content. At the TDR frequencies, pure liquid water has a dielectric permittivity of about 80 (depending on temperature and electrolyte solution), air has a dielectric permittivity of about 1 and the solid phase of about 4 to 16 (Hallikainen et al., 1985; Or and Wraith, 1999).
The TDR device propagates a high-frequency transverse electromagnetic wave along a cable attached to parallel conducting probe inserted into the soil. The signal is reflected from one probe to the other, then back to the meter, which measures the time between sending the pulse and receiving the reflected wave. By knowing the cable length and waveguide length, the propagation velocity can be computed. The faster the propagation velocity, the lower the di-electric constant and thus lower soil water content (Prichard, 1999).
The TDR is easy to use and gives reliable and accurate results without disturbing the soil (Hoekstra and Delaney, 1974; Davis and Chudobiak, 1975; Davis and Annan, 1977; Topp et al., 1980; Ledieu et al., 1986).
The gravimetric method is a direct, absolute technique for estimating the total (both available and unavailable) water content of soil. The method involves drying a soil sample in an oven (105°C) to determine the amount of water in the soil (by subtracting the oven-dry weight from the initial field soil weight). The weight of the water is then divided by the oven-dry soil weight to obtain the water content by weight (g/g). If a specific volume of soil is used, the volumetric water content can be determined. This method is time consuming, labor-intensive and requires sampling equipment, weighing scale and an oven. A large number of samples must be taken to overcome the inherent spatial variability of soil and water content. Since this method is destructive, samples cannot be taken from exactly the same point on subsequent sampling dates. This method is commonly used to calibrate indirect methods such as neutron probe or di-electric constant methods (Prichard, 1999).
MATERIALS AND METHODS
This research project was carried out on the laboratory conditions by distributed soil samples with height and diameter of 250 and 300 mm, respectively at Kurdistan university from 2007 to 2008. The TDR device which used in this study was Trase System I (model 6050.X1). For carry out of the experiments in the laboratory conditions, it was necessary to mix clay texture and fine-textured sands until the expected texture was achieved. Therefore, with sand sieving, the fine sand (passing of the Sieve No. 80) was achieved. Also a clay texture with mixture of 49% clay and 30% silt which provided from the agriculture area around the Sanandaj City was used.
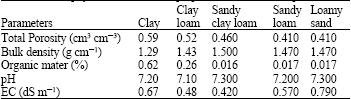
This clay soil was mixed with fine sand with three ratios of 8, 16 and 30%. In order to achievement of more homogeny of soil samples, the soil mixing was done with hand. Also in order to getting other textures, the loamy clay and clay textures were used. Table 1 and 2 show the provided soil textures and some physical and chemical properties of the soil samples.
The experiments were carried out at the laboratory of Agriculture Collage, University of Kurdistan. The provided soil textures infuse inside the PVC cylinder with 30 cm height and 25 cm diameter. In the bottom of each vase, fine textile lace was putted. In order to achievement compaction and air issue from inside the soil, after infuse soil inside the vase it regularly knocked with a piece of wood. Then the vases put into the water bath until the soil inside it saturated gradually through the pores of vase’s bottom. The vases were let inside the water bath and allowed it to saturate for 24 h.
| Table 1: | The soil textures of the samples |
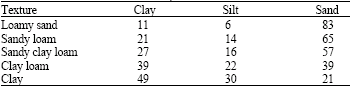 | |
| Table 2: | Some physical and chemical properties of the soil samples |
 | |
After it the moisture measurement of soil samples were carried out by gravimetric and TDR methods. It is tried to conducting probe as crisscross inserted in the soil. In this research the determination of moisture and dielectric constant were done by sepulchral probe at three capture windows and at three repetitions. Also, in each day, the exact weighting of each vases were measured simultaneously with moisture measurement with TDR device.
The soil water content measurement by these two methods was done until a range of moisture was determined for each of texture. At the end of each period, the dry weight of soil and their volume were measured.
RESULTS
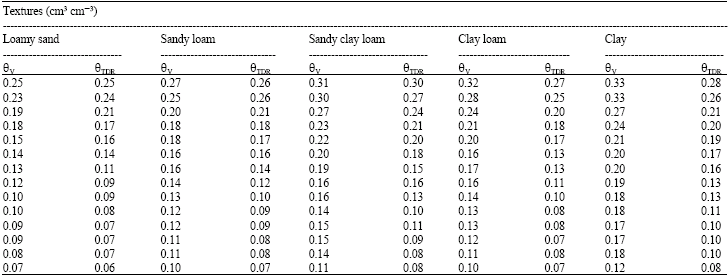
The comparison between the measured volumetric moisture at the capture windows of 10, 20 and 40 ns: As it is mentioned earlier the soil moisture was measured with volumetric and TDR methods. Table 3 shows some of the measured soil moisture with these two methods for five textures (Loamy Sand, Sandy Loam, Sandy Clay Loam, Clay Loam and Clay).
For investigation of the accuracy of the measured moisture at three capture windows (10, 20 and 40 ns), the statistical parameters such as the Root Mean Square Error (RMSE) and the Relative Error (RE) are used.
These parameters are defined as:
| (1) |
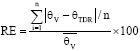 | (2) |
Where:
| di | = | The difference between the measured volumetric moisture and TDR method at each moisture |
| I and n | = | The number of moisture and total number of samples |
| θV and θTDR | = | The measured volumetric moisture and TDR’s moisture |
| = | The average measured volumetric moisture |
The results of this study for the all soil textures show that the measured moisture values at the capture window of 20 ns have more accuracy. The measurement capture window of 40 ns for the all textures was not usable; in other word the TDR device indicate message error at the moisture measurement period. Therefore, it was impossible to graph the moisture curve of the measured texture soil for the capture window of 40 ns. In Fig. 1 the values of the measured volumetric moisture by TDR device at two capture windows 10 and 20 ns are plotted versus the values of the measured volumetric moisture by gravimetric method. Therefore, in the next measurement of the moisture the capture window of 20 ns are used for all soil textures. The results of this investigation are shown in the Table 4.
The comparison between the measured volumetric moisture by gravimetric method (θv) and by TDR device with sepulchral probe: In order to comparison between the measured volumetric moisture by oven-dry gravimetric (θv) and TDR methods of different soil textures the average moisture values are used. By t-test at level probability of 1%, it was denoted that there is not meaningful difference between the moisture values of gravimetric and TDR methods. By statistical analysis, the regression coefficients were determined for each of the textural soil (Table 5).
| Table 3: | The measured soil moisture with volumetric and TDR methods |
 | |
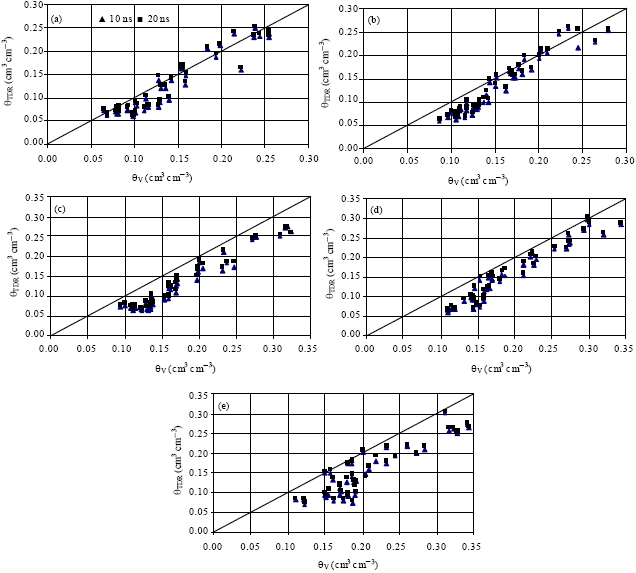 | |
| Fig. 1: | The comparison between measured volumetric moisture by TDR and gravimetric methods, (a) Loamy sand, (b) Sandy loam, (c) Sandy clay loam, (d) Clay loam and (e) Clay |
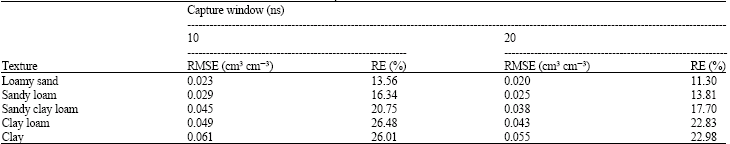
| Table 4: | The RMSE and RE of different texture soil for the measured capture windows |
 | |
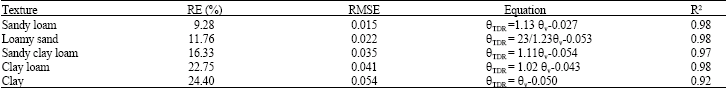
| Table 5: | Relative error (RE), RMSE, regression equations and correlation coefficients of soil moisture determinations |
 | |
The high regression coefficients illustrate high correlation of data by these two methods.
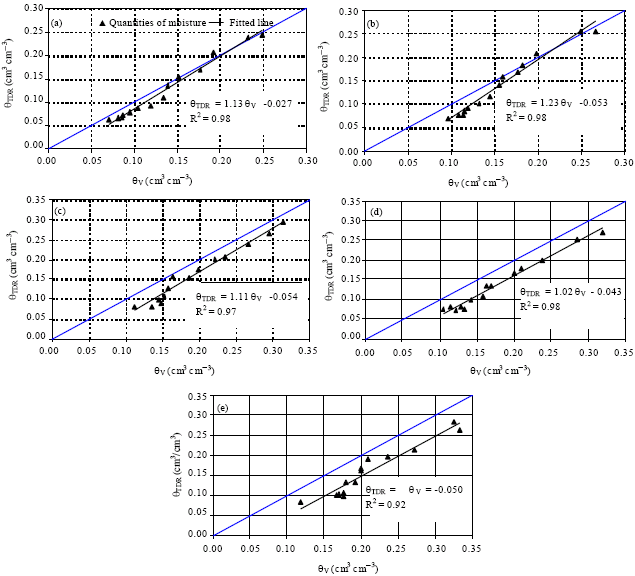 | |
| Fig. 2: | The comparison between the measured volumetric moisture with gravimetric and TDR methods for studied soil, (a) Sandy loam, (b) Loamy sand, (c) Sandy clay loam, (d) Clay loam and (e) Clay |
This comparison is shown at Fig. 2. By using Eq. 1 and 2, the RMSE and RE values are calculated for each of the soil samples (Table 5).
With respect to the Fig. 2, it is obvious for the sandy loam and loamy sand at the low moisture (less than 20%), the TDR method estimate the moisture value less than the gravimetric method. The difference between them is nearly 2%, which this difference is increased when the soil ranged from light to heavy textures
When the textures were sandy clay loam, clay loam and clay, the TDR method estimates the moisture value less than the gravimetric method. The difference between them is more than 2%, which this difference is increases with heavy textured soil. As at the clay soil this difference gets to 4%.
From the statistical view point at probability level of 1%, there is not meaningful difference between the moisture values of gravimetric and TDR methods at none of the samples. With respect to the equations of fitted lines it was clarified that there is not meaningful difference between the slope and their intercepts for different textural soil. This illustrates the difference between the measured moisture by TDR and gravimetric methods at the moisture region of studies. At the high moisture region (more than 20%), the device reading value is increased with light being of textures, which this issue was clarify for the loamy-clay and sandy-loam with 11 and 21% clay. At a low moisture range, the TDR device shows the moisture values lower than the gravimetric method. This difference between these two methods is increased with become of heavy textures. With respect to the Table 5, it can be say with increasing of clay content, the slope of the lines is decreases and the RE and RMSE values are increased.
DISCUSSION
In the catalogue of TDR device, using of the capture window of 10 ns for the sepulchral probe (with waveguide length of 20 cm) and connector (with waveguide length of 15 cm) is advised which it is contrast to the results of the present study. The reason of this difference may be the kind of clay which exists into these texture soil. Probably, the reason of impossibility measurement of the moisture at capture window of 40 ns related to the incapability of the software of the TDR device at determining the ending point of pulse motion at waveguide.
The RMSE calculation between the measured volumetric moisture with gravimetric and TDR methods for studied soil shows that this parameter ranges between 0.015 to 0.054. In the device’s catalog the maximum error is mentioned as ±0.02, therefore with respect to this issue the measured error is more than ±0.02 and also the high being of RMSE and standards error, it is necessary to perform the calibration equations for exact determination of the moisture of five textures. With regression analysis, the correlation coefficients ranged between 0.98 and 0.92 are achieved for all textures, which it is explanatory of the high correlation between the TDR and the volumetric methods. These equations and their regression coefficients are shown in Table 4. Also, Dasberg and Dalton (1985) and Nadler et al. (1991) established high correlation between data of volumetric and TDR methods for sandy, sandy loam (0.842) and silty loam (0.982) textures. Chandler et al. (2004) were achieved high linear correlation between the measured moisture by volumetric and TDR methods. They stated that the calibration curve of the TDR device changes with kind of soil and calibration of the reflectometer as individually would causes the achieved results have more accuracy.
Also, Ponizovsky et al. (1999) with analysis of the variance table stated that there is not significant difference between the moisture values of the gravimetric and TDR methods. At the determination of the soil water content by TDR device, the clay and its type were the factors which affect the device’s accuracy. As with increasing of clay texture, the device’s accuracy is decreases. The effect of clay on the device’s calibration is because of the physical and chemical properties of this mineral, specially its specific area. Different soil have different specific area which it is as result of differences at type of clay mineral, texture soil, type of clay and the values of organic mater. Some of the important characteristics of the soil such as maintenance capacity and the exchange capacity of cations are related with the specific area of the soil. May be some of the water molecules adsorbed by clay particles area through the hydrogen bond and some of them may be hydrates by exchange ions. The effect of cations on water molecules has more effect when it has more load or less sizes.
With respect to the graphic chart of five texture soil (Fig. 2), it is characterized that with increasing of clay amount, the estimation of the moisture is decreasing by TDR device. The reason may be attributed to the confined free available water in the soil resulted in increasing the specific area of the moisture maintenance. As electrostaticaly the di-electric constant of the confined water (3-5) has less than the free water (70-80).
Souza et al. (2001) stated that the mineral material of the soil is the most important factors which affected the di-electric constant of the soil. Also, they stated that the high values of the iron oxide and clay of the soil would causes the increasing of the specific area, water maintenance capacity and the decreasing of the available free water in the soil and as result it causes the di-electric to be constant.
Ponizovskt et al. (1999) observed that with increasing of clay amount of soil the moisture values is increased and at the same moisture the di-electric constant is decreased by increasing of soil clay.
Dirksen and Dasberg (1993) concluded that the di-electric of fine texture soil is less than coarse texture soil at the same moisture and this difference is increased with increases of moisture. Maybe during installation of the probes in the soil, air sits around the probe bar. By reason of constant sensitive of di-electric to dielectric properties of environment around the probe bar and to differ of di-electric constant of air and soil, the sitting of the air around the probe bar may be have significant effect on the accuracy measurement and this effect increases with distance between probe bars and increasing of moisture (Siddiqui et al., 2000).
The light textured soil in comparison with heavy and medium textured soil have uniform distribution. The dimensions and particle shapes of these soil have high variety and often they have aggregate. Therefore in these soil the total spaces involving spaces between aggregate and spaces between particles. In these soil the particle size distribution is one of the main physical properties which have important role in moisture behavior of the soil. Indeed this parameter is determinant of precise situation of porosity of the soil. In principle, the moisture situation of the soil is the function of the water potential which available in the soil. Also, the water potential is the function of the pores and particle size of the soil.
In duration of carry out of the experiment the temperature of the laboratory was 28 to 32° which in conformity with former results, the temperature is not effective in generation error and calibration of the device (the temperature less than 40° has not sensible effect on the calibration of the device and in this situation it has not require revisory coefficient (Persson and Berndtsson, 1998).
The variation of the soil density during probe installation and distribution of the soil around the probe bar, it causes error at moisture measurement. Probably the substituted soil cause variation of soil density around the bars which it has effect on the measured di-electric. The variation of soil density depends on the initial soil density, imposed pressure, the type of soil and degree of saturation (Siddiqui et al., 2000).
Base on the properties of the used cable which mentioned in the catalogue it can be ignore the effect of cable length in decreasing of signal energy and subsequently making error at moisture measurement. There are errors in different stages of determination of gravimetric moisture and change it to the volumetric moisture. For example it can mention to the error of weighting samples for determination dry and wet weights and also the calculation error of bulk density for each soil texture. Since, at the total duration of the experiment from the beginning of soil saturation until the drying, the soil density within cylinder frequently changing, therefore considering an average of conditions from begging to end of the experiment it would have effects on the results.
In addition to the mentioned errors the following factors are the sources of it.
Small sample, sitting quality of the probe into the vase soil, the physical and chemical changing of the samples as the result of probe sitting into the soil, crack and void space which produced around the probe at total duration of the experiment, measurement error of the bulk density of the samples and changing of the weighting moisture to the volumetric moisture, the compressing of the soil and as result of it long duration of the signal moving into the soil, difference at some of the soil properties such as sand particle of any texture, the quality of the similarity of soil column, not equally of the time period between readings, non uniformity of texture soil and the comparison situation of the soil.
The majority soil of the Kurdistan Providence are medium, heavy and high heavy textures. With respect to the sensitivity of the TDR device to amount of clay which it is the main and effective factor on the calibration of the TDR device, it can be state that in some of the agriculture area the TDR device can be used for determination of soil water content. But it is necessary to modify coefficients or calibration equation in respect to the soil textures.
CONCLUSIONS
The results of this research can be stated as following:
| • | For total of studied textures (loamy sand, sandy loam, sandy clay-loam, clay loam, clay) the values of measured moisture at the capture windows of 20 ns was more accuracy rather than other capture windows |
| • | For total of studied textures the TDR device can not measure the soil water content at capture window of 40 ns |
| • | For loamy-sand and Sandy-loam textures when the moisture was less than 20% and also for other textures at total range of measurement, the TDR device measured the moisture values less than the gravimetric method. This difference is increased when the soil ranged from light to heavy textures |
| • | The comparison of the studied textures indicated that with increasing of clay content, the fitted lines slope is decreasing, but the RMSE values have increasing rate which it indicated the effect of clay content on the accuracy of TDR device |
| • | The air sitting around the waveguides would cause the moisture values estimated less than its actual values. This issue has more effect about the sepulchral probe because it has three bars (waveguide) and therefore it must be take more accuracy during installation |
| • | From the statistical view at probability level of 1% there is no difference between the measured value of moisture by TDR device and gravimetric method |
| • | For the all soil textures the fitted regression lines have high regression coefficient |
REFERENCES
- Bittelli, M., F. Salvatorelli and P.R. Pisa, 2007. Correction of TDR-based soil water content measurements in conductive soils. Geoderma, 143: 133-142.
Direct Link - Chandler, D.G., M. Sayfried, M. Murdock and J.P. Mcnamara, 2004. Field calibration of water content reflectometers. Soil Sci. Soc. Am. J., 68: 1501-1507.
Direct Link - Camilo de L.T. de Andrade, �dio L. da Costa and Paulo E.P. de Albuquerque, 2003. Development and calibration of TDR wave guides. Rev. Bras. Eng. Agric. Ambient., 7: 173-176.
CrossRefDirect Link - Dasberg, S. and F.N. Dalton, 1985. Time domain reflectometry field measurements of soil water content and electrical conductivity. Soil Sci. Soc. Am. J., 49: 293-297.
CrossRef - Davis, J.L. and A.P. Annan, 1977. Electromagnetic detection of soil moisture: Progress report I. Can. J. Remote Sens., 3: 76-86.
Direct Link - Hallikainen, M.T., F.T. Ulaby, M.C. Dobson, M.A. El-Rayes and L.K. Wu, 1985. Microwave dielectric behavior of wet soil-part 1: Empirical models and experimental observations. IEEE Trans. Geosci. Remote Sens., 23: 25-34.
CrossRef - Hoekstra, P. and A. Delaney, 1974. Dielectric properties of soils at UHF and microwave frequencies. J. Geophys. Res., 23: 9-20.
CrossRef - Dirksen, C. and S. Dasberg, 1993. Improved calibration of time domain reflectometry soil water content measurements. Soil Sci. Soc. Am. J., 57: 660-667.
Direct Link - Ledieu, J., P. De Ridder, P. De Clerck and S. Dautrebande, 1986. A method of measuring soil moisture by time domain reflectometry. J. Hydrol., 88: 319-328.
CrossRef - Nadler, A., S. Dasberg and I. Lapid, 1991. Time domain reflectometry measurements of water content and electrical conductivity of layered soil columns. Soil Sci. Soc. Am. J., 55: 938-943.
Direct Link - Persson, M. and R. Berndtsson, 1998. Texture and electrical conductivity effects on temperature dependency in time domain reflectometry. Soil Sci. Soc. Am. J., 62: 887-893.
Direct Link - Ponizovsky, A.A., S.M. Chumdinova and Y.A. Pachepsky, 1999. Performance of TDR calibration models as affected by soil texture. J. Hydrol., 218: 35-43.
CrossRef - Pumpanen, J. and H. Ilvesniemi, 2005. Calibration of time domain reflectometry for forest soil humus layers. Boreal Environ. Res., 10: 589-595.
Direct Link - Topp, G.C., J.L. Davis and A.P. Annan, 1980. Electromagnetic determination of soil water content: Measurements in coaxial transmission lines. Water Resour. Res., 16: 574-582.
CrossRefDirect Link - Souza, C.F., E.E. Matsura and R. Testezlaf, 2001. Aplication of time domain reflectometry technique in tropical soil. Proceedings of the 2nd International Symposium and Workshop on Time Domain Reflectometry for Innovative Geotechnical Applications, September 5-7, 2001, Northwestern University, IL., pp: 273-280.
- Siddiqui, S.I., V.P. Drnevich and R.J. Deschamps, 2000. Time domain reflectometry development for use in geotechnical engineering. Geotechnical Test. J., 23: 9-20.
CrossRef - Or, D. and J.M. Wraith, 1999. Temperature effects on soil bulk dielectric permittivity measured by time domain reflectometry: A physical model. Water Resour. Res., 35: 371-384.
CrossRef