
Maria Rizzi
Dipartimento di Elettrotecnica ed Elettronica, Politecnico di Bari via E. Orabona, 4-70125 Bari, Italy
Matteo D�Aloia
Dipartimento di Elettrotecnica ed Elettronica, Politecnico di Bari via E. Orabona, 4-70125 Bari, Italy
Beniamino Castagnolo
Dipartimento di Elettrotecnica ed Elettronica, Politecnico di Bari via E. Orabona, 4-70125 Bari, Italy
Journal of Applied Sciences
Year: 2009 | Volume: 9 | Issue: 8 | Page No.: 1412-1421


ABSTRACT
In this study, a real-time fast parallelized processing technique for C-point locations is presented. Singularity detector adopting a multiscale wavelet transform is used for impedance cardiography signal processing. Both theoretical analysis and experimental results show the method reliability and sensitivity. Moreover, the algorithm noise immunity has been tested adding Gaussian noise with a variable variance to the real ICG signal. Test results with minimum interferences from noise and artefacts have been obtained.
PDF Abstract XML References Citation
How to cite this article
Maria Rizzi, Matteo D�Aloia and Beniamino Castagnolo, 2009. High Sensitivity and Noise Immune Method to Detect Impedance Cardiography Characteristic Points Using Wavelet Transform. Journal of Applied Sciences, 9: 1412-1421.
DOI: 10.3923/jas.2009.1412.1421
URL: https://scialert.net/abstract/?doi=jas.2009.1412.1421
DOI: 10.3923/jas.2009.1412.1421
URL: https://scialert.net/abstract/?doi=jas.2009.1412.1421
INTRODUCTION
Patients with chronic heart failures have periodic episodes of clinical decompensation that do not impair the quality of life only but also consume substantial health care resources such as hospitalization costs. Heart failure management programs have been developed to reduce frequency and severity of these clinical events, but their effectiveness may be limited by physician difficulty in identifying patients at imminent risk. Reliable prediction of these events may avoid the clinicians to intervene aggressively and may minimize potentially the need of hospitalization. It has been hypothesized that the check of hemodynamic variable values might identify critical patients (Packer et al., 2006).
Frequent evaluation and use of these parameters is limited because of the invasiveness of the most accurate investigation techniques. Today, the introduction of impedance cardiography (ICG) has overcome this limitation. It has been widely adopted because it is noninvasive, easy to use and suitable for long-term and continuous monitoring of hemodynamic function (Jensen et al., 1995).
ICG principle is based on measures of the thorax resistance variations caused both by air flow through lungs and blood flow from left ventricle to aorta. The value of these variations makes the recreation of cardiac cycle process possible. Moreover, unexpected increasing or decreasing of impedance can be related to pathological causes such as heart decompensation, heart and valve failures, hypertension and other chronic diseases (Treister et al., 2005).
Wang et al. (1995) have been developed both to study physiological mechanisms for understanding origin and meaning of ICG signals and to improve effectiveness and applicability of ICG diagnostic test adopting advanced signal processing techniques.
In particular, many efforts have been done to implement automatic detection of reference points in biological signals. However, existing peak detection algorithms are difficult to automate for generic use because either they rely on a number of parameters that need to be customized for a particular application or they use reference informations that are highly specialized for a particular application.
Most of the proposed methods make use of filtering technique (band pass filtering and temporal filtering) (Leski and Tkacz, 1992; Pan and Tompkins, 1984), or adaptive thresholding technique (Sun et al., 2005; Suppappola and Sun, 1994). All the previous techniques exhibit limitations when real signal are adopted (Sun et al., 2005). In fact, the first drawback of filtering-based approach is that frequency variations in the signal under test (due to different causes such as, for instance, cardiac frequency changes) may adversely affect the method performance. For instance, the frequency band of some biological signal, such as ECG, differs for different subject and can change for the same subject due to particular events. The second problem in the filter based algorithms is the frequency band overlapping of noise and some biological signals. Therefore, the choice of a suitable bandwidth is a trade off between noise reduction and loss of high frequency details while the duration of the sliding window is a trade off between false and missed detections.
Whereas, the main problem of thresholding techniques are their sensitivity to baseline variations and signal intensity. This high noise sensitivity can be a problem for some types of signals having low signal to noise (S/N) ratio.
An extensive overview of the various algorithm for signal peak detention can be found in (Kohler et al., 2002) which includes approaches based on neural networks, adaptative filters, Hidden Markov models, Hilbert transform, too.
In this study, an improved signal processing technique suited for the implementation in design tools, is presented. The new technique implements a fast parallelized algorithm based on singularity detector adopting a multiscale wavelet transform. The obtained simulation results show the method independence from noise and artefacts.
ICG TECHNIQUE
Impedance Cardiography is the study of the cardiac function by means of thorax electrical impedance measurements. High frequency (20-100 kHz), low intensity current (1-5 mA rms) is injected through the thorax by some electrodes and the impedance change is sensed by measuring a voltage across other electrodes. No risk of physiological effects is present because various tissues of human body are not excitable at this frequency and at this low current level (Patterson, 1989). The impedance variation can be used for diagnostic informations and for Stroke Volume (SV) estimation by using blood flow appropriate model. The term SV indicates the amount of blood pumped by the heart left ventricle in one contraction.
Figure 1 shows a typical impedance waveform obtained from electrodes in which the characteristic points are indicated.
Steady-state basal impedance comprises the major component of total thoracic impedance and two oscillating components: the respiratory and the cardiac component. Since air is a poor electrical conductor, the impedance (Z) increases during inspiration and decreases during expiration, resulting in an oscillation of Z equal to the respiratory rate.
Pulsating blood flow through the thoracic aorta causes shifts in the thoracic impedance as a function of changes in blood volume. In fact, since blood is the most conductive tissue between the electrodes, the rise of blood volume causes the reduction of Z value. Moreover, as blood flow increases, Z decreases since the blood speed causes alignment of erythrocytes to produce a more conductive path.
 | |
| Fig. 1: | Typical impedance waveforms from the thorax of a human subject, where, A: Atrial activity, B: Synchronous wave with first heart sound, C: Largest decrease in impedance during systole, X: Aortic valve closure, Y: Pulmunaary valve closure and O: Largest decrease in impedance during diastolw close in time to mitral valve opening |
This oscillating component of total thoracic impedance is displayed as pulsating variation in impedance that can be expressed adopting the derivative (dZ/dt). Measurements of thoracic impedance changes (dZ/dt waveform) during the cardiac cycle are used to calculate SV. There are several ways to calculate SV (Bernstein, 1986; Kubicek et al., 1974; Sramek, 1982) generally all the equations take into account position and value of the C-point related to the B-point and the X-point.
In this study, a fast parallelized real time method for the exact localization of C points is presented.
THE WAVELET TRANSFORM
Biomedical signals are generally non stationary with significant events characterized by both time location and frequency content. Therefore, the frequency analysis of such signals through Fourier technique is unsatisfactory, because it is efficient in providing frequency discrimination but poor in time localization. Vice versa the wavelet transform provides temporal and spectral information simultaneously, so it is suitable for determining characteristic points of non stationary signals, such as the ICG signal. It decomposes a time variant signal into several components having various scales or resolutions. A suitable time and frequency limited wavelet is chosen as the mother. Scaling and shifting the mother wavelet, a family of functions called daughter wavelets is generated. For small values of the scale factor, wavelet is constructed in the time domain and gives informations about signal fine details. Therefore, a global view of signal is obtained by large value of scale factor (Haddad, 2003). The wavelet transform of a time signal at any scale is the convolution of the signal and a time-scaled daughter wavelet.
There are essentially two types of wavelet decompositions: the redundant ones (continuous wavelet transform) and the nonredundant ones (orthogonal, semi-orthogonal, or biorthogonal wavelet bases) (Unser and Aldroubi, 1996). The first type is preferable for feature extraction because it provides a description that is truly shift-invariant. The second type is preferable for data reduction or when the orthogonality of the representation is an important factor. However, the choice between these types of decompositions has to take into account computational considerations, too. A decomposition in terms of wavelet bases using Mallat fast algorithm is typically orders of magnitude faster than a redundant analysis, even if the fastest available algorithms are used (Rioul and Duhamel, 1992; Unser, 1994).
As the aim of this paper is the implementation of a fast parallelized algorithm, a nonredundant wavelet decomposition has been chosen. To determine the best wavelet function to be used, the ICG signal properties have been studied, such as the shape and the time localization of characteristic events. Since the temporal signal shape is an important parameter, orthogonal wavelets are unsuitable to be used. In fact they are unable to provide symmetry in the time domain as a non-linear phase shift is introduced during the analysis. Signal shape is maintained if phase shift is linear. Thus, the wavelet function to be adopted should be a symmetrical function (Dinh, 2001). The Spline wavelets have properties satisfying the previous requirements. The higher order of the Spline wavelet results in the sharper frequency response of the equivalent FIR filter, that is always desirable. But the FIR equivalent filter of the higher order Spline wavelet has longer coefficient series leading to larger computational time consumption. Therefore, the Cubic Spline wavelet is assumed to have an order high enough for this application.
The traditional wavelet theory considers the decomposition algorithm with an iterative structure (in particular an asymmetrical tree structure) that does not efficiently merge with the novel computational techniques, such as parallel processing, concurrent programming and implementation in design tools (Cohen and Kovacevic, 1996). In this study, the a’ trous and the Mallat algorithms for parallelized filter bank design are used (Yang et al., 2005). The algorithm generates a set of parallelized perfect-reconstruction filter banks for an arbitrary number of end-nodes of a traditional tree structure (Koh and Rodriguez-Marek, 2003).
Method description: The method presented in this section processes the first derivative of the impedance cardiography signal and allows to determine the C peak positions in time domain (Fig. 1).
The tested ICG signal has been sampled at 250 Hz (Fig. 2).
For the method implementation, named C_point_DETECTOR, no external trigger source is necessary; therefore the ICG signal is the only input.
Figure 3 shows the adopted algorithm model in which the obtained results are indicated as:
| • | C_point_Number that evaluates the number of peaks presents in the frame under test |
| • | C_Indices that indicates the time position of the located peaks |
The method is carried out in two steps (Fig. 4): Wavelet decomposition and C_Point_Detection.
 | |
| Fig. 2: | ICG signal |
 | |
| Fig. 3: | Algorithm model realized with the software tool MATLAB Simulink® |
 | |
| Fig. 4: | ‘C point_DETECTOR’ System model |
 | |
| Fig. 5: | Wavelet ‘bior3.3’. (a) Decomposition scaling function phi, (b) Decomposition wavelet function psi, (c) Decomposition low-pass filter, (d) Decomposition high-pass filter, (e) Reconstruction scaling function phi, (f) Reconstruction wavelet function psi, (g) Reconstruction low-pass filter and (h) Reconstruction high-pass filter |
Wavelet decomposition: A fit mother wavelet is fundamental for high performance of the proposed ICG detection technique. A wide variety of functions can be chosen as mother wavelet but wavelet bior 3.3 has been adopted because it allows the perfect signal reconstruction keeping phase shift linear. Wavelet bior 3.3 is a cubic spline which is characterized by high frequency splitting and low band coherence (Fig. 5a-h).
To locate C points, the method decomposes the ICG signal into six dyadic scales so to reduce noise sensitivity, significantly (Fig. 6). It is evident that various frequency components of input signal are presented in the different scales. Lower frequency components are in high level scales while higher frequency components are in low level scales.
According to the power spectra of ICG signal, noise and artefacts, it is evident that the larger contribute of the true signal is located in scales 4, 5 and 6, while the scales 1, 2 and 3 are mostly affected by noise (Xu and Liu, 2005).
Adopting a soft thresholding technique applied to levels 1, 2, 3, noise is reduced and then signal is reconstructed in time domain for further processing.
ICG signal representation in wavelet domain is particularly indicated for noisy signals. In fact for searching characteristic points, processing of noise free scales only, such as scales 4-5-6, is sufficient. The method greater advantage is evident in comparison with frequency analysis which needs informations of the overall bandwidths for the C point localizations.
The method uses an evolution of the classical Mallat decomposition, called a’ trous algorithm. The a’ trous algorithm for non-orthogonal wavelets uses the same filter bank structure as the Mallat algorithm (Mallat, 1989), but differs for high pass and low pass FIR filters. It has been demonstrated that after the application of wavelet filters for j-times, the precision of a’ trous algorithm is 2j time higher then Mallat algorithm (Table 1) (Wang et al., 1995; Shensa, 1992).
 | |
| Fig. 6: | Decomposition of ICG signal over six diadic scales using a’ trous algorithm |
 | |
| Fig. 7: | Method procedure for too closed peaks management |
| Table 1: | Precision of the Mallat and the a’ trous algorithms varying decomposition levels |
 | |
Usually, wavelet decomposition algorithms make use of filters in a tree structure. This is unsuitable for both the parallel computing and the implementation in design tools. To overcome these limits, equivalent parallel filter banks are used. However, as it is well known, the output signal realignment is necessary to equalize the delay introduced by each filter. This structure makes the algorithm attractive for a hardware implementation (Koh and Rodriguez-Marek, 2003).
C_point_Detection: At the second step the method first spots the positions of all ICG signal peaks, then the C-point locations.
A point of maximum value is present in component signals (scales 4, 5, 6) in the same location of each singularity in ICG signal. Adopting a parallel algorithm, the proposed method looks for local maximum points inside scale 4, scale 5 and scale 6 using a thresholding technique: only maximum points higher than the adopted threshold value are taken into account. Occurrence of too close peaks is solved replacing them with one new virtual peak located in a middle position between them. Figure 7 shows the spatial representation of local maximum points after the replacement of too close maximums. For instance, peaks P and Q of scale 4 selected by the method as too close points, are replaced by the point R in a new spatial representation named scale 4a.
Each processed scale gives information about the same signal, so points located inside each scale are related to each others. For this reason, the method executes a tracing across scales to locate overlapping singular points. However, as the perfect coincidence of two or more points is almost impossible, a confidence interval of occurrence is associated to each point.
For software implementation, a window having a suitable size is constructed around each singular point considering one scale at a time.
The generic window in a generic scale is analyzed to determine if peaks of other scales are located inside it. The research is iterated for both all the windows of a scale and for all the scales. The method defines as valid peaks, those that are present in two out of three scales at least. The best estimate of the valid peak position (the true C-point position) is obtained averaging peak positions inside the different scales.
Figure 8a shows the characterization of a new spatial representation named scale 4b for peaks of scale 4a consequently to the definition of a confidence interval for each point. For instance, the method defines a window for peak S and verifies if peaks of other scales are located inside this window. In this example, point T of scale 6a is inside the window. Therefore point U is defined as valid value in the new representation named scale 4b. U point location is in the middle between S and T positions. Figure 8b and c show the same analysis for points belonging to scales 5a and 6a, respectively.
Points of scales 4b, 5b and 6b are grouped in one spatial representation indicated in Fig. 9 with TEMP. Points that are too closed in TEMP are replaced with one peak having the middle location as shown in representation named OUTPUT.
 | |
 | |
| Fig. 8: | (a-c) Parallel procedure for peak validation |
 | |
| Fig. 9: | Procedure last step for C point location |
In conclusion, the following steps characterize the new method:
| • | Signal processing in PARALLEL filter banks for wavelet decomposition |
| • | PARALLEL searching for local maximum points inside scales which contain the widest noise free signal contribute |
| • | Replacement of too close peaks in each scale |
| • | validation of peak points for each scale with respect to peak position in other scales |
| • | C-point localizations adopting a simple decisional algorithm |
RESULTS AND DISCUSSION
Generally speaking, the absence of standard and validated ICG data bases, such as those used for ECG signals, makes the algorithm efficiency evaluation difficult and provides results poorly reproducible and comparable. For this reason a real ICG signal has been tested containing the typical noise sources: electromyographic interferences, powerline interference, baseline drift due to respiration and electrode motion artefacts (Fig. 10).
Moreover, the algorithm noise immunity has been evaluated in fact this ICG signal was corrupted by a Gaussian additive noise with zero mean value and several variance values.
To evaluate the method detection performance, the following parameters are adopted (Benitez et al., 2001).
 | |
| Fig. 10: | Detail of tested frame |
Where:
| TP | = | No. of true positive detections |
| FN | = | No. of C points present in the signal that the algorithm is not able to detect (the number of false negatives) |
| FP | = | No. of C points detected by the algorithm but really not present in the signal (the number of false positives) |
Two different test situations have been considered denoted as case (a) and case (b), respectively.
 | |
| Fig. 11: | Se and P parameters for different threshold values |
 | |
| Fig. 12: | Trend of Se and P parameters vs threshold for different noise levels (a) v = 0, (b) v = 0.04, (c) v = 0.08 and (d) v =0.1, v: Variances |
Case a: The frame under test presents C-peak value fluctuations in the range (1![]() 1.5Ω/sec).
1.5Ω/sec).
The algorithm gives Se and P parameters of about 99,8% for a threshold value in the range (30-40%) of C* denoting with C* the C point average value (Fig. 11)
Case b: Predictivity and sensibility parameters vary with both the adopted threshold value (T) and the Gaussian additive noise level represented with the variance parameter (v) (Fig. 12a-d).
Threshold in correspondence to the cross point of the sensitivity and the predictivity curves, for which Se = P and consequently FN = FP, depends on the variance v as indicated in Fig. 13. Simulations show that this is almost the best value to obtain the lower number of FN and FP, with the near optimum shifted slightly toward lower values of T.
In Figure 14 the curves of P and Se vs the noise variance in the range up to 0.1 (Ω/sec)2 are shown keeping T = 0.45C*. P and Se decrease of about 19 and 8%, only.
However with higher noise levels up to v = 0.2 (Ω/sec)2 and the same threshold value T = 0.45C*, reductions are much higher especially for P which decreases to 0.66. The previous value represents a reduction of about 34% with respect to the case with v = 0 (Fig. 15).
Anyway it is to noted that very heavy noise conditions have been chosen to test the algorithm noise immunity.
 | |
| Fig. 13: | Cross point curve for different noise levels |
 | |
| Fig. 14: | Sensitivity and positive predictivity curves vs. noise level |
An additional Gaussian noise signal with v = 0.2 (Ω/sec)2 corrupts heavily the ICG signal as it is shown in Fig. 16. In particular the noise, besides changing the ICG signal shape, introduces many false peaks while cancels a minor number of true peaks.
A second major remark is the necessity to adapt the threshold value to the particular noise conditions in order to obtain the best results. To confirm this assumption, several simulations have been drawn out to determine DER parameter values vs. noise variance (0 = v = 0.2 (Ω/sec)2) for the previously used T values (T = 0.45C* and T = 0.55C*) (Fig. 17). It is evident that up to v = 0.1 (Ω/sec)2 DER values obtained adopting T = 0.45C* are lower that the corresponding values obtained with T = 0.55C*, while for the remaining variance range values best performance is obtained with T = 0.55C*. Therefore it is mandatory to fit threshold values to noise conditions.
 | |
| Fig. 15: | Sensitivity and positive predictivity curves vs. noise level |
 | |
| Fig. 16: | Detail of the tested ICG signal corrupted by a Gaussian noise with 0.2 variance value |
 | |
| Fig. 17: | DER curve vs. noise level and threshold |
Test results show that the optimal position of the threshold is related to the additional noise intensity valuable from the first three dyadic scales in which the ICG signal is decomposed (scale 1-2-3).
 | |
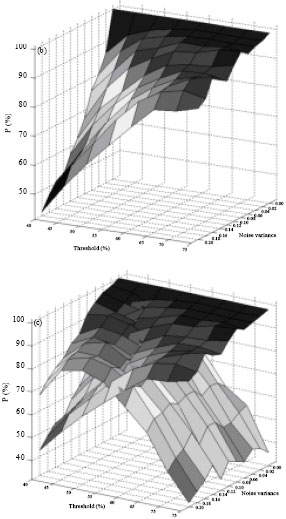 | |
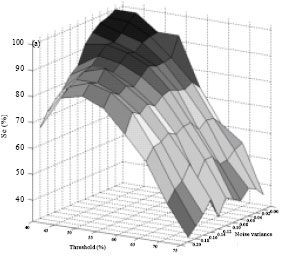
| Fig. 18: | 3D analysis of Se and P parameters, (a) Sensitivity, (b) Positive predictivity, (c) Sensitivity vs. Positive predictivity |
In Fig. 18, 3d analysis of Se and P is shown in which it is evident their dependence from variance and threshold.
Moreover, the absence of standard and validated ICG databases makes the algorithm efficiency evaluation difficult and provides unreproduceable and incomparable results.
CONCLUSION
In this study, a real-time method has been developed for the analysis of the impedance cardiography signal. The wavelet transform is used to detect the C points on the dZ/dt signal. The adopted algorithm optimizes the computational time as it processes the ICG signal with a parallel procedure. In this technique good sensitivity and predictivity values are obtained. In fact the algorithm applied to a real ICG signal has sensitivity and positive predictivity equal to 99,8%. Moreover in presence of very noisy signals such as those obtained adding a Gaussian noise with variable variance to the real ICG signal, the algorithm performance can be easily improved using variable threshold level depending on the noise level evaluated from the first scales of the wavelet decomposition. Also in this situation, results with minimum interferences from noise and artifacts have been obtained, confirming the algorithm high noise immunity degree.
REFERENCES
- Benitez, D., P.A. Gaydecki, A. Zaidi and A.P. Fitzpatrick, 2001. The use of the Hilbert transform in ECG signal analysis. Comput. Biol. Med., 31: 399-406.
CrossRef - Bernstein, D.P., 1986. A new stroke volume equation for thoracic electrical bioimpedance: Theory and rationale. Crit. Care Med., 14: 904-909.
Direct Link - Cohen, A. and J. Kovacevic, 1996. Wavelets: The mathematical background. Proc. IEEE, 84: 514-522.
CrossRef - Dinh, H.A.N., D.K. Kumar, N.D. Pah and P. Burton, 2001. Wavelets for QRS detection. Proceedings of the 23rd Annual International Conference of the 2001, October 25-28, 2001, IEEE Engineering in Medicine and Biology Society, pp: 1883-1887.
CrossRef - Jensen, L., M.N.J. Yakimets and K.K. Teo, 1995. A review of impedance cardiography. Heart Lung: J. Acute Crit. Care, 24: 183-193.
CrossRefDirect Link - Koh, M.S. and E. Rodriguez-Marek, 2003. Generalized and parallelized a trous and Mallat algorithms to design non-uniform filter-banks. Proceedings of the International Symposium on Signal Processing and Information, December 13-16, 2003, Darmstadt, Germany, pp: 38-41.
CrossRef - Kohler, B.U., C. Hennig and R. Orglmeister, 2002. The principles of software QRS detection. IEEE Eng. Med. Biol. Mag., 21: 42-57.
CrossRef - Kubicek, W.G., F.J. Kottke, M.U. Ramos, R.P. Patterson and D.A. Witsoe et al., 1974. The Minnesota impedance cardiograph-theory and applications. Biomed. Eng., 9: 410-416.
PubMed - Haddad, S.A.P., R. Houben and W.A. Serdijn, 2003. Analog wavelet transform employing dynamic translinear circuits for cardiac signal characterization. Proceedings of the International Symposium on Circuits and Systems, May 25-28, 2003, IEEE Computer Society, pp: 1121-1124.
CrossRef - Leski, J. and E. Tkacz, 1992. A new parallel concept for QRS complex detector. Proceedings of the 14th Annual International Conference of the IEEE Engineering in Medicine and Biology Society, October 29-November 1, 1992, Paris, France, pp: 555-556.
Direct Link - Mallat, S.G., 1989. A theory for multiresolution signal decomposition: The wavelet representation. IEEE Trans. Pattern Anal. Mach. Intell., 11: 674-693.
CrossRefDirect Link - Packer, M., W.T. Abraham, M.R. Mehra, C.W. Yancy and C.E. Lawlesset al., 2006. Utility of impedance cardiography for the identification of short-term risk of clinical decompensation in stable patients with chronic heart failure. J. Am. Coll. Card., 47: 2245-2252.
CrossRef - Pan, J. and W.J. Tompkins, 1985. A real-time QRS detection algorithm. IEEE Trans. Biomed. Eng., 32: 230-236.
CrossRefDirect Link - Patterson, R.P., 1989. Fundamentals of impedance cardiography. IEEE Eng. Med. Biol. Mag., 8: 35-38.
CrossRefDirect Link - Rioul, O. and P. Duhamel, 1992. Fast algorithms for discrete and continuous wavelet transforms. IEEE Trans. Inform. Theory, 38: 569-586.
CrossRefDirect Link - Shensa, M.J., 1992. The discrete wavelet transform: Wedding the a trous and Mallat algorithms. IEEE Trans. Signal Process., 40: 2464-2482.
CrossRef - Sun, Y., K. Luk Chan and S. Muthu Krishnan, 2005. Characteristic wave detection in ECG signal using morphological transform. BMC Cardiovasc. Disord., 5: 28-28.
PubMed - Suppappola, S. and Y. Sun, 1994. Nonlinear transforms of ECG signals for digital QRS detection: A quantitative analysis. IEEE Trans. Biomed. Eng., 41: 397-400.
CrossRef - Treister, N., K. Wagner and P.R. Jansen, 2005. Reproducibility of impedance cardiography parameters in outpatients with clinically stable coronary artery disease. Am. J. Hypertens., 18: 44-50.
CrossRef - Unser, M. and A. Aldroubi, 1996. A review of wavelets in biomedical applications. Proc. IEEE, 84: 626-638.
CrossRefDirect Link - Xu, X. and Y. Liu, 2005. Adaptative threshold for QRS complex detection based on wavelet transform. Proceedings of the 27th Annual International Conference of the Engineering in Medicine and Biology Society, September 1-4, 2005, Shanghai, China, pp: 7281-7284.
CrossRefDirect Link - Yang, L., P. Chenglin, W. Huafeng, Z. Zhiqiang and M. Min, 2005. Using a trous algorithm and modulus maximum lines to detect R-wave of ECG signal. Proceedings of the 27th Annual Conference on IEEE Engineering in Medicine and Biology, September 1-4, 2005, Shanghai, China, pp: 1270-1273.
CrossRef - Wang, X., H. Sun and J.M. van de Water, 1995. An advanced signal processing technique for impedance cardiography. IEEE Trans. Biomed. Eng., 42: 224-230.
CrossRefDirect Link