
Paulo Eduardo Teodoro
State University of Mato Grosso do Sul (UEMS), 87020-900, Aquidauana, Mato Grosso do Sul, Brazil
Caio Cezar Guedes Correa
State University of Mato Grosso do Sul (UEMS), 87020-900, Aquidauana, Mato Grosso do Sul, Brazil
Francisco Eduardo Torres
State University of Mato Grosso do Sul (UEMS), 87020-900, Aquidauana, Mato Grosso do Sul, Brazil
Jose Francisco de Oliveira-Junior
Department of Environmental Sciences, Forest Institute, Federal University of Rio de Janeiro (UFRRJ), 23890-000, Seropedica, Rio de Janeiro, Brazil
Carlos Antonio da Silva Junior
Departament of Agronomy, State University of Maring� (UEM), Av. Colombo, 5790-Bloco J45, Postal Code 87020-900, Maring�, Paran�, Brazil
Givanildo Gois
Department of Environmental Sciences, Forest Institute, Federal University of Rio de Janeiro (UFRRJ), 23890-000, Seropedica, Rio de Janeiro, Brazil
Rafael Coll Delgado
Department of Environmental Sciences, Forest Institute, Federal University of Rio de Janeiro (UFRRJ), 23890-000, Seropedica, Rio de Janeiro, Brazil


ABSTRACT
In order to generate information relevant to the Mato Grosso do Sul (MS), the aim was analyze the occurrence of wet and drought periods through the SPI using Standardized Precipitation Index (SPI) in this Brazilian State. Rainfall data of 29 stations (sites) of MS were obtained of the National Water Agency Database collected from 1983-2013. At each site and year, the rainfall daily data were added up to obtain the monthly rainfall (mm month-1), of each month of the year. Thus, were formed 348 time series (12 months×29 sites), that it were used to calculate the SPI in annual scale. The fit was found Normal distribution of 384 time series of monthly rainfall using the Kolmogorov-Smirnov test. The SPI is able to identify the drought and wet periods, when the occurrence of ENOS events, regardless of categorization, in Mato Grosso do Sul State, Brazil. The analysis of the relative frequencies shows that the moderately drought and wet categories stands out about the other categories of SPI. The moderately drought category occurs in episodes of El Niño strong and moderate and moderately wet category in episodes of La Niña strong and weak.
PDF Abstract XML References Citation
Received: March 20, 2015;
Accepted: May 25, 2015;
Published: June 29, 2015
How to cite this article
Paulo Eduardo Teodoro, Caio Cezar Guedes Correa, Francisco Eduardo Torres, Jose Francisco de Oliveira-Junior, Carlos Antonio da Silva Junior, Givanildo Gois and Rafael Coll Delgado, 2015. Analysis of the Occurrence of Wet and Drought Periods Using Standardized Precipitation Index in Mato Grosso do Sul State, Brazil. Journal of Agronomy, 14: 80-86.
DOI: 10.3923/ja.2015.80.86
URL: https://scialert.net/abstract/?doi=ja.2015.80.86
DOI: 10.3923/ja.2015.80.86
URL: https://scialert.net/abstract/?doi=ja.2015.80.86
INTRODUCTION
The climate of a region is determined by the long-term average, frequency and extremes of several meteorological variables, most notably temperature and precipitation. In a largely tropical country such as Brazil, rainfall is a precious natural resource and it is quite variable. Thus any fluctuations or trends in its geographical distribution and quantity could have significant implications for socioeconomic sectors, such as, agricultural productivity, food security, water quality, water resource management, land use, human health, as well as ecological impacts, such as, biodiversity (Giddings et al., 2005).
The State of Mato Grosso do Sul (MS), Brazil, covers an area of approximately 350,000 km2 of which 13,000 km2 are exploited in agriculture, being the crops of higher expression soybeans, corn, cotton, cane sugar and irrigated rice (CONAB., 2014). Agriculture has as main water source the rainfall patterns, which at times has compromised agricultural production due to its variability, sometimes with long drought periods, sometimes with extreme events that exceed the soil water retention capacity, triggering floods (Correa et al., 2014). Besides the influence on agriculture, drought periods affect the water level of water sources and reservoirs of hydroelectric plants, bringing problems to the urban water supply and electricity generation (Rodrigues et al., 2013; Oliveira-Junior et al., 2014).
The Standardized Precipitation Index (SPI) was developed by McKee et al. (1993) to categorize observed rainfall as a standardized departure with respect to a rainfall probability distribution function. It indicates how precipitation for any given duration (1, 2 months, etc.) at a particular observing site compares with the long-term precipitation record at the same site of the same duration (Edwards and McKee, 1997). According to Keyantash and Dracup (2002), the index compares very favorably against several other "drought" indices and has been adopted by the US National Drought Mitigation Center for operational use to replace the traditional Palmer Drought Severity Index (PDSI).
Bordi et al. (2001) demonstrated that SPI can be used as a tool in the historical reconstruction of drought events in locations in Italy. Lloyd-Hughes and Saunders (2002) developed a high spatial resolution, multi-temporal climatology for the incidence of 20th century European drought using SPI. When the SPI analysis was extended to the Northern Hemisphere some interesting spatially remote teleconnections linking the Tropical Pacific with the European area were shown (Bordi and Sutera, 2001). Seiler et al. (2002) used SPI to study the recurrent floods affecting the southern Córdoba Province in Argentina, as a tool for monitoring flood risk in that region. Giddings et al. (2005) verificated that SPI zones of the whole country presented a fresh and useful perspective on the behavior of rainfall in México.
Due to the severe drought impacts in economic and social activities and try to quantify and describe its impact, various methodologies were created among which are: Drought indices that are based on rainfall data, air temperature and capacity water available (Gois et al., 2013). However, it is important to note that in recent years several drought indices have been evaluated in an attempt to characterize the drought; in which they can provide different answers regarding the impact and severity of drought for the same region, owing to the different demands on the input data (Oliveira-Junior et al., 2012). In Brazil, the use of SPI is not yet widespread. Some studies with this technique have been developed with Brazilian States as Amazonas (Li et al., 2008), Espírito Santo (Blain et al., 2010), Paraíba (Macedo et al., 2010), São Paulo (Blain, 2012) and Tocantins (Gois et al., 2013). Thus, in order to generate information relevant to the MS (Brazil), the aim was analyze the occurrence of wet and drought periods through the SPI in this Brazilian State.
MATERIAL AND METHODS
Characterization and location of the study area: The State of Mato Grosso do Sul is located in Brazil’s Midwest region. Has a total area of 357,145,320 km2, composed of 79 municipalities. The State has several features edaphoclimatic distributed between three biomes with peculiar climatic attributes: Savanna, Atlantic Forest and Pantanal. Altitudes range from 24 to 1,000 m, in the center of the South American continent (Fig. 1).
In the state there are three major topographical units: (1) Pantanal, in the west portion, with a singular drainage network, spread over an immense plain of modest altitudes between 80-200 m, (2) In the center, shows the Divisor Plateau or Serra de Maracajú, elongated in the NE-SW direction, separating the waters of the Paraguay and Paraná river basins, with altitudes ranging from 300 m (Serra de Bodoquena) to over 650 m (Plateau of Amambaí) and (3) In the eastern portion, is located the Upper Paraná shaft, drained by major rivers of arenitic-basalt plateau, with altitudes ranging between 200 and 250 m along the trough (Zavattini, 2009).
Savanna (or Cerrado) is the second largest biome in South America (SA) and covers 22% of the Brazilian territory. It is at this biome that is the source of three major watersheds of AS (Amazônica/Tocantins, São Francisco and Prata), which results in high aquifer potential and great biodiversity. By virtue of its latitudinal position, the region is characterized by the transition between the warm low latitudes climates and mesothermal toughened type climates, of mid-latitudes (Nimer, 1989).
Atlantic Forest is an environmental complex that includes mountain ranges, valleys and plateaus. It was already one of the richest and varied rainwater forest sets of AS but is currently recognized as the most uncharacterized Brazilian biome.
Pantanal covers 25% of the State of Mato Grosso do Sul, being a biome almost exclusive to Brazil. It is characterized by long-term flooding (due to low permeability soil) that occur each year on the plain and cause changes in the environment, wildlife and local populations’ daily life. Pantanal climate is "AW" with rainfall totals ranging between 1,000 and 2,000 mm and 2 distinct seasons: a dry (May to September) and a rainy (October to April), this latter accounting for more than 80% of the total annual rainfall (Mesquita et al., 2013).
Historical series of monthly rainfall: Rainfall data of 29 stations (sites) of Mato Grosso do Sul (MS) were obtained of the National Water Agency Database (http://www.ana.gov.br/) (ANA., 2014), collected from 1983-2013. At each site and year, the rainfall daily data were added up to obtain the monthly rainfall (mm month–1), of each month of the year. Thus, were formed 348 time series (12 months×29 sites), that it were used to calculate the SPI in annual scale.
The treatment and the organization of rainfall data of 29 localities in the State were performed. The historical series with failures were eliminated and filled by the climatologically normal from each of the 11 regions of the State. The fit was found Normal distribution of 348 time series of monthly rainfall using the Kolmogorov-Smirnov test, that addition to not depend on the number of classes data grouping, offers more computational advantages. This test promotes on the discrepancy between the distributions:
where, Fn (x) denotes the theoretical distribution and F0 (x) the adjusted distribution. This test is used to test the null hypothesis versus the alternative hypothesis H1: F ≠ F0 (Everitt and Dunn, 1991).
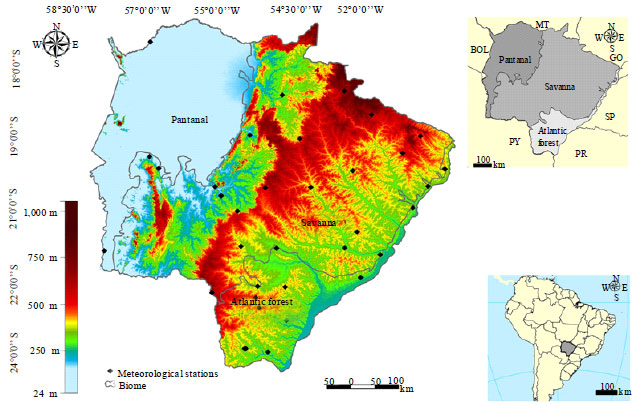 | |
| Fig. 1: | Localization of mato grosso do Sul State, Brazil, in South America, with their respective biomes (Pantanal, Savanna and Atlantic Forest) and the hypsometry (m) |
According to McKee et al. (1993) the historical series is fit to a distribution of gamma probability which is transformed into a normal distribution, where the SPI index for each location and desired period has zero value for its average and unit variance. Gamma distribution is defined by the probability density function (Eq. 1):
| (1) |
Where:
| α>0 (α) Shape parameter (dimensionless); |
| β>0(β) Scale parameter (mm); |
| x>0 (x) Total rainfall (mm); |
| Γ(α) Gamma function defined by Eq. 2: |
| (2) |
The parameters and the gamma probability density function were fit to the frequency distribution of the 29 stations rainfall totals. We calculated the shape and scale parameters of the gamma probability density function estimated for each of the stations at the annual scale.
According to Oliveira-Junior et al. (2012) the maximum-likelihood method (MMV) is the most suitable for the parameter estimates for α and β (Eq. 3 and 4):
| (3) |
| (4) |
where, A is defined by Eq. 5:
| (5) |
where, ![]() = Arithmetic average rainfall (mm), Ln = neperian logarithm, N = number of observations.
= Arithmetic average rainfall (mm), Ln = neperian logarithm, N = number of observations.
The parameters α and β were calculated to find the cumulative probability of a rainfall event observed for the annual scale which the cumulative probability (Eq. 6 and 7):
| (6) |
Replacing the value of ![]() in Eq. 6 reduces the Eq. 7:
in Eq. 6 reduces the Eq. 7:
| (7) |
Which is defined as the incomplete gamma function considering that the incomplete gamma function does not allow null values. The distribution gamma is undefined for rainfall values equal to zero, the cumulative probability can be determined in two parts Eq. 8:
| (8) |
where, P0 is the probability of null values (zeros) and G(x) is the theoretical cumulative distribution, where the parameters are estimated on rainy days. The cumulative probability distribution F(x) is transformed into a normal distribution for the random variable Z with zero mean and variance one, where the variable Z corresponds to the value of SPI. Further details of the empirical cumulative probabilities lies on Oliveira-Junior et al. (2012).
From the calculations in SPI values at the annual scale for the sites in the study area were classified as shown in Table 1.
| Table 1: | Classification of the wet and drought periods of SPI, according to McKEE et al. (1993) |
 | |
It were compared with the drought and wet periods with climate variability mode El Niño-Southern Oscillation.(El Niño and La Niña) based on the classification adopted by Weather Forecast and Climate Studies Center-CPTEC, according to link: http://enos.cptec.inpe.br/-(CPTEC., 2015) When the Oceanic Nino Index (ION) is greater than+0.5°C for at least five consecutive months is considered an El Niño and when the ION is less than -0,5°C for at least five consecutive months is considered a La Nina (CPTEC., 2015).
RESULTS AND DISCUSSION
Kolmogorov-Smirnov test revealed that the data of 325 monthly rainfall time series (93.39%) fit to normal distribution (p>0.01) (Table 2). Given these high percentages with fit of data to Normal distribution, can be conclude that the use this data bank of monthly rainfall has credibility for estimating SPI in Mato Grosso do Sul State.
All municipalities, except Selvíria, presented SPI index in annual scale next to normal (Table 3), indicating that the monthly rainfall occur homogeneously in most years. This homogeneity of rainfall is due to the state of Mato Grosso do Sul be a confluence region and passage of weather systems that produce rainfall and that vary from local scale to the synoptic scale (Zavattini, 2009).
The municipalities Água Clara, Dourados, Nova Andradina, Ribas do Rio Pardo and Rio Brilhante had the highest number of years classified as extremely wet.
| Table 2: | Normality test (Kolmogorov-Smirnov, KS) regarding to 348 monthly rainfall time series in sites of Mato Grosso do Sul State |
 | |
| S: Normal distribution, by Kolmogorov-Smirnov test (p>0.01), N: Non-normal (p≤0.01) | |
Moreover, Campo Grande was the municipality that had the highest percentage of years classified as drought. According to the works of Zavattini (2009) and Correa et al. (2014) an annual rainfall shows a West-Northeast (W-NE) and East-Southeast (E-SE) gradients, being in agreement with our obtained results.
When evaluating the classification of SPI every year, it was verified that 1996 showed the highest percentage of events classified as extremely wet (10.34%), during the 30 years of observation (Fig. 2). The highest percentages according to the extremely dry classification were for the years 1985 and 2002 (13.79%), respectively. The respective years are classified as years of weak La Niña (1985) and moderate El Niño (1994, 2002), according to categorization adopted by CPTEC. (2015).
According to Hayes et al. (1999) values of (-1.50≤SPI≤-1.99) tend to occur sixteen times every hundred years and years extremely drought (SPI≤2.00) occur one time every two hundred years, disagreeing with the results obtained in this work. Exceptional years occurrences are possibly due orographic characteristics as the climate and performance of meteorological phenomena (Macedo et al., 2010).
The drought season showed the highest number of relative frequencies on the moderately drought category in comparison to categories very and extremely drought, especially in the cycles 1994/95 (17.24%-moderate El Niño) and 2007/08 (37.93%-strong La Niña). Similar result for the wet period, where, events in moderately wet category were higher to categories very and extremely wet, especially in the cycles 1989/90 (24.14%-strong El Niño), 1996-1998 (31.03%-end of the weak La Niña event and start of the strong El Niño) and lastly 2008/09 (end of the strong La Niña and start of the moderate El Niño). Another important result found in the study was the variability of SPI in moderately wet category in the 80 and 90 sec, followed by a substantial decline from 2000 sec (Fig. 2). We ascribe this fact to decline the leading producers of rainfall systems (Frontal Systems-FS and South Atlantic Convergence Zone) in Brazil which in turn are directly impacted by the ENOS variation mode and that act directly on the rainfall in the state.
The drought season defined by moderately drought category was restricted to occurrence of strong and moderate El Niño events, unlike moderately wet category with episodes of strong and weak La Niña. It is noteworthy that the SPI was able to identify the drought and wet periods in the occurrence of ENOS events, regardless of the categorization and simple statistical tool (relative frequency) in the state of Mato Grosso do Sul. The results of this study corroborate the results obtained by Gois et al. (2013) in the El Niño Strong category for the state of Tocantins and especially with the results obtained by Oliveira-Junior et al. (2012) in the state of Alagoas for all adopted categories.
| Table 3: | Relative frequence (%) of the SPI events in 29 sites of Mato Grosso do Sul, based on 30 years of observation |
 | |
 | |
| Fig. 2(a-g): | Relative frequence (%) of SPI events in its respective categories in 30 years of observation based on 29 sites of Mato Grosso do Sul, (a) Extremely wet, (b) Extremely drought, (c) Very wet, (d) Very drought, (e) Moderately drought, (f) Close to normal and (g) Moderately wet |
CONCLUSION
| • | The SPI is able to identify the drought and wet periods when the occurrence of ENOS events, regardless of categorization, in Mato Grosso do Sul State, Brazil |
| • | The analysis of the relative frequencies shows that the moderately drought and wet categories stands out about the other categories of SPI. The moderately drought category occurs in episodes of El Niño strong and moderate and moderately wet category in episodes of La Niña strong and weak |
REFERENCES
- Bordi, I., S. Frigio, P. Parenti, A. Speranza and A. Sutera, 2001. The analysis of the standardized precipitation index in the Mediterranean area: Large-scale patterns. Ann. Geofisica, 44: 965-978.
CrossRefDirect Link - Bordi, I. and A. Sutera, 2001. Fifty years of precipitation: Some spatially remote teleconnnections. Water Resour. Manage., 15: 247-280.
CrossRefDirect Link - Blain, G.C., 2012. Monthly values of the standardized precipitation index in the State of Sao Paulo, Brazil: Trends and spectral features under the normality assumption. Bragantia, 71: 122-131.
CrossRefDirect Link - Blain, G.C., J.R.M. Pezzopane, J.E.M. Pezzopane and R. Bonomo, 2010. Standardized precipitation index applied to drought conditions in the State of Espirito Santo, Brazil. Rev. Bras. Eng. Agric. Amb., 14: 1067-1073.
CrossRef - Correa, C.C.G., P.E. Teodoro, E.R. Cunha, J.F. Oliveira-Junior and G. Gois et al., 2014. Spatial interpolation of annual rainfall in the state mato grosso do sul (Brazil) using different transitive theoretical mathematical models. Inter. J. Innov. Res. Sci., Eng. Tech., 3: 16618-16625.
CrossRef - Hayes, M.J., M.D. Svoboda, D.A. Wilhite and O.V. Vanyarkho, 1999. Monitoring the 1996 drought using the standardized precipitation index. Bull. Am. Meteorol. Soc., 80: 429-438.
CrossRefDirect Link - Keyantash, J. and J.A. Dracup, 2002. The quantification of drought: An evaluation of drought indices. Bull. Am. Meteorol. Soc., 83: 1167-1180.
Direct Link - Li, W., R. Fu, R.I.N. Juarez and K. Fernandes, 2008. Observed change of the standardized precipitation index, its potential cause and implications to future climate change in the Amazon region. Philos. Trans. R. Soc. B Biol. Sci., 363: 1767-1772.
CrossRefDirect Link - Lloyd-Hughes, B. and M.A. Saunders, 2002. A drought climatology for Europe. Int. J. Climatol., 22: 1571-1592.
CrossRefDirect Link - Macedo, M.J.H., R.V.S. Guedes, F.A.S. Souza and F.R.C. Dantas, 2010. Analysis of the standardized precipitation index for the Paraiba state, Brazil. Ambi-Agua, 5: 204-214.
CrossRefDirect Link - Oliveira-Junior, J.F., R.C. Delgado, G. Gois, A. Lannes, F.O. Dias, J.C.S. Souza and M. Souza, 2014. Precipitation analysis and its relation to meteorological systems Seropedica, Rio de Janeiro. Floresta Ambiente, 21: 140-149.
CrossRefDirect Link - Seiler, R.A., M. Hayes and L. Bressan, 2002. Using the standardized precipitation index for flood risk monitoring. Int. J. Climatol., 22: 1365-1376.
CrossRefDirect Link - Giddings, L., M. Soto, B.M. Rutherford and A. Maarouf, 2005. Standardized precipitation index zones for Mexico. Atmosfera, 18: 33-56.
Direct Link