

Tsang-Lang Liang
Department of Industrial Education and Technology,National Changhua University of Education, Taiwan, Republic of China
Shih-Li Hsu
Department of Industrial Education and Technology,National Changhua University of Education, Taiwan, Republic of China
Chou-Hai Huang
Department of Industrial Education and Technology,National Changhua University of Education, Taiwan, Republic of China
Yi-Chia Cheng
Department of Industrial Education and Technology,National Changhua University of Education, Taiwan, Republic of China
Information Technology Journal
Year: 2014 | Volume: 13 | Issue: 16 | Page No.: 2567-2573





ABSTRACT
The three main objectives of this study are to explore the growth locus of vocational business school students in their review of math classes, the moderating effect of the growth locus of math class review among different departments and the moderating effect of the growth locus of mass class review among different gender. For this study, a series of math review training classes was held for high school seniors. The students, who participated, went through 9 months of review classes and 5 mock exams. A total of 192 vocational business school students participated in the study, after unsuitable samples were eliminated, there was a total of 191 samples. For this study, repeated measures t-testing and the HLM growth model were used to perform data analysis. Results revealed that math review classes can dramatically improve the math performance of vocational students, the math review class training displayed a U-curve that started out decreasing but eventual increased and there were no moderating effects between different departments or different genders when it came to the training of math review classes.
PDF Abstract XML References Citation
Article History
Received: June 29, 2014;
Accepted: September 15, 2014;
Published: September 29, 2014
How to cite this article
Tsang-Lang Liang, Shih-Li Hsu, Chou-Hai Huang and Yi-Chia Cheng, 2014. An Exploration of the Effectiveness of Mathematics Learning in Junior High School Students Using the HLM Growth Model. Information Technology Journal, 13: 2567-2573.
DOI: 10.3923/itj.2014.2567.2573
URL: https://scialert.net/abstract/?doi=itj.2014.2567.2573
DOI: 10.3923/itj.2014.2567.2573
URL: https://scialert.net/abstract/?doi=itj.2014.2567.2573
INTRODUCTION
Math education plays a very important role in a school’s curriculum because it is a very effective tool for learning other subjects. It is also an important tool for training the logical thinking abilities and judgment skills of the students. Math education is not only an important part of a person’s life skills but it is also important for the forming of a full personality and development of individual potential. The vocational studies teach the applied sciences and technologies and therefore, look to mathematics as the foundation of learning. Even more important is that mathematical thinking is built upon the expansion of the applied sciences. Therefore, an important factor for the success or failure of vocational schools to produce basic level skilled talent is the quality of math learning. Hsu (2001) has pointed out that Taiwan’s education system is based around testing for the next level and math is usually force fed to the students who can only passively accept the knowledge that the teacher is passing on as scripture. With the passing of time, the pressure of tests and the frustration of grades can cause the students to feel helpless in their studies. They start to dislike and fear math. Therefore, in order to help students learn math other than memorizing knowledge and experience, it is even more important to constantly be aware of the student’s learning progress and obstacles. In this way, opportune assistance can be given at the right time to help students gain a sense of accomplishment and confidence in their math studies. For this study, the Hierarchical Linear Models (HLM) was used to analyze the growth locus of vocational students learning math, the moderating effects of students from different departments and genders were also explored in regards to their math performance.
RELATED FACTORS INFLUENCING STUDENTS’ MATH LEARNING PERFORMANCE
For this study, the different factors were categorized which influence the learning performances of students. One of these categories was to consider the different people, concepts and objects involved in the teaching process as inherent learning factors. Hengdeng Huang believed that there are certain factors that are not part of the teaching experience but that, nevertheless, influence the behavior and attitude of the students and teachers. These factors include the home environment, peer groups, social atmosphere etc. They are called external learning factors (Chia, 1995). In a classroom, the teaching assistant plays many important roles including leader, caring mother and strict father. They play these roles in order to guide the students in taking part in the different learning activities. Lee (2012) is of the opinion that the effectiveness of a teacher’s teaching will influence the personal characteristics of the students which, in turn, influences their learning performance. Therefore, most parents hope that their children will be able to be taught by very strict math teachers so that they will have better performances in their math learning. Some people learn out of a thirst of knowledge, others do it for fun, some do it to appease their parents and teachers and still others have absolutely no interest in learning. Zhang (2001) pointed out that the motivations for hobbies and learning are closely related. Lin and Kuo (2006) believed that from a psychological perspective, the word hobby or interests is not that much different from motivation, they can both be viewed as an internal factor that guides an individual’s actions. Yu (2007) pointed out that the learning motivations and abstract logical thinking ability of high school students have a big influence on their math learning performance. Additionally, the gender difference of students is an innate genetic factor which leads some people to stereotype the learning tendencies of students according to their gender. For example, many people think that have a better grasp of special relationships and numbers while girls perform better in areas of language. There was no difference among intelligence of the two genders (Chia, 1995) but from looking at academic performance tests, girls perform better than boys in elementary school. After elementary school, the advantage that girls have in the area of language studies disappears and the advantage that boys have in the math arena continues to grow (Zhang, 2001). From this, we can gather that young student’s learning effectiveness is subject to both the effects of “gender” and “situational theme”. Yeh (2012) believed that this phenomenon shows that that the difference in the abilities of the two genders begins to show itself in the junior high school phase. Therefore, this study takes an interest in whether or not gender plays a role in the difference of math learning performances.
MATERIALS AND METHODS
Theoretical foundation of the HLM growth model: Behavioral science researchers have always lacked an effective method when dealing with research of the individual. Bereiter (1963) pointed out that, to this day, many quantified research regarding individual growth continues to be problematic. These methodology problems have resulted in a conflicting dilemma between research design and analysis; on one hand, there are positive expectations but on the other hand, this can result in the misleading of the direction of the study. Rogosa et al. (1982), Rogosa and Willett (1985) and Willett (1988) have already solved a lot of incorrect concepts. Raudenbush (2001) performed a review of these problems and their recent developments. The development of the hierarchical linear model provided a powerful methodology system of research regarding individual variance. By applying several effective measurements from different points in time, these models will provide the structure of individual growth research and the variables that it predicts with a method of integration. Many individual variance phenomena can be represented by using a two-level hierarchical model. In the first level, the development of each individual can be expressed by using the individual growth locus determined by a set of unique parameters. These individual growth parameters are the resulting variables of the level-2 model. It is derived from certain individual level characteristics (Raudenbush and Bryk, 2002). Assuming Yti that is the growth locus of a system or the growth curve with an added random error function. Yti represents the conditions that the individual (i) observes at the time (t). If the changes in a system can be expressed as a P-degree polynomial as it progresses through time, then it is more convenient. The level-1 model can be expressed as:
 |
where, I = 1,…., n are different individuals, ati is individual (i)’s age at the time (t), πti is the function P of the growth curve corresponding to individual (i), it is attached to the polynomial ordinal P (P = 0, …, P). The time in which each individual is observed is represented by Ti. The amount and frequency of measurements among different individuals may be different. Most circumstances assume that eti has a simple error structure or in other words, that every eti error is independent and it follows the normal distribution when the mean is 0 and the variance is the constant σ2. An important quality of this equation is that the growth function is different among individuals. Because of this, we created the level-2 model to represent this change. To put it in more concrete terms for every growth function of P+1 individual with measures of the background characteristics of the individual (such as gender or social standing) or the experimental group (such as the class categories or teaching evaluation):
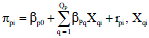 |
where, βpq is the effect of the growth function, rpi is the random effect when the mean is 0.
Samples: The subject of this study is senior high school students attending a business administration public vocational school in central Taiwan. The students attended our math review course, participated in the 2011 joint college entrance exams and were tested over 9 months by us 5 at different times. There were 191 students who took part in the examinations, after unsuitable samples were eliminated, there were a total of 191 effective samples (54 males, 137 females, 116 commerce division students, 75 international trade students). The migration of training to maintain the locus can be seen as multi-level data. In this scenario, the observational data of an individual is nested into the same individual, which forms two-level data. Therefore, we used an HLM model to analyze the growth conditions of individual’s data (Hox, 2002).
For our math review courses, we used the B section of the version 95 high school math text book approved by Taiwan’s Ministry of Education as a course plan. The math learning courses were divided up into 4 units: The first unit was Cartesian coordinates, trigonometric functions and their solutions; the second unit was mathematical operations, exponents and logarithms, linear equations and linear inequalities; the third unit consisted of circles, determinants, series and vectors; the fourth unit consisted of arrangements and combinations, probability and statistics. The school arranged for the students to have 4 h of math class time a week, the progress of the courses was set to match the content of the mock examinations. The mock examinations were given at intervals of 1.5 months. The examination content consisted of section B content including: The first examination was on the first unit; the second examination was on the first and second units; the third examination was on the first through third units; the fourth examination was on the firs through fourth units; the fifth examination was on the first through fourth units. The math results of each examination were used as analysis data.
Hypotheses: Each students’ change in performance over time was tracked in order to explore the learning conditions of the students. With the information given above, we used HLM to analyze the individual progress data and propose 3 assumptions to perform our analysis:
| • | H1: Growth locus of math performance maintained after the students participated in review classes showed a quadratic curve trend |
| • | H2: Math performance by students of different departments would show a moderating effect in its growth locus |
| • | H3: Math performance by students of different genders would show a moderating effect in its growth locus |
RESULTS
Null model: In order to perform HLM growth analysis, it is imperative to first evaluate the inter-level effects. In other words, there must be a significant difference in the variant components of the individuals themselves and other individuals in order to take the next step of intercept and lope analysis. The null model used in this study was level-1 as (2) and level-2 as (3):
 |
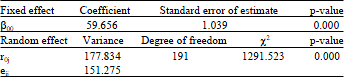
As for fixed effect, the mean β00 of the initial state of this null model, as showed in Table 1, was 59.656 and the average standard error of the overall math performance was 1.039 with a significant effect (p<0.001). This result reflected that the average significance of the initial conditions of the student’s math performance at different phases was 0, which represents that the learning process had an influence on the student’s math performance. As for random effects, the variance Var(roi) = τ00 of the initial state among student’s math performance was 177.834. The Chi-square value test of the random error variance reached standards of 0.001 and above showing that the math performance of each student during the different phases displayed significant variance between other individuals. The variance of individuals was 151.2759, which satisfies the requirements for variant components between individuals themselves and other individuals as a dependent variable in the growth model analysis of HLM. When taking a close look, we see that the relationship number ρ (ICC) of the group itself was 0.54, which means that this study had 54% of variance existing between different individuals. According to Cohen (1988), this qualifies as having a high degree of linkage (p 0.138) and therefore, it should not analyzed using a regression model (Conway et al., 1991). From the null model, we can see that there was a relatively high amount of variance between individuals when it came to their math performance.
| Table 1: | Null model |
 | |
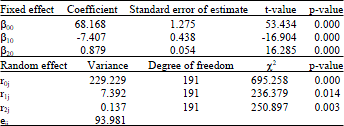
| Table 2: | Unconditional quadratic growth model |
 | |
According to the results of null model analysis, we continued to perform growth model tests.
Unconditional quadratic growth model: For the next step in this study, we performed unconditional quadratic growth model testing. This model is used to test whether the math performance of individuals displayed a quadratic curve growth trend in order to see whether or not assumption H1 can be established. The quadratic growth model can be written as level-1(4) and level-2 (5):
Math performanceti = π0i+π1i (timeti)+π2i (timeti)2+eti
Where:
π0i = β00+r0i
π1i = β10+r1i
π2i = β20+r2i
As for fixed effects from looking at the quadratic growth model data, as shown in Table 2, the initial state average β00 is 68.168 and the overall math performance standard deviation is 1.275. The test of the t-value reached a significance level of 0.01 which means that the average initial state of all of the student’s math performance at different stages had a significance of 0. The square growth rate average β10 is -7.407 and the t-value tested at a significant standard or 0.01. The quadratic acceleration mean β20 was 0.879 and t-value tested at a significant standard of 0.01. From these two parameters, we can see that the significance was not 0 which means that its existence was essential. When the regressive data of the dependent variables of the quadratic curve relationship show a negative square linear effect and the quadratic acceleration effect is positive, then we can know that the growth curve condition of the dependent math performance variable showed a trend of going down at the beginning and then an accelerating rise (Raudenbush and Bryk, 2002). Therefore, the data of this study showed that when the quadratic curve effect showed a positive significant standard (β20 = 0.879) and the linear effect showed a negative significant standard (β10 = -7.407) that the students math performance would display the form of a decreasing then increasing U-shape. As for random effects, the initial state variance r0i of variance conditions of the mean growth locus of the math performance of individual students was 229.229. The Chi-square value test of the random standard deviation showed a value of 0.01 and above significance level, which mean that the initial state of math performance among individual students showed the existence of significant variance. Therefore, it is necessary to consider the influence of other variables on the initial state of math performances. The linear growth acceleration variance r1i of each student was 7.392. The Chi-square value test of random deviance variance showed a value of 0.01 or higher significance level which means that the influence of learning time on the math performance was different for each student. The quadratic acceleration effect variance r2i for each student was 0.137. The Chi-square value test of random deviance variance showed a value of 0.01 or higher significance level which means that there was a difference between individuals for how the amplitude of acceleration effect influenced the math performance of students.
Full model: From the unconditional quadratic curve growth model, we can describe that the curvature and intercepts of different individuals show the existence of significant variance. Therefore, for this study, we took it a step further by analyzing whether or not the variant components of the curvature and intercept can be explained using the math performance of the individual levels in order to test whether assumption H1 can be verified. The math performance of the full model analysis can be written as level-1 (6) and level-2 (7).
Level 1:
Math performanceti = π0i+π1i (timeti)+π2i (timeti)2+eti
Level 2:
π0i = β00+β01 (departmentsi)+β02 (gendersi)+r0i
π1i = β10+β11 (departmentsi)+β12 (gendersi)+r1i
π2i = β20+β21 (departmentsi)+β22 (gendersi)+r2i
From the fixed effect data, as shown in Table 3, the mean β00 of the initial state of the overall math performances was 66.5873. The standard deviation of mean math performances was 1.660 and the t-value test showed significant value of 0.01. This means that the mean significance of the initial state of math performances by the students was 0. The square β10 and quadratic β20 time variance of the t-value test of the math performances showed a significance level of 0.01.
| Table 3: | Full model |
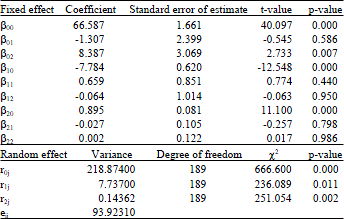 | |
This means that the significance of the two variables was not 0 and that their existence was imperative. As for random effects, the variance of the mean initial state of the students was 218.874 and the Chi-square value test showed a significance level of 0.01 which means that there is a significance variance in the initial state of math performance among the individual students. The variance of the growth acceleration of the students was 7.737 with a Chi-square value significant level of 0.01 which means that there was significant variance of linear growth acceleration between the math performances of the individual students. When the growth acceleration variance of the students was 0.143 and the Chi-square value significant level was 0.01, there was a significant level of variance in the growth acceleration of math performances of the individual students. An analysis of the fixed effect data of the explanative variables (level-2) shows that a significant variance was not reached between students of different departments after taking part in math learning, β01 = -1.307 (p = 0.586>0.05), there was a significant variance in the math performances between different genders after taking part in math learning, β02 = 8.387 (p = 0.007<0.05). Males showed an increase of 8.387 points when compared to females after participating in math learning. With the square and quadratic time variables factored, there was no significant variance between different genders and different departments of students in their math performance. However, the corresponding variant components showed that:
(τ11 = 7.737, χ2 = 236.089, df = 189, p<0.05
τ22 = 0.14362, χ2 = 251.054, df = 189, p<0.05)
which means that there is still other individual level variables not taken into acount by this study that influenced the curvature.
DISCUSSION
Growth locus of math review classes: Baldwin and Ford (1988) training migration pattern as well as Rubin and Wenzel (1996) forgotten curve studies, all are of the opinion that after taking part in training individuals that the amount of retained training that is forgotten, if there is no intervention displays a quadratic curve that first drops and then maintains a certain amount of training effectiveness. The maintained migration of growth locus tests of the 5 examinations of different time periods showed that the trend of math performance was a growth curve that first went down and then rapidly rose in a quadratic curve pattern. This means that the falling quadratic linear model can predict the migration maintenance locus of math learning. Therefore, this study showed that assumption H1 was at least partially supported. These results are in alliance with the forgotten curve and training migration maintenance curve studies of previous scholars (Baldwin and Ford, 1988; Rubin and Wenzel, 1996; Conway et al., 1991). In summation, the amount retained by students who took part in the math review courses should a trend of first falling after which they rapidly rose. This study found that students felt very confident in the beginning stages of the math review classes and had great enthusiasm which led to exceptional learning results. But with the passing of time, the effects drastically dropped with the reaching of a learning plateau, the learning effectiveness of not significant. At this stage, if the school or teacher is able to stimulate or encourage the students in their learning, the student’s math learning performance will rapidly rise again.
Moderating effects maintained by the locus of different groups participating in math review classes: With this study results, we found that during the math review, there was significant intercept predictive effects when using the full model and that the math learning used by individuals during the review classes could predict the future scores of the math review. However, statistic tests found that “different genders” does not have an influence on the moderating effect of the maintained locus of individual math performance. This study showed that assumption H2 was not supported by the data. We also found that “different genders” does not have an influence on the moderating effect of the maintained locus of individual math performance which means that assumption H3 was not supported by the data. This shows that there are still other moderating factors that were not considered in this study which remain to be explored in the future.
RECOMMENDATION AND RESTRICTIONS FOR EDUCATIONAL INSTITUTIONS
As for the migration maintenance locus in improving the effectiveness of math performance in vocational high school students, aside from holding math review courses, other related activities should be actively interjected in order to maintain math learning effectiveness. From literature review, we know that the individual’s definition and evaluation of abilities are the key influence in their learning effectiveness (Elliot and McGregor, 2001; Pintrich, 2000a, b). Many researchers also found that the game elements and related concepts have strongly impressed people and can help learners to improve both the learning motivation and effectiveness (Chen et al., 2010). Therefore, if you want to reduce the migration maintenance trending fall, it is important to give them synergistic external motives from related “messages” during classes after they have left the training. This can help the trainee maintain the motivations created by the pursuit of something. So, when a school plans out its classes, it should incorporate math classes into the classes of other subjects as a way of infusing (Swartz and Parks, 1994) math teaching. By taking the logical principals, reasoning skills and theoretical models taught in math class and infusing into other classes, we can expect that the students will be able to retain a higher amount of material learned in their math review classes. In this way, we can not only maintain the math abilities of students in terms of time, we can also continue to give them “messages” of motivation to continue their math learning during the learning process. Therefore, the math classes of vocational high schools should be planned out so that the student’s math training education can push the students forward in their courses at the appropriate time in order to retain a high level of learning. For example, cloud learning may be a feasible way to help students (Yuan et al., 2013). We recommend that future researchers can use methods of creativity training camps to carry out random assigning of samples in order to control the possibility of the study’s internal effectiveness being corrupted by the sample characteristics causing biases in the study results.
REFERENCES
- Chen, J.H., D.T. Ku, T.H. Wang, W.C. Chang and T.K. Shih, 2010. Using adventure game to facilitate learning assessment process. J. Convergence Inform. Technol., 5: 126-134.
Direct Link - Willett, J.B., 1988. Questions and answers in the measurement of change. Rev. Res. Educ., 15: 345-422.
Direct Link - Conway, M.A., G. Cohen and N. Stanhope, 1991. On the very long-term retention of knowledge acquired through formal education: Twelve years of cognitive psychology. J. Exp. Psychol.: General, 120: 395-409.
CrossRefDirect Link - Pintrich, P.R., 2000. Multiple goals, multiple pathways: The role of goal orientation in learning and achievement. J. Educ. Psychol., 92: 544-555.
Direct Link - Elliot, A.J. and H.A. McGregor, 2001. A 2 × 2 achievement goal framework. J. Personal. Soc. Psychol., 80: 501-519.
CrossRef - Rubin, D.C. and A.E. Wenzel, 1996. One hundred years of forgetting: A quantitative description of retention. Psychol. Rev., 103: 734-760.
CrossRefDirect Link - Rogosa, D., D. Brandt and M. Zimowski, 1982. A growth curve approach to the measurement of change. Psychol. Bull., 92: 726-748.
CrossRefDirect Link - Rogosa, D.R. and J.B. Willett, 1985. Understanding correlates of change by modeling individual differences in growth. Psychometrika, 50: 203-228.
CrossRefDirect Link - Pintrich, P.R., 2000. An achievement goal theory perspective on issues in motivation terminology, theory and research. Contemp. Educ. Psychol., 25: 92-104.
CrossRefDirect Link - Raudenbush, S.W., 2001. Comparing personal trajectories and drawing causal inferences from longitudinal data. Annu. Rev. Psychol., 52: 501-525.
CrossRefDirect Link - Baldwin, T.T. and J.K. Ford, 1988. Transfer of training: A review and directions for future research. Personnel Psychol., 41: 63-105.
CrossRef - Yuan, Z., M.Y. Feng and S.J. Yan, 2013. The building of intelligent distance learning system based on cloud computing. Adv. Inform. Sci. Serv. Sci., 5: 388-396.
Direct Link