
H. Abdul Halim
1Fakulti Sains Pertanian dan Makanan, Universiti Putra Malaysia, Kampus Bintulu,
Jalan Nyabau, P.O. Box 396, Sarawak, Malaysia
H.A. Jumaat
Pusat Pengajian Sains Sekitaran and Sumber Alam, Universiti Kebangsaan Malaysia,
43600 Bangi Selangor, DE
M.A. Juhari
Pusat Pengajian Sains Sekitaran and Sumber Alam, Universiti Kebangsaan Malaysia,
43600 Bangi Selangor, DE
A.R. Sahibin
Pusat Pengajian Sains Sekitaran and Sumber Alam, Universiti Kebangsaan Malaysia,
43600 Bangi Selangor, DE
Hafiza A. Hamid
Pusat Pengajian Sains Sekitaran and Sumber Alam, Universiti Kebangsaan Malaysia,
43600 Bangi Selangor, DE
Ramlan Bin Omar
Pusat Pengajian Sains Sekitaran and Sumber Alam, Universiti Kebangsaan Malaysia,
43600 Bangi Selangor, DE
Gire Kibe Gopir
Pusat Pengajian Sains Sekitaran and Sumber Alam, Universiti Kebangsaan Malaysia,
43600 Bangi Selangor, DE
Jumat Salimon
Pusat Pengajian Sains Sekitaran and Sumber Alam, Universiti Kebangsaan Malaysia,
43600 Bangi Selangor, DE
Barzani Qasim
Pusat Pengajian Sains Sekitaran and Sumber Alam, Universiti Kebangsaan Malaysia,
43600 Bangi Selangor, DE
Information Technology Journal
Year: 2006 | Volume: 5 | Issue: 4 | Page No.: 668-672


ABSTRACT
A study integrating remote sensing and Geographical Information System (GIS) was carried out in the Kuala Terengganu district, Terengganu, Malaysia to map and determine the land use change as a result of development pressure in the area. Two sets of Landsat Thematic Mapper (TM) dated 31 July 1988 and 14 July 2002, at scale 1: 150 000 were acquired. Land use classes were interpreted from these images and the resultant maps were checked in the field to determine ground truth and mapping accuracy. The land use map data were transferred directly into the computer via ILWIS (Integrated Land Water and Water Information System) version 3.1 software. It shown that in this study seven categories of land use changes were detected namely forest (-9.93%), agricultural (-1.46%), swamp (-36.92%), urban (190.29%), cleared land (-21.43%), water bodies (-7.48%) and bush/shrub (6.34%). The accuracy assessment undertaken showed that the total accuracy for produced the map is 77.89%. This study showed that Landsat TM is a useful data for study in land use change.
PDF Abstract XML References Citation
How to cite this article
H. Abdul Halim, H.A. Jumaat, M.A. Juhari, A.R. Sahibin, Hafiza A. Hamid, Ramlan Bin Omar, Gire Kibe Gopir, Jumat Salimon and Barzani Qasim, 2006. Detection of Usefullness of Integrating Remotely Sensed Data (Landsat TM) with GIS. Information Technology Journal, 5: 668-672.
DOI: 10.3923/itj.2006.668.672
URL: https://scialert.net/abstract/?doi=itj.2006.668.672
DOI: 10.3923/itj.2006.668.672
URL: https://scialert.net/abstract/?doi=itj.2006.668.672
INTRODUCTION
Remotely sensed data and geoinformatics give a revolution in research of agriculture, land, water and marine resources and geomorphology. Remotely sensed data offers the researcher to facilitate the investigations, assessments and they may lead to a more understanding of sustainable development.
The remote sensing techniques have proven useful for gathering information about the natural resources on a large-scale basis, such as for a whole country. The Malaysian Ministry of Agriculture has been using aerial photo interpretation for land use mapping for Peninsular Malaysia. With its aggressive land development policy, there is great need for timely information on the agricultural and forestry resources of the country (Mout et al., 1993). Land use concerns the function or purpose for which the land is used by the local human population and can be defined as the human activities which are directly related to land, making use of its resources or having an impact on them (FAO/IIASA, 1993). The terms land use and land cover is not synonymous. Land cover is the biophysical state of the earth’s surface and immediate subsurface" (Turner et al., 1995).
Land use mapping in an area can be done using Landsat Thematic Mapper (TM). Landsat TM has an ability to make an assessment for vary land use classes and land covers such as water body, forest, agricultural area, main road and urban area. According to Scepan et al. (1999) the most useful band combination in Landsat TM for discriminating the land cover categories were 4-5-3, 4-3-2 and 3-2-1 in red, green and blue (R-G-B) respectively. Mapping the land use change is using post-classification comparison, aiming to find out the difference between the classified images of two different dates (Lillesand and Kiefer, 1994).
The objective of this study was to assess the usefulness of integrating remotely sensed data (Landsat TM) with GIS for detection of land use change. The specific objectives were to quantify and map the land use change in the Kuala Terengganu district, Terengganu, Peninsular Malaysia between 1988 and 2002.
MATERIALS AND METHODS
Study sites: The study area located at Kuala Terengganu (within latitudes 5° 10' U to 5° 31’U and longitudes 102° 52° E to 103° 12' E, Malaysia, Terengganu, east peninsular Malaysia (Fig. 1).
 | |
| Fig. 1: | A map showing the state of Terengganu and study area in Kuala Terengganu district |
 | |
| Fig. 2: | Methodology flowchart of the study |
Kuala Terengganu consists of 22 mukim including Mukim Batu Rakit, Belara, Kuala Nerus, Manir, Serada, Kepung, Rengas, Kubang Parit, Chabang Tiga, Losong, Pulau-pulau, Kuala Terengganu (bandar), Batu Buruk, Kuala Ibai, Chenering, Pengadang Buloh, Gelugor Kedai, Gelugor Raja, Atas Tol, Atas Tol, Bukit Besar and Tok Jamal. The total area is 67629 ha. Initially, it was decided that the study area cover the whole Kuala Terengganu. Instead a part of Belara and Batu Rakit was unavailable at time of the study and only 60547 ha were covered for the study site. The land use mainly composed of forest, oil palm, rubber, cleared land, mixed horticulture, homestead garden and villages. Kuala Terengganu was chosen as study area due to rapid conversion of agricultural land occurring in the region.
Climate: Kuala Terengganu has a hot, humid tropical climate. Temperature and rain fall are generally high throughout the year. The mean annual temperatures vary from 25 to 28° and mean rainfall exceeds 2000 mm (MMS, 2000).
Imagery: The primary data used in this study were Landsat TM dated 31 July 1988 and 14 July 2002 (path /row: 126/56) acquired in CD-ROM format from the Malaysian Center for Remote Sensing (MACRES), Kuala Lumpur.
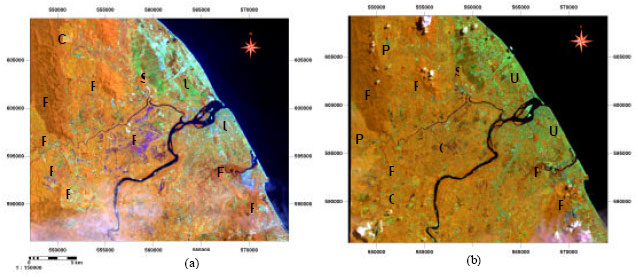 | |
| Fig. 3: | Subset of study area showing band combination of Landsat TM of (a) 1988 and (b) 2002 using bands 4, 5, 3 in R-G-B respectively and training area |
The images were geometrically and radiometrically corrected by MACRES (2002).
Ancillary data: Additional data were obtained from Department of Agriculture and Department of Forestry, Terengganu. The ancillary data used were:
| • | Topographic map (Series L7030, Ed. 2-PPNM) Sheet 4266, 4265 and 4365 scale 1: 50 000. |
| • | Development map of Kuala Terengganu District. |
Hardware and software: The hardware used for this study was digitizer, a computer and a printer. The GIS software used was Arc-View version 3.1. For the image processing, ILWIS (Integrated Land Water and Water Information System) version 3.1 was used. A hand held global positioning system GPS was used for the positioning of ground truth.
Methodology: The technique used in this study included image enhancement such as contrast enhancement and band combination. Visual interpretation was applied to categorized the different land use classes on the images. The ILWIS version 3.1 was used to analyze using supervised classification (maximum like hood). Figure 2 shows the methodology flow chart of the study. A band combination of 4, 5, 3 (Fig. 3) was selected and printed for the hard copy scale 1:150 000.
RESULTS AND DISCUSSION
Visual interpretation technique, enable us to classify the land use classes in the study (Fig. 4). The land use change, from their total area and magnitudes of change in 1 988 and 2002, are shown in Table 1 . It shown that in this study seven categories of land use changes were detected namely forest (-9.93%), agricultural (-1.46%), swamp (-36.92%), urban (190.29%), cleared land (-21.43%), water bodies (-7.48%) and bush/shrub (6.34%).
It is evident that the agricultural area and forest were the most dominant land use types. Their total areas were 48.01 and 17.37% in 1988. Swamp area, cleared land, water bodies occupied 7907, 1,259 and 1,591 ha, respectively in 1988. In 2002, the agricultural and forest area are 47.66 and 15.65%. Swamp area, cleared land and water bodies occupied 4987.52, 989.24 and 1472.00 ha in 2002.
The land use that has highest magnitude of change from 1988 to 2002 is urban area, increasing 190.29%. That can be concluded this area is changing over time to urban area. Some plantation area has been changed such as rubber to palm oil estate within 14 years.
Accuracy assessment is general term for comparing the known reference data from ground truth and the corresponding result of classification accuracy. The identification accuracy check by sample point summarized in Table 2.
| Table 1: | Land use classes and magnitude of change in Kuala Terengganu district in 1988 and 2002 |
 | |
| Table 2: | Accuracy check by sample points of visually interpreted 1988 and 2002 satellite images |
 | |
 | |
| Fig. 4: | Land use maps of the Kuala Terengganu district: (a) 1988 dan (b) 2002 |
This assessment has to make because some of the images are covered by cloud and could not be processed. So some point should be checked for the accuracy.
Ground verification showed that the total overall map accuracy was 77.89%. This percentage gained by dividing total overall point correct and total point observes. However there were sample points that were misclassified. The misclassified was probably because of the prominent cloud cover and similar reflectance of some land uses on the image.
ACKNOWLEDGMENTS
We wish to thank the following: University Kebangsaan Malaysia (ST011-2002), Malaysian Government and Research Development Grant (EAR0902020090EA233) for their financial support; MACRES for the satellite images, University Kebangsaan Malaysia and University Putra Malaysia for their permission to complete the digitizing work in their laboratory; all related state and federal state Government agencies in Terengganu directly or indirectly involved in the project particularly the Forest Dept., Agriculture Dept, Water and Drainage Dept.
REFERENCES
- Lillesand, R.M. and R.W. Kiefer, 1994. Remote Sensing and Image Interpretation. 3rd Edn., John Wiley and Sons, New York, ISBN: 978-0-471-15227-9, pp: 532-561.
Direct Link