
H.S . Sheshadri
Department of Electronics and Communication Engineering, PSG College of Technology, Coimbatore-641004, Tamilnadu, India
A . Kandaswamy
Department of Electronics and Communication Engineering, PSG College of Technology, Coimbatore-641004, Tamilnadu, India
Information Technology Journal
Year: 2006 | Volume: 5 | Issue: 2 | Page No.: 342-346


ABSTRACT
This study deals with a novel approach for the development of a Computer Aided Diagnosis (CAD) system for mammogram image analysis. Now a days a CAD system is playing vital role in the visual inspection of mammogram images and for the detection of breast cancer at an early stage.Here the authors have made an attempt to implement a CAD system for the detection of microcalcifications from a mammogram image segmentation and analysis. The system is implemented over a PC with the most common environment and also the algorithm used is easy and simple for any radiologist to take clear decision
PDF Abstract XML References
How to cite this article
H.S . Sheshadri and A . Kandaswamy, 2006. Computer Aided Diagnosis of Digital Mammograms. Information Technology Journal, 5: 342-346.
DOI: 10.3923/itj.2006.342.346
URL: https://scialert.net/abstract/?doi=itj.2006.342.346
DOI: 10.3923/itj.2006.342.346
URL: https://scialert.net/abstract/?doi=itj.2006.342.346
INTRODUCTION
Breast cancer is a leading cause of cancer deaths among women. For women in Norway and in the other developed countries, it is also the most frequently diagnosed cancer. About 2100 new cases of breast cancer and 800 deaths are registered each year in Norway[1]. Early detection is the most effective way to reduce mortality and a screening program based on X-ray examination of the breasts, mammography, is currently the best method for early detection. An increasing number of countries have started mass screening programs that have resulted in a large increase in the number of mammograms requiring interpretation. In the interpretation process radiologists carefully search each image for any visual sign of abnormality. However, abnormalities are often embedded in and camouflaged by varying densities of breast tissue structures. Indeed, estimates indicate that between 10 and 30% of breast cancers are missed by radiologists during routine screening[2,3]. In order to improve the accuracy of interpretation, a variety of Computer-Aided Diagnosis (CAD) systems have been proposed[4-10]. This study proposed CAD subsystems designed for the detection and classification of clustered micro calcifications (Fig. 1). By detection we mean extracting the clustered micro calcifications from the local background breast tissue. In the world of image processing this is known as image segmentation. Once the clusters have been extracted, we can categorize them as benign or malignant. This is known as image classification. Clustered micro calcifications are one of the earliest signs of potential cancerous changes in breast tissue.
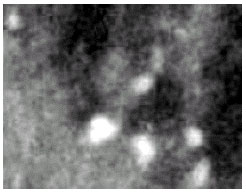 | |
| Fig. 1: | An image of a cluster of micro calcifications |
A microcalcification is a small calcium deposit that has accumulated in breast tissue and it appears as small bright spot on the mammogram.
A cluster is typically defined to be at least 3 micro calcifications within a 1 cm2 region of the mammogram. Individual micro calcifications typically range in size from 0.1-1.0 mm (in mammograms), implying that they can easily be overlooked by an examining radiologist. The main goal was to make contributions to a CAD system which can provide a second opinion to radiologists on a routine clinical basis. The term second opinion means that the radiologists can use the results of a computer analysis of the mammogram in making a diagnosis. However, the final diagnostic decision and recommendations for appropriate patient treatment are made by the radiologists.
COMPUTER BASED ANALYSIS
Figure 2 shows a block diagram for an automated system for detection of clustered micro calcifications in digital mammograms.
 | |
| Fig. 2: | Block diagram of proposed CAD system |
Note that the block diagram is also valid for the classification of clustered micro calcifications as benign or malignant. In that case the input to the system will be a Region of Interest (ROI) containing a detected cluster instead of a whole mammogram. The present research focused on the feature extraction from which we can detect the micro calcifications from the mammogram under consideration.
Feature extraction: A mammogram contains a large amount of heterogeneous information; different tissues, vessels, ducts, breast edges, film and X-ray machine characteristics. Reliable features should reduce the amount of irrelevant information and produce robust mammogram descriptors for a specific task. The main goal of present study was to develop feature extraction schemes having the following properties.
To generate features which have the ability to segment the mammograms into two classes: Clusters of micro calcifications and normal tissue. In this study, we define the class normal tissue as the one representing all information in a mammogram that are not micro calcifications.
To generate features which can be used in the discrimination between benign and malignant clusters of micro calcifications. Variations within the limits of normality of breast tissue pose the basic obstacle in achieving these goals. Micro calcifications may be very subtle, be of low contrast and have hazy borders. As a consequence, micro calcifications are frequently less visible than the variations in the normal tissue. The highly textured regions of breast tissue in mammograms dictate the selection of methods that are successful in dealing with texture regions, i.e texture analysis methods and prevents the selection of simpler image segmentation methods, such as edge detection[11]. The term texture is used to characterize important characteristics of the surface of a given object and it is one of many important features used in computer vision and pattern recognition. However, in spite of its importance a precise definition of texture does not exist. Haralick and Shapiro[12] consider texture as an organized-area phenomenon described by two basic characteristics: The first characteristic is concerned with the gray level primitives or local characteristic is concerned with the spatial organization of the gray level primitives.
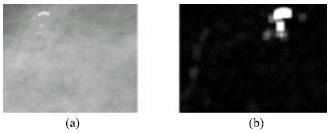 | |
| Fig. 3: | A sub image (1024 x 1024 pixels) from the mammogram mdb219ll containing A benign cluster of micro calcifications (a) and its feature image (b) |
Sklansky[13] suggested another definition: A region in an image has a constant texture if a set of local statistics or other local properties of the picture are constant, slowly varying, or approximately periodic. In this study we suggest new methods for texture feature extraction in digital mammograms. These methods are based on the use of digital filters-together with a filter response energy measure as texture feature extractors. An approach to texture feature extraction frequently cited in the literature is based on the use of spatial gray level co-occurrence matrices. Co-occurrence matrices are second-order statistical measures of image variation and can be useful in the classification context. In the present work we present a new method which improves the classification performance of the co-occurrence approach. This is achieved by combining the co-occurrence approach and one of the filtering approaches. As an example, Fig. 3 shows a sub image from the mammogram mdb219ll (taken from the Mammography Image Analysis Society (MIAS)[14] database) and its feature image. The feature image is generated by a feature extraction technique based on a single optimal filter. From Fig. 3 we see that this feature extraction technique produce a feature image where one texture (the cluster area) has been transformed to a bright area, while the other texture like the ground (normal) has been transformed to darker areas. Thus, the image can be segmented by using simple thresholding
Micro calcifications: In the original mammograms individual micro calcifications have dimensions between 0.1-1.0 mm. As films are still the most accurate support for mammograms an essential question is the following: What is the right sampling rate to be used to digitize a mammogram? It is generally assumed that a sampling density of 50 x 50 μm is sufficient to provide the shape of individual micro calcifications[15]. Shape is an import not feature in the classification of clustered micro calcifications as benign or malignant.
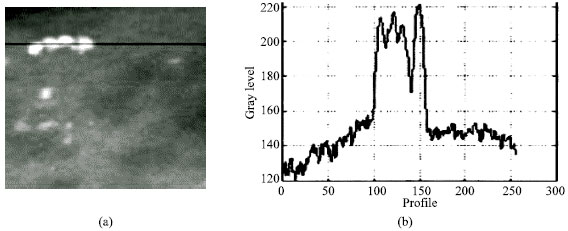 | |
| Fig. 4: | (a) ROI of mdb2191 (b) Gray level profile of the ROI |
As the methods proposed in this work are based on the use of filters an other important question is: What kind of filter should be used and which size, or region of support, should the filters have? A general answer to this question is that the filters and their region of support should be determined according to the characteristics of micro calcifications. So, let us take a closer look at these characteristics. The individual micro calcifications appear as small impulslike spots having a fairly uniform optical density. The shape of the micro calcifications varies from granular to rod-shaped.
However, the average form is roughly circular with a tapered cross-sectional profile. Figure 4 show a small submiage of the mammogram mdb219ll, from the MIAS database[14], containing a very distinct cluster of microclacifications. As can be seen, we have drawn a horizontal line passing through the cluster. Figure 4b shows the gray level profile of this horizontal line. An important thing to note from this profile is that an abrupt change in gray level values occurs in the transition between the microcalcifications and the surrounding tissue. Thus, the applied filters should be able to enhance these structures in the mammograms representing clusters of micro calcifications. Figure 4a: Subimage (256x256) of the mammogram mdb219ll in which a horizontal line has been drawn though the cluster of micro calcifications. Figure 4b: The gray level profile of the line passing through the cluster of micro calcifications in Fig. 4a.
RESULTS AND DISCUSSION
We have considered 50 mammogram images from mini MIAS database for our experiment. Size of each image is of 1024x1024 pixels, 22 containing one cluster of micro calcifications and 28 containing no clusters (i.e. normal tissue only).
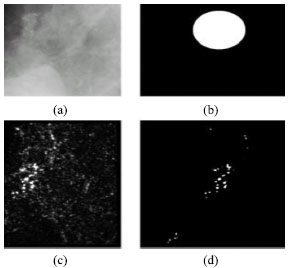 | |
| Fig. 5: | (a) Subimage (1024x1024 pixels) of the mammogrma mdb211 (b): Truth image, (c) Feature image, (d) Thresholded feature image |
All subimages have been selected as ROI to minimize memory constraints. An important characteristic of this database is that each abnormal image comes with a consultant radiologist's truth information, i.e., the locality of the abnormality is given as the coo rdinate of its center and an approximate radius (in pixels) of a circle enclosing the abnormality. From this truth information it is possible to generate binary truth images where the true cluster is represented as a white circular area, called the truth circle.
The scoring method (i.e. how to score true and false detections) should take into consideration the goal of the proposed CAD system. For a detection system, the important issue is to alert radiologists to suspicious areas on the mammogram.
 | |
| Fig. 6: | Performance evaluation of the proposed CAD system |
As long as there is some degree of overlap between the computer detected cluster and the true cluster, the radiologist will discover the true cluster and the system will have fulfilled its purpose. Thus, a true cluster is considered detected if at least one finding is found in the associated truth circle. All findings outside the truth circle are considered as false detections. As an example, in Fig. 5 we show a subimage, its truth image, its feature image and the segmented (thresholded) feature image. From the truth image shown in Fig. 5c we can observe that there are several findings of white portions inside the associated truth circle. Consequently, in this case a true cluster is considered detected. In addition, we can observe some findings outside the associated truth circle. According to our scoring method, these findings are considered as false detections (Fig. 5c and d).
Figure 6 shows a plot of the True Positive (TP) rate as a function of the number of False Positive (FP) detections per image. At a rate of only about 1.5 false positive clusters per image our detection method reaches a TP rate of 100%. Concerning the classification of detected clusters as benign or malignant we achieved an Overall Performance (OP) rate of about 75%. The OP rate is defined as follows:
True Positive (TP) rate: The ratio of the number of malignant cases correctly classified to the total number of malignant cases in the test set.
False Positive (FP) rate: The ratio of the number of benign cases incorrectly classified to the total number of benign cases in the test set.
MC: The number of malignant cases in the test set.
BC: The number of benign cases in the test.
NI: The total number of images in the test set
According to the literature survey about 20-30% of breast biopsy cases recommended by radiologists prove to be of malignant in nature[16], this result shows that our classification method can provide radiologists with a second opinion. Further details can be found in Gulsrud[17].
CONCLUSIONS
In this study we have discussed a CAD system for the detection of micro calcifications in mammogram images. The system uses an ordinary PC with a software package developed using Matlab codes. The system is capable of detecting micro calcifications and hence can be used for early detection of breast cancer. Our future research include the use of statistical method of segmentation of mammogram images based on Gaussian mixture model.
ACKNOWLEDGMENTS
The authors would like to extend their thanks to Dr. Bharath Kumar, Radiologist of Coimbatore Medical Center, Coimbatore for his valuable suggestions and guidance given during the conduction of experiments. Also we thank Dr. Raj Rangayaan, of University of Calgary for providing sufficient information about the database. The authors would like to acknowledge the authorities at the PSG Institute of Medical Sciences and Research, Coimbatore for having extended their facilities to conduct several experiments.
REFERENCES
- Norum, J., 1999. Breast cancer screening by mammography in Norway. Is it cost-effective?. Ann. Oncol., 10: 197-203.
Direct Link - Baines, C.J., D.V. Mc Farlane and A.B. Miller, 1990. The role of the reference radiologist: Estimates of interobserver agreement and potential delay in cancer detection in the national screening study. Investiga Radiol., 25: 971-976.
PubMedDirect Link - Wallis, M., M. Walsh and J. Lee, 1991. A review of false negative mammography in a symptomatic population. Clin. Radiol., 44: 13-15.
PubMedDirect Link - Gulsrud, T.O. and S.O. Gabrielsen, 1995. Classification of micro calcifications using a multichannel filtering approach. Proceedings of 17th IEEE Annual International Conference on Engineering in Medicine and Biology Society, Sept. 20-23, Montreal, Canada, pp: 889-890.
CrossRefDirect Link - Gulsrud, T.O. and S. Kjode, 1996. Optimal filter for detection of stellate lesions and circumscribed masses in mammograms. Proc. SPIE, 2727: 430-440.
Direct Link - Gulsrud, T.O. and E. Loland, 1996. Multichannel filtering for texture feature extraction in digital mammograms. Proceedings of 18th Annual International Conference of the IEEE Engineering in Medicine and Biology Society, Bridging Disciplines for Biomedicine, Oct. 31-Nov. 3, Amsterdam, The Netherlands, pp: 1153-1154.
CrossRefDirect Link - Gulsrud, T.O. and J.H. Husoy, 2000. Optimal filter for detection of clustered micro calcifications. Proceedings of 15th International Conference on Pattern Recognition, Sept. 3-7, Barcelona, Spain, pp: 508-511.
CrossRefDirect Link - Kobatake, H., M. Murakami, H. Takeo and S. Nawano, 1999. Computerized detection of malignant tumors in digital mammograms. IEEE Trans. Med. Imag., 18: 369-378.
CrossRefDirect Link - Netsch, T. and H.O. Peitgen, 1999. Scale-space signatures for the detection of clustered micro calcifications in digital mammograms. IEEE Trans. Med. Imag., 18: 774-786.
CrossRefDirect Link - Gulsrud, T.O. and J.H. Husoy, 2001. Optimal filter based detection of mcrocacifications. IEEE Trans. Biomed. Eng., 48: 1272-1281.
CrossRefDirect Link - Suckling, J., J. Parker, D.R. Dance, S. Astley and I. Hutt et al., 1994. The Mammographic Image Analysis Society digital Mammogram Database. In: Digital Mammography: Proceedings of the 2nd International Workshop on Digital Mammography, York, England, 10-12 July 1994, Gale, A.G., S.M. Astley, D.R. Dance and A.Y. Cairns (Eds.). Excerta Medica, Amsterdam, ISBN: 9780444819161, pp: 375-378.
- Sickles, E.A., 1986. Breast calcifications: Mammographic evaluation. Radiology, 160: 289-293.
PubMedDirect Link