

P. Shanthi
Agricultural Research Station, Pattukkottai, TNAU, Tamil Nadu, India
S. Jebaraj
Agricultural College and Research Institute, Madurai, TNAU, Tamil Nadu, India
S. Geetha
National Pulses Research Centre, Vamban, TNAU, Tamil Nadu, India
N. Aananthi
Rice Research Institute, Ambasamuthiram, TNAU, Tamil Nadu, India
International Journal of Plant Breeding and Genetics
Year: 2012 | Volume: 6 | Issue: 4 | Page No.: 206-216





ABSTRACT
The study was designed to characterize the genetic diversity in a set of rice genotypes with different adaptation to saline soil using microsatellite markers (SSR markers). For this analysis a total of 50 SSR primers across the 12 chromosomes were taken up out of these 50 primers, 37 primers were polymorphic. The average number of alleles per locus was 5.69, indicating greater magnitude of diversity among the plant materials. The average PIC value 0.732 conformed the markers used were highly informative. The cluster analysis grouped the 27 genotypes into nine clusters. Cluster I consisted of nine varieties and all are indica type. Cluster II consisted of three varieties all are salt tolerance. Cluster III consisted of two rice varieties these are tolerant to drought. Cluster IV consisted of seven varieties, which are high yielding varieties. Cluster V consisted of CR1009, which is high yielding variety. Cluster VI consisted of Pokkali and CSR23 both are highly tolerant to salinity. Cluster VII, VIII and IX are mono-clusters consisted of CSR27, CSR10 and Jeeragasamba. The maximum similarity value of 0.786 was observed between the varieties of IR36 and IR64 indicated that these were more closely related. The minimum similarity value of 0.237 was observed between the genotypes IR36 and CSR10 indicated that these two varieties were highly divergent. The varieties possessing high genetic distance value could be utilized for the development of high yielding varieties than the highly closed varieties.
PDF Abstract XML References Citation
Article History
Received: November 03, 2011;
Accepted: February 09, 2012;
Published: June 08, 2012
How to cite this article
P. Shanthi, S. Jebaraj, S. Geetha and N. Aananthi, 2012. DNA Finger Printing of Salt Tolerant and Susceptible Genotypes Using MicroSatellite Markers in Rice (Oryza sativa L.). International Journal of Plant Breeding and Genetics, 6: 206-216.
DOI: 10.3923/ijpbg.2012.206.216
URL: https://scialert.net/abstract/?doi=ijpbg.2012.206.216
DOI: 10.3923/ijpbg.2012.206.216
URL: https://scialert.net/abstract/?doi=ijpbg.2012.206.216
INTRODUCTION
Rice, Oryza sativa L. (2n = 24) belonging to the family graminae and subfamily oryzoidea is the staple food for one third of the world’s population and occupies almost one fifth of the total land area covered under cereals. Almost 91 per cent of the total rice is produced and consumed by Asia which supplies 30-80 per cent of the daily calories consumed (Narciso and Hossain, 2002). To meet out the current Indian rice demand, the Government of India has set up a National Food Security Mission with a target on enhancing rice production by 10 million tones by 2011-12 from the production level of 93 million tonnes during 2006-07. It is therefore a challenging task to achieve this targeted production levels with in the short period of time. In order to meet this target and beyond, there is an urgent need to increase the area under rice cultivation in the salt affected soil too (http://agricoop.nic.in). The most economic and sustained way to overcome the problems of food scarcity and salt stress is to develop salt tolerant varieties. Salinity affects rice growth in varying degrees at all stages starting from germination to maturation (Bhowmik et al., 2007).
Worldwide 800 million hectares of land are affected by either salinity (397million hectare) or by sodicity (343 million ha). In India the salt affected area is around 8.6 million ha of which about 3.0 million ha are coastal saline. Being, rice is having the wide adoptability from submerged condition to hilly areas there is a wide scope for development of salt tolerant varieties through crop improvement programme (Nawaz, 2007). So far conventional breeding methods for salt tolerance have been found ineffective due to the strong environmental effects on genotypic expression and the low narrow sense heritability of salt tolerance (Gregorio, 1997).
Assessment of genetic diversity between parents is the basic before making intercrosses. The knowledge on existing genetic variability is highly essential one for the development of high yielding salt tolerance rice varieties. Genetic variability between the genotypes is usually estimated conventionally by measuring the physiological and morphological differences of quantitative and economically important traits. The disadvantages of this conventional approach are the influences of environmental factors and the cost of labour and time during the measurements (Patra and Chawla, 2010). Conversely, analysis of genetic variations based on DNA polymorphism is abundant and independent of environmental factors. Furthermore, a large sample size is usually required for the evaluation of genotypes when quantitative traits are measured. In contrast, a relatively small sample size can be informative for the evaluation when DNA polymorphisms are analyzed. Therefore, assays for DNA markers may be much less time-consuming and less labour intensive. DNA markers that differentiate genotypes are more reliable and convenient than physiological or morphological characters in the identification and characterization of genetic variation (Ravi et al., 2003; Jain et al., 2004). Of the several av ailable DNA markers the microsatellite or Simple Sequence Repeat (SSR) markers are considered as most amenable for genetic diversity analysis (Sivaranjani et al., 2010). Microsaltellite markers have been effectively used to identify genetic variation among rice cultivars (Garland et al., 1999). Microsatellites are tandemly repeated sequence motifs that are ubiquitously distributed throughout the eukaryotic genome (Toth et al., 2000). More number of microsatellite markets has been already developed in rice and their primer sequences have been published (Temnykh et al., 2000). Employment of microsatellite markers for identification of genetic variation may be useful in addressing agronomic problems such as abiotic stresses. Thanh et al. (1999) have showed that the genetic variation identified by microsatellilte markers to be useful in evaluating upland rice accessions from Vietnam for drought tolerant related traits. Senguttuvel et al. (2010) utilized the Microsatelite markers for genetic diversity analysis and identification of salt tolerant genotypes based on the marker analysis. The objective of this study was to characterize a set of rice genotypes with different adaptation to saline soils for their genetic diversity using microsatellite markers.
MATERIALS AND METHODS
The work was carried out during June 2007 to March 2008, at ADAC and RI, TNAU Tamil Nadu and Biotechnology laboratory of Mahyco Life Science Research Centre, Dawalwadi, Jalna, Maharastra, India.
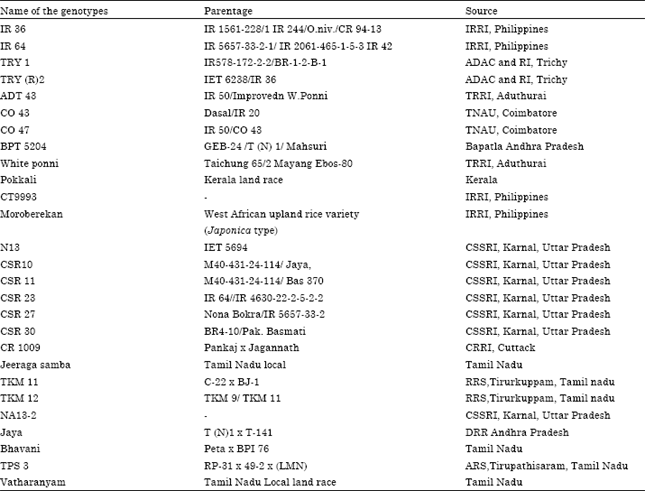
Plant materials: A set of 27 rice genotypes with diversified genetic back ground with different adaptation to salinity were collected from all over India and utilized for this study. The details of the study materials are given in Table 1.
| Table 1: | Details of varieties/land races used as parents |
 | |
DNA markers: The genotypes were screened with 50 different SSR primers (panel 50 primers of http://www.gramene.org) in order to conduct diversity analysis.
DNA extraction and (SSR- Polymorphic Chain Reaction) SSR-PCR analysis: The leaf samples were collected form the ten days old seedlings for DNA extraction. Genomic DNA was extracted according to Dellaporta et al. (1983) with some modification. The concentration of DNA was measured by running the genomic DNA in one per cent agarose gel along with uncut Lambda DNA marker. Based on the concentration the DNA was diluted to the concentration of 50 ng μL-1. PCR reactions were carried out on an Applied Biosystems 2720 thermal cycler. The PCR conditions were maintained as described by Panaud et al. (1996). The reaction mixture was given a momentary spin for thorough mixing of the cocktail components. PCR reaction was carried out on a PTC-100 programmable thermal controller, Gene Amp PCR system 9700.
Poly Acrylamide Gel Electrophoresis (PAGE): The amplified PCR products were separated in six per cent denaturing acrylamide gels containing 7M urea using a DNA sequencing system (Bio rod, Bangalore Gene). After electrophoresis, the plates were separated and the short plate was processed for staining using a silver sequencing system (Promega). The gel was dried overnight at room temperature and scanned by using HP scanner jet 2400.
Statistical analysis of SSR data: Each SSR band was scored as present (1), absent (0) or (9) as a missing observation for each genotype. An accession was assigned a null allele for a microsatellite locus whenever an amplification product could not be detected for a particular genotype-marker combination (Ram et al., 2007). To measure the informativeness of the markers, the polymorphism information content (PIC) for each SSR locus was calculated according to the formula (Weir, 1996):
PIC = 1 – (∑pi2) |
where, 1 is the total number of alleles detected for a SSR marker and pi is the frequency of the ith plus allele in the set of the 27 rice genotypes investigated. The frequencies of null alleles were not included in the calculation of PIC values. Genetic Similarity (GS) between genotypes i and j was estimated by using Jaccard’s coefficient, as described by Sneath and Sokal (1973). Markers with missing observations for genotype i and/or j were not included in the calculation of GSij. Based on the genetic similarity matrix, an Unweighted Paired Group Method of Arithmetic averages (UPGMA) cluster analysis was used to assess the pattern of diversity among the rice genotypes. All calculations were performed by using NTSYS-pc version 2.1software (Rohlf, 2000).
RESULTS
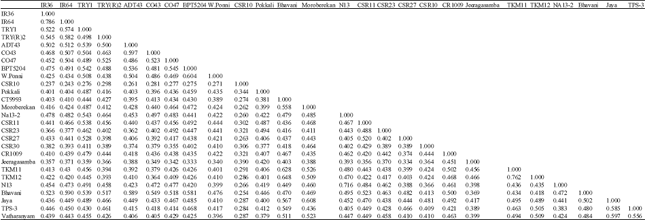
Genetic similarity (GS) and distance between the rice genotypes: Based on the cluster analysis the similarity values are tabulated in Table 2. The similarity values were ranged from 0.214 (IR36 and CSR 10) to 0.786 (IR 36 and IR64). Followed by IR 36 and CSR 10 IR64 and CSR 10 also recorded the less similarity value of 0.243. The higher similarity value of 0.762 was observed between TKM 11 and TKM 12 followed by IR36 and IR 64.
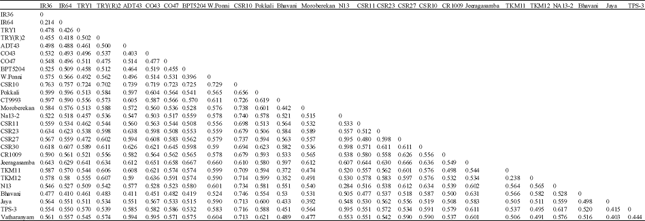
The genetic distance were calculated from the similarity values and tabulated in Table 3. It was ranged between the 0.214 (IR36 and IR64) to 0.763 (IR36 and CSR 10). Followed by IR36 and IR64 the lower genetic distance of 0.238 was observed between (TKM 11 and TKM 12). Followed by IR36 and CSR 10 the higher genetic distance was observed between IR 64 and CSR 10 (0.757).
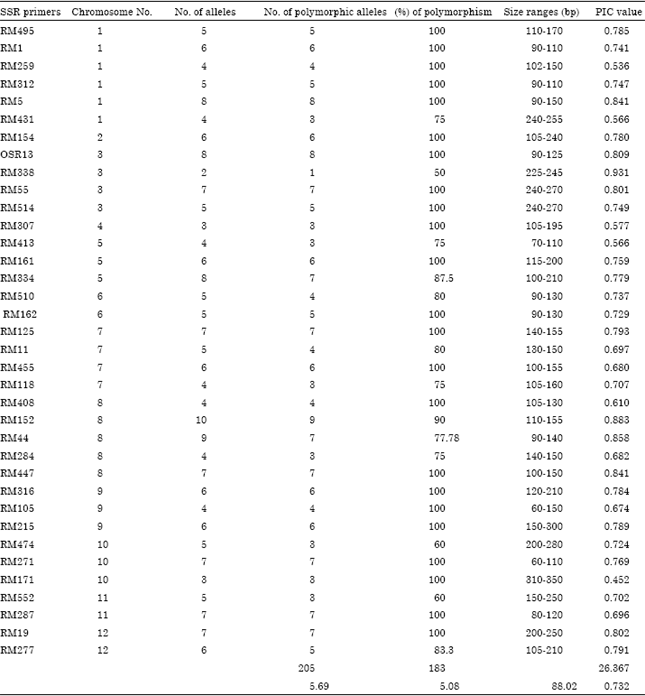
Polymorphic Information Content (PIC): Out of 50 primers used 37 primers were shown polymorphism and 28 primers were 100% of polymorphic (Fig. 1). The percentage of polymorphism ranged from 60% (RM474) to 100 percent (as many as 28 primers) and the average percentage of polymorphism was 88.02. The number of alleles per locus varied from 2 (RM338)-10 (RM152) and the average number of alleles per locus was 5.69. The number of polymorphic alleles were ranged from1 (RM338) to 9 (RM152) and the average number of polymorphic alleles were 5.08. The PIC value range from 0.452 (RM171) to 0.931 (RM338). The average PIC value was 0.732 (Table 4).
Clustering: Cluster analysis was used to group the varieties and to construct a dendrogram (Fig. 2). The similarity matrix representing the Jaccard’s coefficient was used to cluster the data using the UPGMA algorithm (Sokal and Michener, 1958). The Dendrogram revealed the allelic richness of nine clusters of various sizes of which four are mono-clusters at a similarity coefficient level of 4.8 (Fig. 2).
| Table 2: | Similarity coefficient values based on SSR marker data among 27 rice genotypes |
 | |
| Table 3: | Genetic distance among the 27 genotypes as calculated from SSR polymorphic variants |
 | |
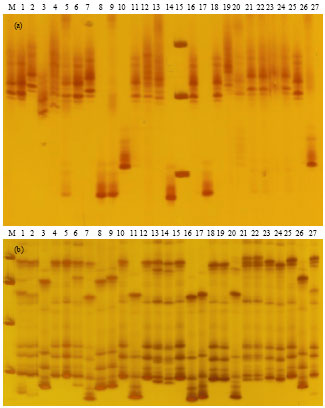 | |
| Fig. 1: | SSR markers profile of 27 rice genotypes generated by the primers RM 1 and 44 |
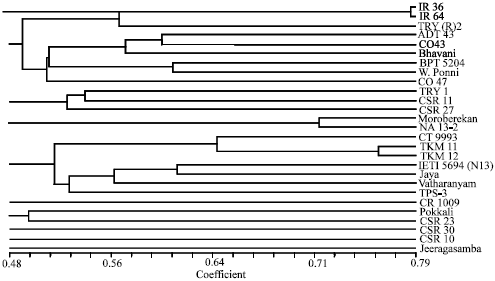 | |
| Fig. 2: | Genetic diversity analysis using SSR markers in rice genotypes |
Cluster I was the biggest cluster having nine varieties viz., IR36, IR64, TRY(R)2, ADT43, CO43, Bhavani, BPT5204, W.Ponni and CO47. Cluster II consisted of three varieties TRY1, CSR11 and CSR27. Cluster III consisted of Moroberekan and NA13-2. Cluster IV consisted of CT9993, TKM11, TKM12 IET15693 (N13), Jaya, Vatharanyam and TPS3. Cluster V consisted of only one genotype CR1009. Cluster VI consisted of Pokkali and CSR23. Cluster VII, VIII and IX are mono-clusters consisted of CSR27, CSR10 and Jeeragasamba, respectively (Fig. 2).
| Table 4: | SSR markers used and their chromosome location, product size, number of polymorphic alleles and PIC values calculated for a set of 27 rice genotypes |
 | |
DISCUSSION
Molecular markers have demonstrated a potential to detect genetic diversity and to aid the management of plant genetic resources (Ford-Lloyd et al., 1997; Song et al., 2003). In contrast to morphological traits, molecular markers can reveal differences among genotypes at the DNA level, providing a more direct, reliable and efficient tool for germplasm characterization, conservation and management Ndjiondjop et al. (2006).
Polymorphic Information Content (PIC): In this experiment out of 50 primers used, 37 primers were shown polymorphism (Fig. 1). The average number of alleles per locus was 5.69, indicating a greater magnitude of diversity among the plant materials included in this investigation. Seetharam et al. (2009), Lu et al. (2005) and Sjakste et al. (2003) have also reported that the significant differences in allelic diversity among various microsatellite loci (McCouch et al., 1988, 2001; Ram et al., 2007). The alleles revealed by markers showed a high degree of polymorphism, with as many as 28 primers producing 100% of bands polymorphic (Table 3). This amply suggested that the genotypes selected for this study harboured enough genetic divergence (McCouch et al., 1988). Markers with PIC values of 0.5 or higher are highly informative for genetic studies and are extremely useful in distinguishing the polymorphism rate of a marker at a specific locus (DeWoody et al., 1995).
The PIC value ranging in this results was 0.452 (RM171) to 0.931 (RM338) similar range was of 0.57 (RM313) to 0.98 (RM442 and RM163) also observed in Upadhyay et al. (2011). The average of PIC value 0.732 conformed that the markers used in this study were highly informative (Table 3). Similar high PIC value of 0.740 in 43 Australian cultivars and 0.707 in 35 cultivars, landraces and wild relatives were also reported by Garland et al. (1999) and Ram et al. (2007) respectively. Upadhyay et al. (2011) also reported that the average PIC value of 0.78. The mean PIC value observed in this study was higher than 0.578 recorded by Ravi et al. (2003) and 0.570 recorded by Zeng et al. (2004). This indicated that the genotypes used in the present study were more diverse due to differences in origin, ecotype and speciation. Ferreira and Grattapaglia (1998) reported that the microsatellite markers exhibited high PIC values compare to other markers because of their co-dominant expression and multi-allelism
Genetic similarity and distance: The maximum similarity value of 0.786 was observed between the cultivars of IR36 and IR64 indicated that these varieties were more closely related and the genetic distance of these varieties were minimum (0.214) (Table 1 and 2). Both of these cultivars are indica type and they are high yielding, medium duration and medium stature type developed from IRRI. Both of these varieties were having the ability to withstand in flooded condition. The minimum similarity value of 0.237 was observed between the genotypes IR36 and CSR10 indicated that these two varieties were highly divergent and the genetic distance was more (0.763) (Table 1 and 2). CSR10 is a short duration, sodicity tolerant rice variety developed from CSSRI, Karnal. IR36 is popular high yielding variety developed from IRRI and having the ability of submergence tolerant (PIA press release, 2008: www.pia.gov.ph). High genetic similarity among the genotypes of common geographic origin and low similarity among the genotypes of diverse geographic origins were also reported by Chakravarthi and Rambabu (2006), Ram et al. (2007) and Senguttuvel et al. (2010) in their studies by using SSR markers.
Cluster analysis: Cluster analysis was used to group the varieties and to construct a dendrogram. The similarity matrix representing the Jaccard’s coefficient was used to cluster the data using the UPGMA algorithm. The dendrogram revealed that the allelic richness of nine clusters of various sizes of which four are mono-clusters at a similarity coefficient level of 4.8 (Fig. 2).
Cluster I was the biggest cluster having nine varieties all are indica type (IR36, IR64, TRY(R) 2, ADT43, CO43, Bhavani, BPT5204, W.Ponni and CO47) of which except BPT 5204 all the varieties are developed and popularly grown in Tamil Nadu. Cluster II consisted of three varieties (TRY1, CSR11 and CSR27) all are highly tolerant to salinity. Cluster III consisted of Moroberekan and NA13-2 of which Moroberkan is a Japonica type of rice variety and having the characteristic of drought tolerance. NA13-2 is a sodicity tolerant rice variety. Cluster IV consisted of CT9993, TKM11, TKM12 IET15693 (N13), Jaya, Vatharanyam and TPS3. Among the seven varieties CT9993, TKM11, TKM12 are salt tolerant varieties and N13 is salt tolerant rice germplasm and Vatharanyam is a salt tolerant local land race of Tamil Nadu; Jaya and TPS 3 are high yielding rice varieties. Cluster V consisted of CR1009 which is a high yielding rice variety. Cluster VI consisted of Pokkali and CSR23 both are highly tolerant to salinity. Cluster VII, VIII and IX are mono-clusters consisted of CSR27, CSR10 and Jeeragasamba (Fig. 2). The genetic similarity value in most of the genotypes are less than 50 per cent indicating higher level of polymorphism observed in our study compared to 80 per cent similarity of indica types by Chakravarthi and Rambabu, (2006) Similar less similarity value was also reported by Bhuyan et al. (2007) among the rice genotypes.
CONCLUSION
Based on this experiment the large range of similarity values for related cultivars using microsaltellite markers provided the greater confidence for the assessment of genetic diversity and relationships. This analysis is highly useful in DNA finger printing of all the varieties used .In all the breeding program utilizing the genotypes with more genetic diversity may give better off springs than the highly close genotypes. Hence parental selection based on the genetic diversity is highly essential to develop a good variety. In future by utilizing the highly genetic diverse parents of IR 36 and CSR 10 may help to develop a high yielding and salt tolerant varieties. Based on this analysis the followed genotypes viz., ADT43, CO43, Bhavani, BPT5204, W.Ponni and CO47 can be utilized as female parents and CSR27, CSR10, Pokkali and CSR23 can be utilized for the male parents in further breeding programme for the development of salt tolerant varieties.
ACKNOWLEDGEMENT
The laboratory facilities provide by the MAHY CO, Dawalwadi Jalna, Maharasta, India is duly acknowledged.
REFERENCES
- Bhuyan, N., B.K. Borah and R.N. Sarma, 2007. Genetic diversity analysis in traditional lowland rice (Oryza sativa L.) of Assam using RAPD and ISSR markers. Curr. Sci., 93: 967-972.
Direct Link - Bhowmik, S.K., M.M. Islam, R.M. Emon, S.N. Begum, A. Siddika and S. Sultana, 2007. Identification of salt tolerant rice cultivars via phenotypic and marker-assisted procedures. Pak. J. Biol. Sci., 10: 4449-4454.
CrossRefPubMedDirect Link - Chakravarthi, B.K. and R. Naravaneni, 2006. SSR marker based DNA fingerprinting and diversity study in rice (Oryza sativa L.). Afr. J. Biotechnol., 5: 684-688.
Direct Link - Patra, N. and H.S. Chawla, 2010. Biochemical and RAPD molecular markers for establishing distinctiveness of basmati rice (Oryza sativa L.) varieties as additional descriptors for plant variety protection. Indian J. Biotechnol., 9: 371-377.
Direct Link - DeWoody, J.A., R.L. Honeycutt and L.C. Skow, 1995. Microsatellite markers in white tailed deer. J. Hered., 86: 317-319.
PubMed - Ford-Lloyd, B.V., M.T. Jackson and H.J. Newbury, 1997. Molecular Markers and the Management of Genetic Resources in Seed Genebanks: A Case Study of Rice. In: Biotechnology and Plant Genetic Resources: Conservation and Use, Callow, J.A., B.V. Ford-Lloyd and H.J. Newbury (Eds.). CAB International, Wallingford, UK.
- Ram, S.G., V. Thiruvengadam and K.K. Vinod, 2007. Genetic diversity among cultivars, landraces and wild relatives of rice as revealed by microsatellite markers. J. Applied Genet., 48: 337-345.
PubMed - Garland, S.H., L. Lewin, M. Abedinia, R. Henry and A. Blakeney, 1999. The use of microsatellite polymorphisms for the identification of Australian breeding lines of rice (Oryza sativa L.). Euphytica, 108: 53-63.
CrossRefDirect Link - Jain, S., R.K. Jain and S.R. McCouch, 2004. Genetic analysis of Indian aromatic and quality rice (Oryza sativa L.) germplasm using panels of fluorescently-labeled microsatellite markers. Theor. Applied Genet., 109: 965-977.
CrossRefDirect Link - Lu,H., M.A. Rsdus, J.R. Coburn, J.N. Rutger S.R. McCouch and T.H. Tai, 2005. Population structure and breeding patterns of 145 U.S. Rice cultivars based on SSR marker analysis. Crop Sci., 45: 66-76.
Direct Link - McCouch, S.R., G. Kochert, Z. Yu, Z. Wang, G.S. Khush, W. Coffman and S.D. Tanksley, 1988. Molecular mapping of rice chromosomes. Theor. Applied Genet., 76: 815-829.
CrossRefDirect Link - McCouch, S.R., S. Temnykh, A. Lukashova, J. Coburn and G. Declerck et al., 2001. Microsatellite markers in rice: Abundance, diversity and applications. Rice Genet., 4: 117-135.
CrossRef - Ndjiondjop, M.N., K. Semagn, M. Cissoko, H. Tsunematsu and M. Jones, 2006. Genetic relationships among rice varieties based on expressed sequence tags and microsatellite markers. Asian J. Plant Sci., 5: 429-437.
CrossRefDirect Link - Panaud, O., X. Chen and S.R. McCouch, 1996. Development of microsatellite markers and characterization of Simple Sequence Length Polymorphism (SSLP) in rice (Oryza sativa L.). Mol. Gen. Genet., 252: 597-607.
CrossRef - Ravi, M., S. Geethanjali, F. Sameeyafarheen and M. Maheswaran, 2003. Molecular marker based genetic diversity analysis in rice (Oryza sativa L.) using RAPD and SSR markers. Euphytica, 133: 243-252.
CrossRefDirect Link - Rohlf, F.J., 2000. NTSYS-PC: Numerical Taxonomy and Multivariate Analysis System. Version 2.1. Owner Manual. Applied Biostatistics Inc., New York, United States,.
Direct Link - Seetharam, K., S. Thirumeni and K. Paramasivam, 2009. Estimation of genetic diversity in rice (Oryza sativa L.) genotypes using SSR markers and morphological characters. Afr. J. Biotechnol., 8: 2050-2059.
Direct Link - Sivaranjani, A.K.P., M.K. Pandey, I. Sudharshan, G.R. Kumar and M.S. Madhav et al., 2010. Assessment of genetic diversity among basmati and non-basmati aromatic rices of India using SSR markers. Curr. Sci., 99: 221-226.
Direct Link - Senguttuvel, P., M. Raveendran, C. Vijayalakshmi, K. Thiyagarajan, J.R.K. Bapu and B.C. Viraktamath, 2010. Molecular mechanism of salt tolerance for genetic diversity analysed in association with Na+/K+ ratio through SSR markers in rice (Oryza sativa L.). Int. J. Agric. Res., 5: 708-719.
CrossRefDirect Link - Sokal, R.R. and C.D. Michener, 1958. A statistical method for evaluating systematic relationships. Univ. Kansas Sci. Bull., 38: 1409-1438.
Direct Link - Song, Z.P., X. Xu, B. Wang, J.K. Chen and B.R. Lu, 2003. Genetic diversity in the Northernmost Oryza rufipogon populations estimated by SSR markers. Theor. Applied Genet., 107: 1492-1499.
CrossRef - Sjakste, T.G., I. Rashal and M.S. Roder, 2003. Inheritance of microsatellite alleles in pedigrees of Latvaian barley varieties and related European ancestors. Theor. Applied Genet., 106: 539-549.
CrossRefPubMedDirect Link - Temnykh, S., W.D. Park, N. Ayres, S. Cartinhour and N. Hauck et al., 2000. Mapping and genome organization of microsatellite sequences in rice (Oryza sativa L.). Theor. Applied Genet., 100: 697-712.
CrossRefDirect Link - Thanh, N.D., H.G. Zheng, N.V. Dong, L.N. Trinh, M.L. Ali and H.T. Nguyen, 1999. Genetic variation in root morphology and microsatellite DNA loci in upland rice (Oryza sativa L.) from Vietnam. Euphytica, 105: 43-51.
Direct Link - Toth, G., Z. Gaspari and J. Jurka, 2000. Microsatellites in different eukaryotic genome: Survey and analysis. Genome Res., 10: 967-981.
Direct Link - Upadhyay, P., V.K. Singh and C.N. Neeraja, 2011. Identification of specific alleles and molecular diversity assessment of popular rice (Oryza sativa L.) varieties of India. Int. J. Plant Breed. Genet., 5: 130-140.
Direct Link - Zeng, L., T.R. Kwon, X. Liu, C. Wilson, C.M. Grieve and G.B. Gregorio, 2004. Genetic diversity analyzed by microsatellite markers among rice (Oryza sativa L.) genotypes with different adaptations to saline soils. Plant Sci., 166: 1275-1285.
CrossRefDirect Link - Dellaporta, S.L., J. Wood and J.B. Hicks, 1983. A plant DNA minipreparation: Version II. Plant Mol. Biol. Rep., 1: 19-21.
CrossRefDirect Link