
Z. Zakaria
Faculty of Applied Sciences, University Technology MARA Malaysia, 40000 Shah Alam, Selangor, Malaysia
M.A. Mohd Ishak
Faculty of Applied Sciences, University Technology MARA Malaysia, 40000 Shah Alam, Selangor, Malaysia
M.F. Abdullah
Faculty of Applied Sciences, University Technology MARA Malaysia, 40000 Shah Alam, Selangor, Malaysia
K. Ismail
Faculty of Applied Sciences, University Technology MARA Malaysia, 40000 Shah Alam, Selangor, Malaysia
International Journal of Chemical Technology
Year: 2010 | Volume: 2 | Issue: 3 | Page No.: 78-87


ABSTRACT
This study attempted to observe the thermal decomposition and to evaluate the reactivity of rice husk, rice husk char and its blends individually with Mukah Balingian (MB) low rank coal, Blair Athol (BA) low rank coal and Silantek (SL) medium rank coal during pyrolysis and combustion processes via Thermogravimetry (TG) method. The heating rate of the thermogravimetric analyser (TGA) was fixed at 20°C min-1. The thermal differential weight loss (DTG) evolution profiles which, correspond to the decomposition of volatile matter and char showed that the rice husk seems to be more reactive than the coal during pyrolysis and combustion processes. When, the rice husk char was blended individually with MB and BA coals at 50 wt.% ratio, the DTG evolution profiles during combustion revealed one single evolution profile, indicating the comparable thermo-chemical reactivity between the two different fuels. Hence, these observations indicate the feasibility of blending both MB and BA low rank coals individually with rice husk char as a potential fuel blends in the fixed-bed pulverized boiler combustor.
PDF Abstract XML References Citation
How to cite this article
Z. Zakaria, M.A. Mohd Ishak, M.F. Abdullah and K. Ismail, 2010. Thermal Decomposition Study of Coals, Rice Husk, Rice Husk Char and Their Blends During Pyrolysis and Combustion via Thermogravimetric Analysis. International Journal of Chemical Technology, 2: 78-87.
DOI: 10.3923/ijct.2010.78.87
URL: https://scialert.net/abstract/?doi=ijct.2010.78.87
DOI: 10.3923/ijct.2010.78.87
URL: https://scialert.net/abstract/?doi=ijct.2010.78.87
INTRODUCTION
Combustion of fossil fuels such as coal has imposed huge impact to the environment due to CO2 and SO2 emissions that can cause global warming effect and acid rain phenomena, respectively. An alternative means of reducing the CO2 and SO2 emissions, is by minimizing the combustion of coal by utilizing the co-firing of coal and biomass materials. Though, combustion of biomass alone emit less CO2, however, the energy produced are smaller in comparison to that of fossil fuel. Hence, by utilizing the co-firing of coal and biomass fuel would be an excellent choice for compromising between the CO2, SO2 and energy produced (Sami et al., 2001). In addition, although, the world coal reserves are of abundance, it will eventually deplete in comparison with biomass fuel that can be reproduced regularly. However, besides the simplicity of the co-firing concept in coal/biomass blends, their emission, combustion efficiency and impacts on system performance in the present co-firing plant need further attention. Hence, the knowledge in term of chemical composition, the thermal behavior and reactivity of this biomass fuel and their blends with coal during combustion is an important issue need to be well understood.
Thermoanalytical techniques, such as thermogravimetric analysis and derivative thermogravimetric (DTG) are one of the most common techniques used to investigate the thermal evolution profiles and kinetics during pyrolysis and combustion of coals and biomass fuels (Vuthaluru, 2003, 2004; Vamvuka et al., 2003). The study on the combustion of biomass fuels and sewage sludge via TGA has also captured attention in an attempt to find suitable fuels as co-blend with coal (Folgueras et al., 2003). Recently, Lester et al. (2007) demonstrated a new method to accurately predict the biomass/coal blend composition using TGA by mapping the devolatilisation profiles of the blends with the actual profiles of the biomass and coals. Further, they claimed that this method is able to identify the type of feedstock and blend proportion. In another recent work, Osorio et al. (2008) studied the rapid assessment of coal combustibility using TGA coupled with optical microscopy. They found that different trends in variation of combustion profile parameters from DTG curves were observed for the coal blends and these curves were closely resembled to that of the theoretical calculated curves.
Previous findings by Ismail et al. (2005a) has shown that the pyrolysis of rice husk, rice straw, sugarcane bagasse and coal revealed different decomposition rates between the fuels as observed by the TG curves. Further, the thermal DTG evolution profiles for the biomass occurred at lower temperature region with comparison to the coal at higher temperature range, indicating the high reactivity of the former. The differences in the reactivity between the biomass and coal might reflect the incompatibility of the fuels to be blended together and used in co-firing pulverized boiler. It is anticipate that, by carbonizing the biomass and forming the char will be a good choice of removing the volatile matter and reduce its reactivity accordingly and hence increase the possibility of blending together with coal.
Hence, the aims of this study were to investigate the thermal behavior of three coals of comparable rank, rice husk, rice-husk char and their respective blends during pyrolysis and combustion processes using thermogravimetry analysis. The effect of blending ratio on reactivity of these samples during pyrolysis and combustion processes will also be reported.
MATERIALS AND METHODS
Raw Materials
The samples used in this study were Mukah Balingian (MB) low rank coal and Silantek (SL) medium rank coal from Sarawak, Malaysia; Blair Athol (BA) low rank coal from Australia and, rice husk from Perlis, Malaysia. Table 1 shows the characteristics of the samples. From Table 1, it can be seen that although, BA coal is of low rank, the volatile matter content however, is much lower in comparison to that of MB coal with slight higher calorific value.
| Table 1: | Characteristics of MB, BA, SL coals, rice husk and rice husk char |
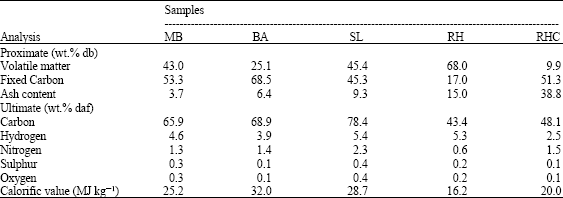 | |
| Calculated by difference; MB: Mukah balingian coal, BA: Blair athol coal, SL:Silantek coal, RH: Rice husk, RHC: Rice husk char, db: Dry basis, daf: Dry ash free basis | |
Apparently for SL coal, although the amount of volatile matter content almost comparable to that of MB coal, the carbon content and calorific value are much higher and categorized as high-volatile sub-bituminous coal.
The samples preparation of the coals and rice husk were carried out according to the method described previously by Ismail et al. (2005b). The calorific value analysis of the samples was carried out using AC-350 Automatic Calorimeter model manufactured by LECO Corporation. This study was conducted at Fossil Fuels and Biomass Laboratory, Universiti Teknologi MARA Perlis, from 2005 to 2006.
Carbonization Process
The carbonization of rice husk forming the char was carried out by using tube furnace under flowing nitrogen gas with flow-rate of 2 bubbles sec-1 with constant heating rate of 20°C min-1 at the temperature 600°C with approximate residence time of 2 h for the solid. The combustion of coals, rice husk, rice husk char and their respective blends were performed using thermogravimetric analyser DTA/DSC TA Model SDT Q600 under purified air with constant flow-rate of 100 mL min-1 and at a heating rate of 20°C min-1 in the temperature range of 25-900°C. The sample (~ 20 mg) was weighed directly into ceramic crucible and the temperature was kept isothermal for one minute until steady condition was obtained before ramping to the desired temperature. The experiments were replicated at least twice to determine their reproducibility, which was found to be very good (within error of ±2%). Table 1 shows the characteristics of the samples. Apparently, the fixed carbon and calorific value for the rice husk char increased because, the released of volatile matter during the combustion process. Thus, the decreased in volatile matter contributed to the increased of the ash content as the mineral matter being concentrated in the char.
Calibration Procedure of TGA
The SDT Q600 calibration includes the following procedures: TGA weight calibration; DTA baseline calibration; calibration of temperature signal and calibration of the heat flow signal. The heating rate of 20°C min-1 from ambient to 1500°C temperatures in nitrogen gas environment purging at 100 mL min-1 were applying for all the calibration procedures above. TGA weight calibration was based on 2 runs, i.e., one using calibration weights and one using no weight (empty beam). The TGA data from both runs was analyzed and beam and weight correction factors were calibrated automatically. For the DTA Baseline calibration, Delta T data collected from a baseline run conducted over the temperature range expected in subsequent experiments was analyzed. The DTA baseline was corrected by a linear (slope and offset) function of the sample temperature. This results in shifting and rotating the baseline so that, the calibrated portion is near 0°C. For the temperature, calibration was based on evaluation of the melting endotherm of a high purity metal standard of zinc (419°C). The recorded onset of melting of this standard zinc was compared with the literature value and the difference (must be within ±2°C) was calculated for temperature calibration. Finally, the SDT heat flow calibration was based on analyzing the heat capacity curve for sapphire over the range 200 to 1500°C and the heat of fusion of high purity zinc metal.
Three experimental runs were required: one using an empty alumina cup (90 μL) for both the reference and sample (baseline run) and one using sapphire standard as the sample. The measured heat capacity for sapphire was compared with the literature value temperatures across the range and mathematically fitted to generate a heat flow calibration curve. This calibration curve may be further refined by a third experiment that measures the heat fusion of high purity zinc wire standard. The heat of fusion was measured and the cell constant was calculated using known value of the heat of fusion of zinc (108.7 J g-1) and the equation: Cell Constant = Known Value/Measure Value. The calculated value (must be in the range of 1.00-1.30) of the cell constant was then entered into the software to automatically calibrated the heat flow values.
RESULTS AND DISCUSSION
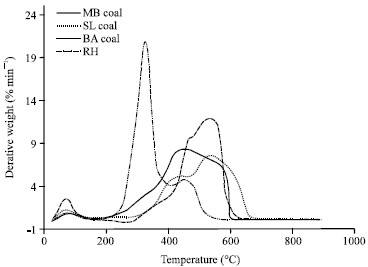
The TG and DTG evolution profiles of coals, rice husk, rice husk char and their respective blends during pyrolysis and combustion modes were depicted in Fig. 1a-6, respectively. For the DTG evolution profiles (Fig. 1b-4), the peaks that evolved at less than 200°C, attributed to the moisture released from the samples and this correspond to the first thermal evolution profile.
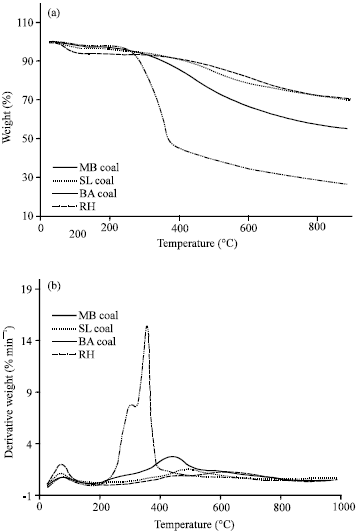 | |
| Fig. 1: | (a) TG curves for the thermal decomposition of coals and rice husk during pyrolysis at heating rate of 20°C min-1 and (b) DTG evolution profile for coals and rice husk during pyrolysis at heating rate of 20 °C min-1 |
Thermal Evolution Profiles of Coals and Rice Husk During Pyrolysis
The TG curves for the thermal decomposition of coals and rice husk during pyrolysis at heating rate of 20°C min-1 are shown in Fig. 1a. Apparently, the TG curves of coals and rice husk, showed a decreased in the percent of weight loss. These initial decreased in the percent of weight loss correspond to the first differential weight loss (DTG) evolution profile for coals and rice husk as shown in Fig. 1b. Hence, this evolution profile was not taken into consideration for the determination of thermal profiles in coals and rice husk. Moreover, it appears that the TG curve for the decomposition of rice husk was steeper and occurred at relatively lower temperature range with comparison to the coals, indicating a higher percent rate of weight lost had occurred in the former. Moreover, among the three different coals, the MB coal decomposed at a much faster rate than the BA and the SL coals as indicated by the sharp decreased in the percent of weight loss profiles of the TG curves. The steep slope in the rice husk decomposition corresponds to two distinctive major thermal DTG evolution profiles that occurred at temperature ranging from 295 - 333°C and 346 - 373°C and were due to volatile matter released from the degradation of hemicellulose and cellulose, respectively. Similarly, the thermal DTG evolution profiles for the both MB and BA coals decompositions showed one major thermal profiles at temperature range of 415-475°C, with the SL coal thermal DTG evolution profile appears at slightly higher temperature in the range of 450- 520°C and these profiles were attributed to the released of volatile matter. In addition, the thermal DTG evolution profiles for the coals decompositions also showed the appearance of some minor evolution profiles at temperature range of 550-690°C and at above 700°C, that were associated to the released of heavy hydrocarbons and from thermal decomposition of carbonates that are abundance in low rank coals (Vamvuka et al., 2003; Vuthaluru, 2004; Pietrzak and Wachowska, 2004).
Previously, Zheng and Kozinski (2000) have shown that the thermal DTG evolution profile peak height (R) and maximum peak temperature (Tmax) is directly and inversely proportional to the reactivity, respectively. The mean reactivity (Rm) was then determined by using a parameter (R/Tmax)100 to calculate for each peak, adding the share of any secondary peak or shoulders present in the DTG thermal evolution profile with exception to the peak due to moisture released. In this calculation, the rate of weight loss (mg min-1) was used, giving the dimensions for the mean reactivity as mg/min/°C. The calculated mean reactivity (Rm) values for the rice husk and coals are shown in Table 2. Apparently, the Rm value for the rice husk is larger in comparison to that of coals indicating the higher reactivity of the former during pyrolysis condition.
| Table 2: | The reactivity profiles of coals : rice husk (RH) blends during pyrolysis at heating rate of 20°C min-1 |
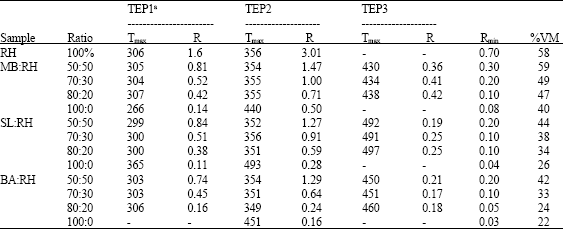 | |
| TEP: Thermal evolution profile. aShoulder peak, Tmax: Peak height temperature (°C), R = Peak height (mg min-1), Rm: Mean reactivity (mg/min/°C), VM: Volatile matter (dry basis) | |
 | |
| Fig. 2: | DTG evolution profiles of 50:50 of coals : Rice Husk (RH) blends during pyrolysis |
This finding confirms with the previous work by Moghtaderi et al. (2004) and Vuthaluru (2004) where, the biomass materials exhibit higher reactivity than coal as observed through the devolatilization process and percent of weight loss, respectively. Among the coals sample, the MB coal exhibits a slightly higher reactivity followed by BA and SL coals and this observation seems to correlate with the coal rank.
Thermal Evolution Profiles of Coals and Rice Husk Blends During Pyrolysis
Figure 2 overlays the thermal DTG evolution profiles for the thermal decomposition of 50:50 wt.% coals and their respective blends with rice husk during pyrolysis condition. The thermal DTG evolution profiles for the coals and its respective blends with rice husk revealed two major evolution profiles. The second thermal evolution profiles at temperature range of 250-350°C correspond to the volatile released from degradation of hemicellulose and cellulose that were present in the rice-husk, respectively. With the third thermal evolution profile at peak temperature of above 400°C was attributed to the decomposition of char derived from both coal and rice husk. Thus, the appearance of several thermal evolution peak profiles in the blending indicates the lack of interaction between the respective fuels in the solid phase during pyrolysis. This behavior was probably due to the differences in the polymeric molecular strength, volatile matter and fixed carbon contents between the coal and biomass materials. The rice husk constitute of mainly hemicellulose and cellulose that are linked together by relatively weak ether bonds that are less resistant to the heat at low temperatures (Moghtaderi et al., 2004). On contrary, the coal macromolecular polymeric structure is mostly comprises of dense polycyclic aromatic hydrocarbons with strong aromatic bonding that are more resistant to the heat (Vamvuka et al., 2003). Thus, the differences in the polymeric materials that are present in the two different fuels lead to variation in reactivity of the materials during pyrolysis. Similar thermal evolution profiles have been reported by Vamvuka et al. (2003) who studied the co-pyrolysis of wood wastes and lignite blending.
Further, from Table 2, it can be seen that the thermal DTG evolution profile peak height (R) for the second thermal evolution profiles for the coal to rice husk blends seem to decrease with the increased in the percent weight ratio of coal in the blends. Likewise, the position of the maximum peak temperatures (Tmax) that were assigned to the second thermal evolution profiles in the coal to rice husk blends were slightly lower in comparison to the Tmax of the pure rice husk.
 | |
| Fig. 3: | DTG evolution profiles of coals and Rice Husk (RH) during combustion |
These observations were consistent with the percent of volatile matter released that decreased by increasing the weight ratio of coal in the blends. Similarly, the third thermal evolution profile for the volatile matter released from coal decomposition showed, a slight decreased in peak height and Tmax with increasing in the percent weight ratio of the rice husk in the blends.
Hence, it seems that the amount of volatile matter released from the rice husk and coal is directly proportional to the percent of respective fuels that presence in the blends, indicating lack of interaction between the two different types of fuels during pyrolysis.
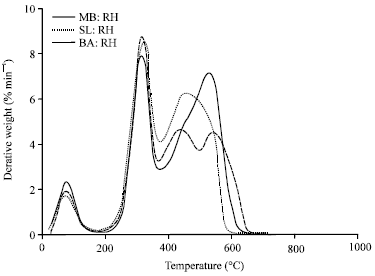
Thermal Evolution Profiles of Coals and Rice Husk During Combustion
The DTG evolution profiles of coals and rice husk during combustion mode as depicted in Fig. 3 showed a much complex evolution trend with appearance of multiple evolution peaks with comparison to that of pyrolysis mode. The two evolution profiles with Tmax values of 345 and 460°C, were associated to the combustion of cellulose materials and char, respectively. With comparison to rice husk, the DTG evolution profiles of coals seem to be more complex, i.e., from MB, BA to SL coals, with respective thermal evolutions and Tmax values shifted at higher temperature regime. For MB coal, the second evolution profile was attributed to the combustion of volatile matter, with appearance of shoulder at temperature ranges of 250-350°C and a broad peak from 400-625°C peaking at ca. 500°C. Whilst, for BA coal, the combustion of volatile matter was observed by a slight shifted of shoulder and broad peak at temperature ranges of 320-400°C and 425-625°C, respectively, with Tmax at 530°C. For SL coal, the devolatilisation however, was observed by the two obvious peaks appeared at much higher temperature regimes i.e., at 350-450°C and 450-650°C, with Tmax at 530°C. The shifted in thermal evolution profiles and Tmax for each of these coals revealed the difference in thermal reactivity during combustion due to their different types and complexity of the polymeric materials content.
Thermal Evolution Profiles of Coals and Rice Husk Blends During Combustion
The DTG evolution profiles for the thermal decomposition of coals to rice husk blends at 50:50 wt.% ratios during combustion under flowing of purified air are shown in Fig. 4. The second thermal evolution profile at temperature range of 250-350°C was assigned to the combustion of hemi- and cellulose materials from the rice-husk, with the third evolution profile at above 400°C was attributed to the combustion of the charred materials derived from both coal and rice husk (Folgueras et al., 2003).
 | |
| Fig. 4: | DTG evolution profiles of 50:50 of coals : Rice Husk (RH) blends during combustion |
These evolution profiles resemblance to that of Fig. 3, as though both of the fuels (i.e., biomass and coal) had undergone combustion individually. However, for the SL coal blends, the third evolution peak was enhance with comparison to the combustion profile of the SL coal alone and this probably due to the contribution from the charred material released from the rice husk in the blending. Further, the SL coal is of higher rank with comparison to the MB and BA coals, as reflected by the higher carbon and lower oxygen contents (Table 1). Hence, no interaction between the coals and rice husk was observed in the blends, indicating lack of interaction between the fuels in the solid state due to the different reactivity during combustion. This behaviour was probably due to the differences in the volatile matter and carbonaceous materials in the rice husk from that of coals.
Thermal Evolution Profiles of Coals and Rice Husk Char Blends During Combustion
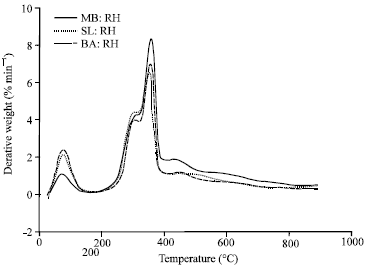
In order to investigate, the interaction between the coals and rice husk char blends during combustion, the similar blend ratio at 50:50 wt.% was selected and discussed. Figure 5 shows the DTG evolution profile for the rice husk char during combustion. Obviously, the DTG profile clearly showed only the presence of one single evolution profile that appears at temperature range of 350 to 550°C due to the combustion of the charred material. Indeed, the carbonization of the rice-husk had successfully removed all the volatile matter content from the sample since no evolution profile at below 350°C was detected. Interestingly, the DTG evolution profiles for the 50:50 wt.% MB coal and rice husk char blend and 50:50 wt.% BA coal and rice husk char blend during combustion as shown in Fig. 4, revealed the presence of one single evolution profile with Tmax at ca. 530 and 550°C, respectively. Hence, in both of the coal : rice husk char blends, the peak due to the volatile matter released derived from the biomass had disappeared, revealing only the evolution peak due to the combustion of biomass char that overlapped with the evolution profile of the coals. Thus, both the coals and rice husk char blends showed comparable reactivity by the evidence of one single evolution profile, indicating the synergistic effect between the two fuels.
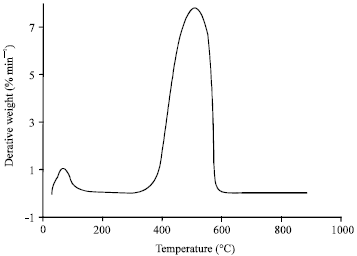 | |
| Fig. 5: | DTG evolution profile of Rice Husk Char (RHC) during combustion |
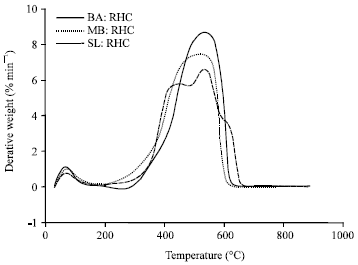 | |
| Fig. 6: | DTG evolution profiles of 50:50 of coals: Rice Husk Char (RHC) blends during combustion |
Comparatively, based on the DTG evolution profiles between the two coal : rice husk char blends (Fig. 6), the MB coal : rice husk char blend showed higher reactivity than the BA coal : rice husk char blend as observed by the lower Tmax of the former. This observation is consistent with the high volatile matter and low carbon contents of the MB coal (Table 1) that indicates slightly lower rank than that of the BA coal.
The DTG evolution profiles for the 50:50 wt.% SL coal and rice husk char blend during combustion however, showed the presence of multiple evolution profiles at temperature ranging from 380-550 and 580-630°C that were due to combustion of the rice husk char and coal, respectively. This observation indicates the incompatibility behaviour between the two fuels during combustion due to difference in reactivity. The SL coal is a medium rank based on the higher carbon and lower oxygen contents with comparison to MB and BA coals, hence is the least reactive during combustion as observed by the DTG evolution profiles.
CONCLUSIONS
The thermal decompositions of coals, rice husk, rice husk char and their respective blends during pyrolysis and combustion were successfully being observed by thermogravimetric analysis. The DTG evolution profiles of coals and rice husk blends during pyrolysis showed three major thermal evolution profiles that corresponded to the moisture and volatile and char, indicating no synergistic effect between the fuels due to different reactivity. The combustion of coals and rice husk char blends however, showed a single evolution peak indicating comparable reactivity between different fuels, with exception to the SL coal, probably due to its high rank. Hence, this study shows the feasibility of low rank coals and rice husk char blends to be combusted together in the fixed bed pulverized boiler.
ACKNOWLEDGMENTS
The authors would like to thank the Research Management Institute (RMI), University Technology MARA, for funding the research grant (grant no.: 600-IRDC/ST5/3/720).
REFERENCES
- Folgueras, M.B., R.M. Diaz, J. Xiberta and I. Prieto, 2003. Thermogravimetric analysis of the co-combustion of coal and sewage sludge. Fuel, 82: 2051-2055.
CrossRef - Ismail, K., Z. Zakaria and M.A.M. Ishak, 2005. Thermal behavior study of Mukah balingian coal and biomass blends during pyrolysis via Thermogravimetric analysis. Proceedings of the 22nd International Pittsburgh Coal Conference, Oct. 9-4, Pittsburgh, USA., pp: 2-11.
Direct Link - Lester, E., M. Gong and A. Thompson, 2007. A method for source apportionment in biomass/coal blends using Thermogravimetric analysis. J. Anal. Applied Pyrolysis, 80: 111-117.
CrossRef - Moghtaderi, B., C. Meesri and T.F. Wall, 2004. Pyrolytic characteristics of blended coal and woody biomass. Fuel, 83: 745-750.
CrossRef - Osorio, E., M.L.F. Ghiggi, A.C.F. Vilela, W.D. Kalkreuth and A.G. Borrego, 2008. Non-isothermal combustion behavior of coals blends in a thermobalance as seen by optical microscopy. Thermochimica Acta, 475: 1-7.
CrossRef - Pietrzak, R. and H. Wachowska, 2004. Thermal analysis of oxidized coals. Thermochimica Acta, 419: 247-251.
CrossRef - Sami, M., K. Annamalai and M. Wooldridge, 2001. Co-firing of coal and biomass fuel blends. Prog. Energy Combust. Sci., 27: 171-214.
CrossRefDirect Link - Vamvuka, D., E. Kakaras, E. Kastanaki and P. Grammelis, 2003. Pyrolysis characteristics and kinetics of biomass residuals mixtures with lignite. Fuel, 82: 1949-1960.
CrossRef - Vuthaluru, H.B., 2003. Thermal behaviour of coal/biomass blends during co-pyrolysis. Fuel Process. Technol., 85: 141-155.
CrossRef - Vuthaluru, H.B., 2004. Investigation into the pyrolytic behaviour of coal/biomass blends using Thermogravimetric analysis. Bioresour. Technol., 92: 187-195.
CrossRef - Zheng, G. and J.A. Kozinski, 2000. Thermal events occurring during the combustion of biomass residue. Fuel, 79: 181-192.
CrossRefDirect Link