
D.M. Mathuva
School of Management and Commerce, Strathmore University, P.O. Box 18,00100, Nairobi, Kenya
The International Journal of Applied Economics and Finance
Year: 2013 | Volume: 7 | Issue: 1 | Page No.: 1-22


ABSTRACT
Maximizing the return on corporate investment in inventories which represents a substantial proportion of the firm’s working capital is one key objective of a finance manager. This means that an optimal inventory level which maximizes the benefits and minimizes the costs of inventory holdings is important for firms to realize this objective. This study examines the firm-, time-, industry- and economy-level determinants of corporate inventory holdings. Data were collected from 341 firm-year observations (composed of a sample of 28 non-financial quoted firms) on the Nairobi Securities Exchange for the period 1996-2008. The data consisted of mainly financial data collected from annual financial reports of the 28 firms. The findings, which are robust for endogeneity, demonstrate that inventory holdings are influenced by the firm’s ability to generate internal resources (cash from operations), capital expenditure, firm’s growth opportunities, sales forecast volatility, net profit margin and the cash conversion cycle. The results provide limited evidence that firm size is a determinant of corporate inventory holdings. While firms maintain target (optimal) inventory levels, the study finds that this target varies with inventory supply and demand or usage. In conclusion, this study establishes that the determinants of corporate inventory holdings are primarily based on the firm’s efficiency, performance and sustainability position.
PDF Abstract XML References Citation
Received: September 07, 2012;
Accepted: December 24, 2012;
Published: June 05, 2013
How to cite this article
D.M. Mathuva, 2013. Determinants of Corporate Inventory Holdings: Evidence from a Developing Country. The International Journal of Applied Economics and Finance, 7: 1-22.
DOI: 10.3923/ijaef.2013.1.22
URL: https://scialert.net/abstract/?doi=ijaef.2013.1.22
DOI: 10.3923/ijaef.2013.1.22
URL: https://scialert.net/abstract/?doi=ijaef.2013.1.22
INTRODUCTION
The level of corporate investment in inventories represents a substantial amount over the asset levels held by a firm. On average, inventories represent approximately 43.92% of the current assets and 18.17% of the total assets for firms. This means that inventory management decisions should focus beyond the minimization of the relevant costs. An examination of other factors influencing inventory holdings, in addition to their implications should also be examined. Studies on inventory management have used various metrics to examine the effect of inventory management on firm characteristics such as the length of the cash conversion cycle, size, firm growth and profitability. For instance, Gaur et al. (2005) used the inventory turnover, measured as the ratio of a firm’s cost of goods sold to its average inventory levels. Studies have found that the lower the inventory turnover, the higher the level of investment in inventories. Deloof (2003), Lazaridis and Tryfonidis (2006), Padachi (2006) and Garcia-Teruel and Martinez-Solano (2007) measured inventory management using the inventory conversion period calculated as total inventories scaled by cost of sales multiplied by the number of days in a year.
Inventory management research has addressed various constructs. While some studies have investigated the relationship between inventory conversion period and profitability, other strands of research in operations management have examined the effect of inventory turnover on performance. Carpenter et al. (1994) focused on inventory investment under different business cycles. Extant research on the relationship between inventory conversion periods on profitability has produced mixed results. Studies in this area have acknowledged research limitations based on the inconclusiveness of the variables used. Other studies have proposed varied analysis techniques to be used when exploring the relationship between inventories and other variables. Since inventory management is important in working capital management decisions, an examination of the determinants influencing the corporate investment in inventories is warranted. This study seeks to identify those variables which influence the corporate decision on how much funds should be invested in inventories. An examination into both the internal and external factors which influence inventory investment decisions has been examined. Specifically, the underpinning relation between inventory holdings and the firm’s ability to generate internal resources (cash from operations) has been given greater emphasis.
The overarching goal of inventory management is to minimize the relevant costs which comprise the holding or carrying costs and the ordering costs. Minimizing the trade-off between the holding costs and ordering costs is aimed at establishing the optimal inventory level represented by the Economic Order Quantity (EOQ). The EOQ model has been in existence for a long time. Under conditions of uncertainty, firms are forced to maintain buffer inventories to safeguard against possible stock outs in the future. In inflationary and economically unstable economies, this seems economically plausible. It should however, be noted that inventory investment is primarily determined by the business cycle-given by the trends in the sales levels. In this case, the uncertainty in sales levels must be examined to establish inventory investment patterns when sales surprises exist. The present study examines the effect of sales surprise on inventory investment levels. In addition, inventory investment is also influenced by other factors, which may be internal or external.
Various strands of research in operations management have examined new concepts in inventory management including Vendor-Managed Inventory (VMI), Materials Requirements Planning (MRP), Just-In-Time (JIT), Enterprise Resource Planning (ERP) among others. This study finds that given the uncertainties in inventory investment, consignment stocking is beginning to take effect in this economy. Discussions with the respondents revealed that firms would rather transfer the risks of holding the inventories to the supplier while covering themselves for any uncertainties that may arise if inventory supply is cut. In so doing, the firms are assured of constant availability of the inventories while minimizing costs.
Firms experience difficulties in managing inventories especially where the products are not fast-moving. At the same time, in economies characterized by economic uncertainties, firms often find themselves unable to have a consistent flow of inventories (Koumanakos, 2008). This implies that inventory management is affected by both firm-specific as well as economy-specific variables. The reliance on the structure-conduct-performance (SCP) framework used by economists is not sufficient to explain those factors which impinge on inventory investment. There exists a range of other firm-level, industry and macroeconomic factors that influence inventory investment levels. Furthermore, Guariglia and Mateut (2010) argued that financial variables play a strong and significant effect on inventory investment.
Koumanakos (2008) explained that firm performance is only one factor that may influence the level of investment in inventories. Variables such as size, capital structure (debt and equity), size of the board, level of cash holdings and level of capital investment have been found to have significance in relationships examining the effect of inventory management on firm performance (Hall, 1993; Bart and Baetz, 1998; Shin and Soenen, 1998; Deloof, 2003; Lazaridis and Tryfonidis, 2006; Banos-Caballero et al., 2010; Gill et al., 2010). Grawoig (1967), in his discussion on the paper by Professors Manes and Samuels titled “Inventories and sales: A cross section study” posited that relying on annual aggregate data provides in adequate information to ascertain company policies. In such a case, interviewing company officials would provide a better perspective regarding inventory management.
Building on the previous studies, this study aims at establishing firstly, whether firms have a target inventory investment level. Secondly, the study aims at investigating the effect of various determinants on the level of inventory holdings. To explain the significance of the determinants, the study further examines inventory management practices, techniques, financing and challenges.
Operations management research has found that holding excess inventories consumes space, creates financial burden and increases the risks associated with holding too much inventories. Excess investment in inventories may also depict inefficiencies in inventory management. Reducing the level of inventories is in line with the lean production concept although, variation in demand patterns limits the application of this concept (Womack et al., 1990; Rajagopalan and Kumar, 1994). On the other hand, studies on the relationship between inventory management and performance have produced mixed results. Using varied control variables, some studies have established a positive relationship (Huson and Nanda, 1995; Blazenko and Vandezande, 2003; Capkun et al., 2009; Gill et al., 2010; Mathuva, 2010; Eroglu and Hofer, 2011) between inventory management and corporate profitability. Other studies have established a negative relationship (Deloof, 2003; Garcia-Teruel and Martinez-Solano, 2007; Koumanakos, 2008; Samiloglu and Demirgunes, 2008; Falope and Ajilore, 2009). This inconsistency in findings on the same subject motivated the present study which examines what factors, in addition to profitability, can be used to explain the corporate decision on inventory holdings.
To examine the determinants of inventory investment, the study employs various regression approaches on 341 firm-year observations. The results indicate that inventory holdings are influenced by the firm’s ability to generate internal resources (cash from operations), capital expenditure, firm’s growth opportunities, sales forecast volatility, net profit margin and the cash conversion cycle. The findings provide limited evidence that firm size is a determinant of inventory holdings. Collectively, the study reveals that corporate inventory holdings are influenced by the sustainability position of the firm.
MATERIALS AND METHODS
The theory on inventory management suggests that inventory decision making involves managing the basic trade-offs among costs, customer service-level objectives and various other constraints. Studies have shown that firms hold inventories for three reasons: the production smoothing reason, stock out avoidance and according to the (S-s) model of inventory investment. This means that inventory management decisions are multi-faceted and one has to examine all the facets to arrive at the profit-maximizing level of investment in inventories. With the major focus being on costs, inefficiencies in managing inventories have always been experienced. This is because, there are other factors which influence how much inventories to be held at any given instance. A huge investment in inventories has associated opportunity costs which arise as a result of the firm forgoing other productive investments (Banos-Caballero et al., 2010).
In line with the transactions costs theory, the entire process of providing or acquiring information so as to satisfy stakeholders’ informational needs involves transaction costs (Mian and Smith, 1992). The strategy firms strive to adopt is to cut down transaction costs. This forces firms to adopt strategies whose benefit is perceived to exceed the cost. For instance, in inventory management, firms are keen on reducing the holding and ordering costs. In financing the inventories, firms opt for cheaper trade credit financing rather than seeking external finance in line with the pecking-order theory. This means that firms will invest resources where they expect to achieve the greatest marginal returns. This implies that the less the investment in working capital, the less the transaction costs and the better the returns (Howorth and Westhead, 2003).
If capital markets were perfect, holding inventories would be irrelevant. If inventories turn out to be unexpectedly low, firms can easily source for inventories seamlessly. In such a case, the holding and ordering costs would be kept to their minimum. In such a world, inventory holdings would have no opportunity costs. Thus, if a firm invests in inventories, shareholder wealth would remain unchanged. However, this is not usually the case. Firms are exposed to uncertainties surrounding the level of inventories to be maintained at any given period. Uncertainties in the supply-chain compound the problem. This explains why buffer stocks are maintained to cater for stock-outs. The size of optimal inventory order (i.e., the quantity S-s) is determined by the marginal benefits of holding inventories and the marginal cost of holding inventories. Marginal benefits in this case include the benefits of avoiding stock-outs while the costs include cost of finance. The optimal inventory order would be found where the marginal benefits are equal to the marginal costs of holding inventories. Holding an additional dollar in inventories reduces the probability of stock-outs and decreases the cost of being short of inventories. The optimal theory of holding inventories has to address the issue why it is more efficient for a firm to hold an additional dollar in inventories instead of pursuing leaner production techniques such as just in time. Figure 1 illustrates these relationships.
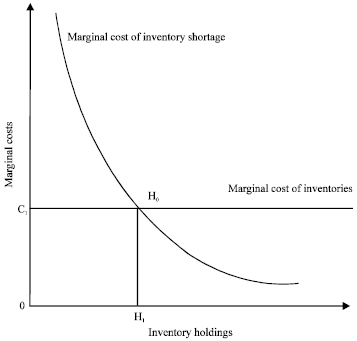 | |
| Fig. 1: | The marginal cost curve of being short of inventory assets, the optimal inventory holding is given by the intersection of the marginal cost of inventory assets and the marginal cost of inventory shortage (at point H0), C1: Associated cost, H1: Optimal inventory holding at this level, the marginal cost of inventories is assumed to be constant while the marginal cost of inventory shortage is decreasing, as more inventory assets are acquired, the marginal cost of running out of stocks is drastically reduced |
Figure 1 shows the marginal cost curve of inventory shortage and the marginal cost of inventory holdings. The marginal cost curve of holding inventories is assumed to be constant and horizontal while the marginal cost of inventory shortage is downward sloping. In line with the transactions cost model, the cost of holding inventories is the finance cost required to acquire them while the benefit is continued business. If the firm experiences a shortage in inventories, it can deal with the shortage through utilizing its internal resources, aggressive collection policies, negotiating with suppliers for the extension of trade credit or even raising external finance. The more the shortage, the more the costs incurred. If the cost of running out of stocks or the probability of running out of stocks rises, the marginal cost curve shifts to the right and this increases the firm’s holdings in inventory assets. One would expect costs associated with inventory shortages to be lower for publicly listed firms with wider access to finance sources. Such firms can negotiate to extensions of trade credit since they have greater bargaining power and this becomes more pronounced if their debt ratings are high. Firms with large inventory holdings can sell the inventories hence converting them into cash and repay debt. This further explains why as inventory holdings increase, costs of shortage decrease.
Less constrained firms can invest resources in a particular area of working capital management that is perceived to be associated with the highest marginal return (Howorth and Westhead, 2003). Blinder and Maccini (1991) suggested that firms which hold large amounts of inventories are able to reduce ordering and supply costs. But this means that they have to contend with increased holding costs in case their inventories do not sell fast. The implication of this is that, firms are expected to weigh the costs versus the benefits associated with the investment in inventories and evaluate its implication on the firm’s performance. In addition to addressing potential agency conflicts related to sourcing external finance, Summers and Wilson (2000) explained that trade credit is a cheaper way of financing working capital.
Various factors affect the corporate decision on inventory investment levels. To start with, inventory investment is largely affected by macroeconomic factors such as inflation and cyclical changes in the economy. For instance, Blinder and Maccini (1991) found that recessionary periods are associated with a reduction in inventory levels. Gaur et al. (2005) and Gaur and Kesavan (2009) found that the inventory turnover should not be used on its own in performance management. This is because an increase in inventory turnover as a result of unexpected sales volume does not indicate improved capacity to manage inventories well. Conversely, Kolias et al. (2011) posited that in sales-declined regions, a change in sales levels brings about bigger changes in inventory turnover. Flanagan (2005) explained that maintaining large inventory levels strains cash resources of a business.
On the contrary, maintaining insufficient inventory levels is associated with lost sales and delays in selling to customers. Kolias et al. (2011) examined the determinants of the inventory turnover for Greek retail firms for the period 2000 through 2005. Using an inventory turnover model, the results show that the inventory turnover ratio has negative relationship with gross margin. The findings also show that the inventory turnover is positively related with capital intensity and sales surprise measure. This means that, in line with the transactions cost theory, the finance manager has to strike a balance when managing inventories such that a firm does not hold too much or insufficient inventories. Based on these findings, it is important to identify methods and applications to improve inventory management among firms over time. The present study finds that firms are opting for optional inventory management options for instance consignment stocking. Deloof (2003), Garcia-Teruel and Martinez-Solano (2007), Samiloglu and Dermigunes (2008) and Falope and Ajilore (2009) found that there is a negative relationship between profitability and the inventory conversion period. This implies that the longer the time inventory is tied in the firm, the less the amount of working capital available and hence, the lower the profit. At the same time, holding inventories for a longer period of time in the firm may lead to increased transaction costs in the form of an increase in holding and related costs. This has a negative effect on the profitability of the firm. By holding inventories for too long, agency problems may arise since the firm is not maximizing the return on the shareholder’s investment. However, Lazaridis and Tryfonidis (2006) found the negative relationship between the inventory period and profitability not being statistically significant. Raheman and Nasr (2007) found that the coefficient of inventory turnover in days is negative and highly significant. They further deduce that if the inventory takes more time to sell, it will adversely affect profitability. Deloof (2003) explained that the negative relation between inventory and profitability can be caused by declining sales, leading to lower profits and more inventories.
Previous studies have deployed various metrics to measure inventory management. Studies such as Deloof (2003), Lazaridis and Tryfonidis (2006) and Padachi (2006) have used the inventory conversion period. Gaur et al. (2005) used the inventory turnover. In addition to these two measures of inventory management, this study uses inventory investment as a dependent variable. This is based on the premise that in order to assess the determinant variables on the level of investment in inventories, the amount of funds spend on inventory acquisition would form the best measure. This variable has been calculated as:
Various determinants of inventory investment
Ability to generate internal resources: In line with pecking-order hypothesis, external sources of finance have a higher cost. If a firm uses external finance, this may lead to agency problems between the interests of the shareholders and bondholders (Myers, 1977). This makes firms to prioritize resources generated internally over external sources of finance such as debt or new equity issues. Shortage of these internal resources may constrain the investment in inventories. Studies have shown that inventory investment is sensitive to cash flows, especially in manufacturing firms (Fazzari and Petersen, 1993).
In the case of publicly listed firms, they are exposed to wider sources of finance. Thus, they are capable of granting more trade credit (Petersen and Rajan, 1997; Niskanen and Niskanen, 2006). Large firms are also able to source large inventories on credit and even take as long as they wish to pay their suppliers. Buzacott and Zhang (2004) explained that inventory can be financed through an increase in payables, decreasing receivables by accelerating customer payments or factoring receivables, increasing gross profit, increasing equity and borrowing.
Small (2000) posit that, compared to larger firms, there exists a smaller effect of inventory investment on cash flows among smaller firms. Conversely, Carpenter et al. (1994) and Gertler and Gilchrist (1994) found that, compared to larger firms, inventory investment of smaller firms is more sensitive to current cash flow. Carpenter et al. (1994) found that a positive relation exists between inventory investment and cash flows for both large and small firms. Small (2000) found that the effect of cash flow on inventory investment is concentrated among firms that are financially constrained by either their financial policy or liquidity as measured by the current ratio. Small establishes a significant positive impact of cash flow on inventory investment. The firm’s ability to generate internal resources (CFLOW) was measured as the ratio of net profit before extraordinary items plus non-cash charges scaled by total assets. The bulk of the non-cash charges include depreciation and amortization expenses. This variable was used since it is the most appropriate variable for representing a firm’s ability to generate internal resources. Based on previous studies, a positive relationship between the firm’s ability to generate internal resources and inventory investment is anticipated.
Capital expenditure: Empirical literature shows that the level of investment in inventories has an effect on capital expenditure. Inventory investment may be accompanied by additional investments in warehouses, information technology, and inventory and logistics management systems (Gaur et al., 2005). All these entail investments in capital expenditure, whether tangible or intangible. The investment in warehouses enables the firm to reduce its safety stock levels and rebalance stocks. Conversely, increased investment in inventories could also result to a decline in capital investment. Fazzari and Petersen (1993) demonstrated that capital expenditure competes for funds with levels of working capital when firms have financial constraints. The availability of profitable capital investments means that, if faced by liquidity constraints, the firm would have to forego better investments. This implies that increased investment in inventories decreases funds available for capital investment. Capital investment has been measured as total non-current assets scaled by total assets. Since, extant literature has provided mixed results between capital expenditure and inventory investment, no anticipated relationship is expected.
Growth opportunities: Scherr and Hulburt (2001) posited that firms that have grown well over a certain period are better prepared to continue to grow into the future. The growth potential of the firm, measured by the growth in sales, may have an impact on the level of inventory investment. Firms build up inventories in anticipation of future sales growth (Kieschnich et al., 2006). This practice is meant to guarantee the firm future sales even if there are disruptions in the supply of inventories. Blazenko and Vandezande (2003) found that inventory investment is positively related to expected sales. Small (2000) argue that the change is sales has a significant positive effect on inventory investment. Small further explains that an increase in sales causes firms to increase their inventory investment so as maintain a target level of inventories. Further, Rotemberg and Saloner (1989) observe that the positive relationship between corporate inventories and sales is greater for more concentrated industries. Tunc and Gupta (1993) found that inventory turnover has no effect on the level of sales. Sales growth was measured as: (this year’s sales less prior year’s sales) scaled by prior year’s sales. Based on prior research, it is difficult to anticipate the nature of relationship between sales growth and inventory holdings.
Volatility in expected sales: Inventory investment can be affected by unexpectedly high or low sales. For instance, if the levels of sales realized in a given period are higher than the forecast sales, then the average inventory level for that period will be lower than expected (Gaur et al., 2005). This means that if the actual sales are higher than forecast sales, inventory investment drops. The outcome will be reversed if lower sales are realized relative to the forecast sales. Gaur et al. (2005) found that sales surprise is positively related with inventory turnover. Sales forecasts are best derived from management forecast. However, these forecasts comprise internal information which is not publicly available. Owing to this, the Holt’s linear exponential smoothing method is used to estimate forecast sales from historical data (Holt, 2004). The sales forecast of firm i at time t is derived as:
where, Li, t-1 and Ti, t-1 are smoothed series defined as:
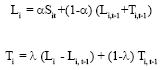 |
where, 0<α<1 and 0<λ<1. Both α and λ are weighing constants and both are equal to 0.75.
Owing to the stock-out avoidance behavior by firms (Kahn, 1987). Carpenter et al. (1994) explained that target inventory levels for finished goods are usually related to expected sales. In such a case, an inventory accelerator is required to explain part of the inventory investment volatility. Thus, the Sales Surprise (SS) measure was used. This variable was obtained as:
Based on the previous studies, a negative relationship is anticipated between sales surprise and inventory investment.
Operating performance: Inventory holdings has been found to have an effect on operational performance (Deloof, 2003; Lazaridis and Tryfonidis, 2006; Koumanakos, 2008; Gill et al., 2010). The direction of the relationship between inventory management and operating performance has not been clear. Furthermore, prior studies have failed to explain whether the level of investment in inventories drives profitability or vice versa. This paper addresses this issue through the deployment of estimation models which are robust for endogeneity. Specifically, Blazenko and Vandezande (2003) found a significant positive relationship between gross profit margin and finished goods inventories. They argue that profitability is deterrent to stock-outs. Dudley and Lasserre (1989) hold that timely and informative data on customer demand can result in improved firm performance through reduced inventories. Likewise, Huson and Nanda (1995) found that the improvement in inventory turnover following the adoption of just-in-time led to an increase in earnings per share. Deloof (2003) established a significant negative relation between gross operating income and inventory conversion period. Conversely, Gaur et al. (2005) established a negative correlation between annual inventory turnover and gross margin. Vastag and Whybark (2005) and Boute et al. (2004) found an insignificant relationship between inventory turnover and performance. Other empirical studies such as Capkun et al. (2009) and Eroglu and Hofer (2011) have documented a positive impact of efficient inventory management practices on firm performance. Koumanakos (2008) revealed that the higher the level of inventories preserved (departing from lean operations) by a firm, the lower its rate of returns. Using both the gross profit and net profit margins, Koumanakos (2008) established that a significant negative relationship exists between inventory conversion period and profitability. In this study, the operating performance has been measured using the Net Profit Margin before tax (NPM). This variable has been calculated as follows:
Based on results from previous studies, a negative relationship is anticipated between operational performance and inventory holdings.
Length of the cash conversion cycle: The cash conversion cycle has been used as a comprehensive measure of working capital management. It measures the efficiency with which a firm manages its working capital components. Generally, one would expect the cash conversion cycle to be short for firms with multiple product lines and firms with low inventories relative to sales (Opler et al., 1999). Prior literature has demonstrated that firms should always strive to minimize the cash conversion cycle to maximize profitability and create value for the shareholders (Deloof, 2003; Lazaridis and Tryfonidis, 2006; Gill et al., 2010; Mathuva, 2010). Soenen (1993) further pointed out that long cash conversion cycles have close relationships with firms going bankrupt. The relationship between cash conversion cycle and inventories has never been clear though. As discussed previously, studies such as Huson and Nanda (1995), Blazenko and Vandezande (2003), Gill et al. (2010) and Mathuva (2010) established a significant positive relationship between the cash conversion cycle and inventory conversion cycle. Conversely, Deloof (2003), Garcia-Teruel and Martinez-Solano (2007), Samiloglu and Dermigunes (2008) and Falope and Ajilore (2009) found a significant negative relationship between inventory conversion period and corporate profitability. This study extends these studies by examining the effect of the cash conversion cycle on inventory investment, this time deviating from inventory conversion period. The cash conversion cycle is calculated as follows:
Since, previous studies have provided mixed findings on the effect of the cash conversion cycle on inventory holdings, it becomes difficult to anticipate the nature of relationship between these two variables.
Firm size: Though disputed by Small (2000), firm size has been used to separate financially constrained firms from financially stable firms. For instance, Carpenter et al. (1994) argued that firm size has an effect on the firm’s ability to obtain finance. The general proposition is that, compared to smaller firms, larger firms have a wider access to finance. As a consequence, larger firms are less likely to be financially constrained. Inventory investment is largely affected by the size of the firm. According to Carpenter et al. (1994) inventory investments between small and larger firms differ largely owing to the cash flow volatility. They found that inventory investment of smaller firms is more sensitive to cash flows compared to larger firms. Chiou et al. (2006) found that as firm size increases, working capital requirements increase. This implies that as the firm grows the investment in inventories increase. On the contrary, Eroglu and Hofer (2011) found a positive relation between the natural logarithm of assets (a proxy for firm size) and raw materials, work-in-progress and finished goods inventories. A positive relation between firm size and inventory holdings is thus anticipated. In this study, firm size was measured as the natural logarithm of sales.
Leverage: Financing inventories through debt can be quite costly to a firm. This is because the firm will be expected to pay a higher premium for obtaining external sources of finance. Studies have found that leverage negatively affects inventory investment of United Kingdom firms (Benito, 2005; Bagliano and Sembenelli, 2004; Huang, 2003). Conversely, Campa and Shaver (2002) established a positive relationship between the debt to assets ratio and inventory investment. In this study, leverage was calculated as: (short-term loans+long-term loans) divided by total assets. Based on prior literature, it is difficult to anticipate any relationship between leverage and inventory holdings.
Liquidity: Inventory fluctuations can be explained by factors such as unexpected sales shocks (as measured by sales surprise discussed earlier) and liquidity levels. Kashyap et al. (1994) posited that inventory investment is liquidity-constrained especially during recessionary times. The level of investment in inventories by a firm is influenced by the level of liquid assets that it holds especially cash, cash equivalents and receivables. Small (2000) held that a fall in the firm’s current ratio below its ‘normal’ level is a warning sign of looming liquidity problems. Firms with low inventories relative to sales are expected to hold less liquid assets. This study uses a more refined measure of liquidity (i.e., quick ratio) in its estimation models to assess the influence of firm’s liquidity on the level of inventory investment. Following these arguments, it becomes difficult to anticipate any relationship between liquidity and inventory holdings. The quick ratio has been calculated as follows:
Age: Prior literature has used firm age to represent the length of existence of the firm in the industry. Age of the firm has been found to have an association with the firm’s ability to obtain external finance (Niskanen and Niskanen, 2006; Banos-Caballero et al., 2010). The age of a firm determines its creditworthiness with suppliers of both debt and equity. More established firms are able to acquire external finance easily and under less stringent conditions (Chiou et al., 2006; Berger and Udell, 1995). Age has been used to control for the length of a firm’s existence in the industry (Howorth and Westhead, 2003) and the time the firm has known its customers. This paper has been calculated as the natural logarithm of years since incorporation.
Economic conditions: The external economic environment is believed to impact on inventory investment. Economic cycles exert pressure on short term financial and operations management of a firm. For instance, during recessions, inventory investments decline drastically (Blinder and Maccini, 1991). Carpenter et al. (1994) and Kashyap et al. (1994) showed that the rate of growth in gross domestic product affects the investment in working capital and consequently, the investment in inventories. To assess the influence of economic conditions on inventory investment, the growth in gross domestic product and the inflation rate were used.
RESULTS
Data and univariate analysis: Data for the study were collected from the financial statements of 28 non-financial firms listed on the Nairobi Securities Exchange for the period 1996-2008. The financial data were obtained from the Capital Markets Library. Structured questionnaires were also administered to 20 of the 28 firms in the sample. The financial data is made up of 341 firm-years. The missing 23 firm-years were due to missing numbers. The sample comprised of non-financial firms only. This was because the inventories held by these firms were primarily for trading in the ordinary course of the business as defined in International Accounting Standard 2: Inventories. Banking, investment, some commercial and services firms and telecommunication firms were omitted from the study. This is because the definition of inventories for these firms differs from the one adopted in this study.
The present study measured inventory investment as: Ending inventories scaled by total assets. The inventory turnover ratio was also calculated. This was obtained as: cost of sales scaled by total inventories. Table 1 presents the summary statistics of the key variables used in the analysis on a sectoral basis. Wernerfelt (1984) argued that some firm effects exist on strategies and performance levels by firms in the same industry. Thus, an industry-wide analysis helps in establishing whether these differences exist. This proposition necessitated univariate industry-wide analysis of the results. The details of these variables are provided in Table 1 and 2.
| Table 1: | Summary statistics of the variables for each sector |
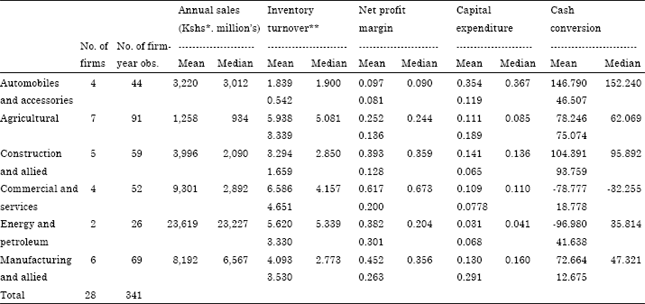 | |
| Inventory turnover has been measured as: Cost of sales scaled by ending inventories, the net profit margin is calculated as net profit before tax divided by sales, Capital expenditure has been calculated as non-current assets scaled by total assets, values are Mean±SD across all observations in the respective sectors except for annual sales which are represented in Kenya Shillings (Kshs), for the purpose of this study, firms listed under banking, insurance, investment and telecommunications and technology sectors were omitted because their definition of inventories is different from what is being examined under the present study, *At the time of writing the research article, 1 U.S. Dollar = 82.35 Kenya Shillings, **It was observed that majority of the firms in the sample applied the first-in, first-out method in valuing their inventories hence there was no need of splitting the analysis based on the inventory accounting policy choice, while we acknowledge that the accounting policy choice influences inventory investment (Cushing and LeClere, 1992), Kenyan firms do not use the last-in, first-out method as it is not permitted by the International Financial Reporting Standards (IFRSs) | |
| Table 2: | The univariate comparison of means and medians of key liquidity and inventory ratios for 341 firm-years from the 1996-2008 sample of firms listed on the NSE |
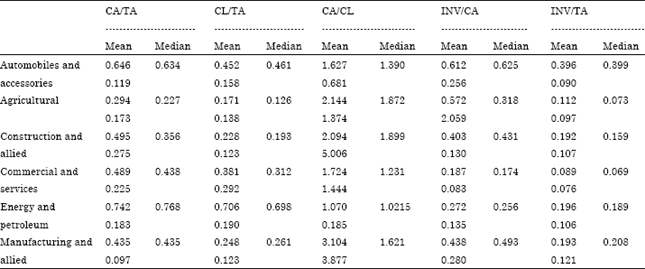 | |
| The means and medians of the selected liquidity and inventory ratios show the importance of current assets (and inventories in particular) and liabilities for the selected sample by industry sector, CA: Current assets, TA: Total assets, CL: Current liabilities, INV: Inventory | |
Table 1 shows that firms listed under the commercial and services sector have the highest inventory turnover ratios (Mean = 6.59 times) compared to those listed under automobiles and accessories which have the lowest inventory turnover (Mean = 1.84 times). Interestingly, commercial and services firms have impressive average sales, net profit margins and high capital investments.
Table 2 shows that current assets and current liabilities are important in the management of working capital. With regard to inventory investment, firms listed under automobiles and accessories segment have the highest proportion of inventories to current assets (Mean = 61.20%). These firms also have the highest proportion of inventories to total assets (Mean = 39.60%). As expected, commercial and services sector firms report the lowest inventory to current assets proportions (mean = 18.70%) and inventory to total assets proportion (Mean = 8.90%).
In addition to the univariate analysis, various regression models were used to examine the determinants of inventory investment. These included the pooled ordinary least squares, fixed effects estimation and two-stage least squares estimations. The aim of incorporating varied regression models was due to two reasons. First, the fact that panel data was being used, using regression analysis helps in removing firm-specific characteristics which may interfere with the results. Secondly, regression models such as the two-stage least squares helped address the endogeneity problem which might be present amongst the variables under examination. The pooled and the fixed estimation models were used to confirm the consistency of the results after controlling for possible endogeneity. The overall strength of the models was examined using the F-test while the Durbin Watson statistic was used to test for independence of observations. The variance inflation indicators were utilized to check whether multicollinearity was a problem amongst the identified variables. In general, the Durbin Watson statistic ranged between 1.1-2.6 implying absence of autocorrelation.
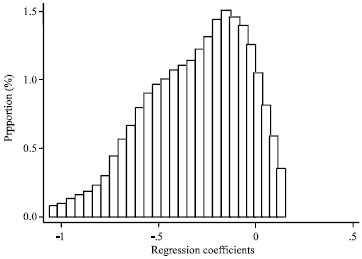 | |
| Fig. 2: | Distribution of the regression model coefficients on the lagged change in the inventory investment level, the coefficients have been obtained from the firm-wise regression: ΔINVit = β0+β1 ΔINVi,t-1+εit where Δ is a first difference operator and time steps are annual, the inventory investment level is defined as total inventories scaled by total assets. The figure included information on 28 firms listed on the Nairobi Securities Exchange for the 1996-2008 period, the mean (median) coefficient is -0.293 (-0.226) |
The variance inflation indicators ranged between 2.0-3.0 implying absence of multicollinearity. These ranges are in line with standard econometric ranges as per Montgomery and Peck (1982) and also Chatterjee and Price (1977).
Determinants of inventory holdings
Do firms exhibit a target inventory investment level?: To examine the determinants of inventory holdings, the investment in inventories (INVit) was modeled as a function of the lagged inventory investment variable (INVi, t-1) in addition to other determinants identified by literature and theories. To establish whether the corporate investment in inventories is mean reverting (implying an adjustment towards a set target), an estimation using a first order autoregressive model for each firm in the sample was performed. The model used was as follows:
| (1) |
where, INVit is the inventory investment level by firm i in time t; INVi,t-1 is the prior year inventory investment level. It represents the influence of a long-run target inventory level (Guariglia and Mateut, 2010). εit is an independent and identically distributed disturbance with a mean of zero. Figure 2 illustrates the distribution of the beta coefficients (β1) obtained by performing firm-wide regressions for the period 1996-2008.
The negative mean (median) regression coefficient on the lagged change in inventory investment level implies that the inventory investment level is mean reverting. This mean reversion is skewed to the right implying that even though firms may have target inventory levels, these levels keep on fluctuating. One possible explanation for this is that firms may hold varied inventory levels especially where demand or supply is uncertain. Whichever the case, it appears that there are systematic factors that cause firms to set their inventory levels to certain levels such that they are neither too high nor too low.
The target inventory investment: Assuming a linear relationship exists, a target adjustment model can be modeled by incorporating the likely determinants of inventory investment as follows:
| (2) |
where, INVit* is the target inventory investment level of firm i at time t. CFLOWit represents the firm’s ability to generate internal resources, CAPEXPit represents the investment in non-current assets. SGit refers to the growth in sales. SSit represents sales surprise, estimated using Holt’s linear exponential smoothing method. NPMit represents the net profit margin ratio. SIZEit represents firm size. LEVit represents the debt position of the firm. QRit is the quick ratio. AGEit is the age of the firm. Finally, εit is an independent random disturbance.
Taking the partial adjustment model developed before, ΔINVit = α0+β ΔINVi,t-1+εit and incorporating the target adjustment model, the resultant model appears as follows:
| (3) |
If we adjust the target inventory investment (INVit*) towards a certain target using an adjustment factor, d, we obtain the following:
| (4) |
In this case, the coefficient on the factor, δ measures the rate of adjustment. Blinder and Maccini (1991) described ΔINVit in equation 3 as “anticipated” inventory investment while ΔINVit* is the “unanticipated” inventory investment.
If the coefficient on δ = 1, this means that the firms exhibit a perfect adjustment to the target inventory investment. If the coefficient on δ = 0, this means that the firms do not have a target inventory investment at all. Assuming that δ = 1, then:
INVit = INVit* holding α0, β1 and εit constant |
If this relationship holds, we can therefore combine Eq. 2 and 4 to arrive at the following model:
δ{(β0+β1CFLOWit+β2CAPEXPit+β3SGit+β4SSit+β5NPMit+β6SIZEit+β7LEVit+β8QRit+β9AGEit+εit)-INVi,t-1} = INVit-INVi,t-1 |
where, 0<δ<1, re-written as:
INVi,t-1+δ{(β0+β1CFLOWit+β2CAPEXPit+β3SGit+β4SSit+β5NPMit+β6SIZEit+β7LEVit+β8QRit+β9AGEit+εit)-INVi,t-1} = INVit |
where, 0<δ<1, therefore:
INVit = INVi,t-1-δINVi,t-1+δβ0+δβ1CFLOWit+δβ2CAPEXPit+δβ3Sgit+δβ4 Ssit+δβ5NPMit+δβ6SIZEit+δβ7LEVit+δβ8Qrit+δβ9AGEit+deit |
where, 0<δ<1, which gives us:
INVit = (1-δ)INVi,t-1+δβ0+δβ1CFLOWit+δβ2CAPEXPit+δβ3SGit+δβ4SSit+δβ5NPMit +δβ6SIZEit+δβ7LEVit+δβ8QRit+δβ9AGEit+ρit+ηi+δεit, where, 0<δ<1 |
This model can be re-written thus:
| (5) |
where, α0 = δβ0, Ω = (1-δ), ρk = δβk and υit = δεit and 0<δ<1.
Variable ρit represent the unobservable heterogeneity that captures both the specific firm characteristics and also the industry characteristics and the variable. ηi is a time dummy. The variable ηi also captures the macroeconomic variables (Gross domestic product and inflation rates) which are beyond a firm’s control. Finally υit captures the random disturbances.
Regression results: Table 3 presents panel regression results for the determinants of inventory holdings in the 1996-2008 period for all the independent variables discussed under literature review. Inventory investment has been used as the dependent variable in all estimation models. Six estimation models have been employed to examine the determinants of inventory holdings. The six models were used to provide robust results for the present study and compare them with previous studies. The use of various estimation models provides the opportunity to examine the differential influence of industry and the economy-specific variables on inventory holdings.
The first and second columns of Table 3 report estimates for a static model using Ordinary Least Squares (OLS) estimation and fixed effects models, respectively. The dependent variable is the Cash Conversion Cycle (CCC). The independent variables are ability of the firm to generate internal resources (CFLOW), capital expenditure (CAPEX), sales growth (SGROW), Sales Surprise (SS), Net Profit Margin (NPM), size of the firm (SIZE), leverage (LEV), liquidity (QR), age of the firm since incorporation (AGE), macroeconomic variables (inflation and GDP) and time and industry controls. Column 3 reports the results using the OLS model, this time incorporating the lagged dependent variable as an independent variable. The results show that inventory holdings increase significantly with decreases in the firm’s ability to generate internal resources, capital expenditure and the cash conversion cycle. The results also show that inventory holdings decrease significantly with increase in profitability as measured by the net profit margin. The results also show that the lagged dependent variable introduced as a dependent variable in model (3) is significant and positively related with inventory holdings. This finding suggests that inventory holdings are also determined by the previous inventory holdings. The coefficient on this variable is 0.71 implying that using the static models, firms adjust to target inventory investment levels quite slowly compare to the dynamic models 4-6 (the adjustment factor = 0.29). However, the OLS approach is insufficient in explaining fully the determinants of inventory holdings.
| Table 3: | Regression estimates on the determinants of inventory investment as identified in extant literature and theories |
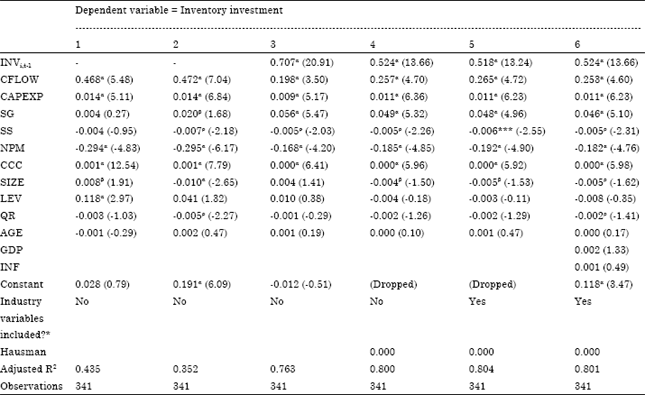 | |
| The dependent variable is the inventory investment, INVi,t-1 : Lagged dependent variable introduced as an independent variable, CFLOW: Measure of the firm’s ability to generate internal resources, CAPEXP: Level of investment on fixed assets, SG: Firm’s growth opportunities as measured by the growth in sales, SS: Variable capturing the deviation of actual sales from forecast sales, NPM: Net profit margin, CCC: Cash conversion cycle, α,ρ,βSignificant at 1, 5 and 10%, respectively, *In all estimation incorporating industry controls, the coefficients on the five out of six industry sectors were found to be significant SIZE is a measure of the firm’s size, LEV measures the firms debt level, QR is the quick ratio, AGE is the age of the firm since incorporation, GDP is the annualized growth in Gross Domestic Product (GDP) and INF is the annualized average rate of inflation, Hausman is p-value of Hausman (1978) test, we reject the null hypothesis of no endogeneity and conclude that the within-group estimations are consistent at the 1% level for models 4-6 | |
This is because OLS estimation produces inconsistent results even if there is no serial autocorrelation between the random disturbances, given that INVit is correlated with the time dummy, ηi. This is because the variables INVi, t-1 and υi,t-1 are correlated. Consequently, the OLS estimation produces inconsistent results due to the correlation existing between ΔINVi, t-1 and Δυi,t-1. Likewise, the OLS does not address possible endogeneity that exists between inventory investment and other variables. Studies have used inventory investment as both a dependent as well as an independent variable. This implies that inventory holdings are influenced by the identified independent variables as well as influencing the independent variables. To address inconsistency in estimation and endogeneity, two-stage least squares estimation models are used to model the endogeneity of the determinants of corporate inventory holdings. Arrelano and Stephen (1991) explained that using two stage estimation models reduces inconsistency, increases efficiency and addresses heteroskedasticity of the disturbances. Models 4-6 in Table 3 report the results using two-stage least squares estimation models. Model (4) has been estimated using the two-stage least squares estimation without the industry controls; Model (5) has been estimated using the two stage least squares estimation whilst incorporating industry controls and Model (6) has been estimated using the two-stage least squares estimation with the inclusion of both the industry dummies and two other exogenous independent variables, the growth in the Gross Domestic Product (GDP) and the inflation rate. To formally test for endogeneity, the Hausman’s test for contemporaneous correlation between the disturbances and inventory investment is carried out (Hausman, 1978). Thus, the null hypothesis of no endogeneity at the 1% level for models 4-6 is rejected. A discussion is presented based on the results from models 4, 5 and 6.
In Table 3, Model (1) has been estimated using the ordinary least squares without incorporating industry controls; Model (2) has been estimated using the fixed effects estimation without industry controls; Model (3) has been estimated using the ordinary least squares, this time incorporating the lagged dependent variable as an independent variable; Model (4) has been estimated using the two-stage least squares estimation without the industry controls; Model (5) has been estimated using the two stage least squares estimation whilst incorporating industry controls and Model (6) has been estimated using the two-stage least squares estimation with the inclusion of both the industry dummies and two other exogenous independent variables, the growth in GDP and the inflation rate. Heteroskedastic-consistent standard errors are used to compute t-values, which are shown in parentheses.
The inferences in Table 3 are based on estimation models 4-6. Table 3 shows that the lagged inventory investment variable (INVi,t-1) is significant (p<0.000) and positively related with inventory investment (INVit). On average, the coefficient on this variable is 0.52 implying that the speed of adjustment (δ) is 0.48. This means that firms do not adjust to their target inventory investments level immediately. This observation can be explained by the stochastic nature of inventory management. The optimal quantity to be held depends on the firm’s needs, the level of buffer stock and other external factors. To explain this further, Blinder and Maccini (1991) and Carpenter et al. (1994) explained that combining the three types of inventories (i.e., raw materials, work-in-progress and finished goods) yield a lower estimated adjustment coefficient.
Consistent with Small (2000) and Carpenter et al. (1994), the results show that the firm’s ability to generate internal resources (CFLOW) is positively related with inventory investment levels. This finding implies that inventory investment rises with an increase in the firm’s ability to generate internal resources. Owing to improved sales and profit margins, the firm is capable of investing more and more resources in inventories to generate better returns. An improvement in internal funds raises the firm’s investment in inventories and a reduction in debt. In this case, changes in the firm’s ability to generate internal resources are a major factor in inventory investment. Whether the firm accumulates the internal resources to primarily invest in inventories or repay debt is a subject open for further examination. Interestingly, this study establishes that debt is insignificant in explaining inventory investment. As observed from the data collected, majority of the firms in the sample had low debt levels. This observation may be taken to imply that most firms are less constrained in their investment decisions and thus they are capable of utilizing internally generated funds to acquire more inventories, unless they have any debt to repay.
Contrary to Gaur et al. (2005) inventory investment is positively related to capital expenditure. Investment in capital expenditure assets such as warehouses, information systems and management control systems increase with an increase in the level of investment in inventories. Increased storage needs drive the need for an additional warehouse, a more robust information system and more inventory controls to minimize inventory losses. Again, we do not expect capital expenditure to be financed by working capital. Inventory investment is usually financed by working capital. Thus increases in inventory investment can be explained by increases in internal resources or an increase in working capital. This means that firms investing more in inventories are likely to experience increased investment in capital assets to accommodate the increase in inventories.
Consistent with Blazenko and Vandezande (2003) firms holding more inventories have higher growth prospects. This finding supports the view by Kieschnich et al. (2006) that firms pursuing aggressive growth strategies are more likely to acquire more inventories in anticipation of future sales growth. Changes in sales affect inventory investment in two ways. First, an increase in sales causes firms to acquire more inventories to replenish their stocks. Secondly, increased sales imply increased internal resources, which can be utilized to acquire more inventories. To address the stochastic nature of inventory management, firms amass inventories when they realize that their products are fast moving. This helps cater for any uncertainties involved and also ensure business continuity.
The results show that unexpected sales (i.e., sales surprise) are negatively related to inventory investment levels. In confirmation of the results by Gaur et al. (2005), the findings imply that increased uncertainties in sales levels lead to a reduction in inventory levels. The findings suggest that positive sales surprises are associated with reduced inventory levels. Positive sales surprises arise when the actual sales are higher than forecast sales. Similarly, negative sales surprises are associated with increased inventory investment. The stock-out avoidance behavior explained by Kahn (1987) pushes firms to cut on inventory investment if less than forecasted sales are anticipated.
Consistent with Koumanakos (2008), increased inventory investment leads to a decrease in operating performance as measured by the net profit margin before tax. This finding implies that the cost of holding inventories includes the lower rate of return on these assets because of reduced sales and an increased opportunity cost of working capital being tied up. In as much as holding inventories has its own benefits such as prevention of stock-outs and ensured business continuity, holding too much inventories is detrimental to firm’s profitability. Departures from lean operations lead to decrease in profitability. This finding contradicts the findings by Gaur et al. (2005) who found that a negative relationship between inventory turnover and gross profit margin exists. The findings also contradict with Blazenko and Vandezande (2003) who established that a positive relationship exists between gross profit margin and finished goods inventories. Essentially, an increase in inventory turnover (implying more sales and reduced inventories) should result into improved profitability. This proposition is further demonstrated by Huson and Nanda (1995) who found that the improvement in inventory turnover following the adoption of just-in-time led to an increase in earnings per share. To further strengthen this finding, Deloof (2003) established a significant negative relation between gross operating income and inventory conversion period. This means that a decrease in inventory conversion period (meaning increased inventory turnover and reduced investment in inventories) leads to improvements in profitability.
Firms with longer cash conversion cycles have higher inventory holdings. Longer cash conversion cycles are a characteristic of inefficient firms (Deloof, 2003). In line with Opler et al. (1999), firms with shorter cash conversion cycles have low inventories relative to sales. This implies that the lower the level of inventories, the lower the cash conversion cycle and the higher the profitability. This means that holding excess inventory levels is detrimental to the firm. Firms should strive to balance the trade-off between holding inventories and profitability.
The results provide limited evidence that firm size is inversely related with inventory investment. Contrary to Eroglu and Hofer (2011) and Chiou et al. (2006), smaller firms are likely to hold more inventories compared to larger firms. This could be explained by the fact that smaller firms are more prone to going bankrupt in case there are interruptions in inventory supply. To safeguard against this, they hold more inventories.
Finally, the study finds that leverage, quick ratio, age and the two macroeconomic variables (i.e. inflation and GDP) are insignificant in explaining inventory investment. Earlier findings showed that inventory investment in significantly influenced by the firm’s ability to generate internal resources. This implies that firms aiming to minimize agency problems would rather opt for internal sources of finance before borrowing to finance inventories. The quick ratio has been considered as a rather ‘static’ measure of liquidity. The insignificance of the quick ratio further questions the applicability of this ratio in examining inventory investment as explained by Emery (1984) and Kamath (1989). The study seems to find no significant relation between age and inventory investment. This could possibly be due to the fact that as argued out by Banos-Caballero et al. (2010) and Niskanen and Niskanen (2006), age determines the firm’s ability to obtain external finance. The present study found that inventory investment is primarily influenced by internal sources of finance. Leverage was found to be insignificant. Thus, whether more established firms are able to acquire external financing is beyond the scope of the present study and its findings.
With regard to the influence of macroeconomic factors on inventory investment, Blinder and Maccini (1991) found that recessions are related with drastic inventory reductions. Other studies have found significant impact of cyclical fluctuations on inventories of small firms than on those of bigger firms (Carpenter et al., 1994; Kashyap et al., 1994). However, the present study shows that inflation rates and the Gross domestic product have no effect on inventory investment. This finding may be explained by the fact that the present study examined a relatively shorter period (13 years) and these two variables were relatively stable over this period.
The adjusted R squared shows an improvement in the strength of the models when industry controls are included in both the ordinary least squares and the two stage least squares estimations. This means that there exists significant industry influence on inventory holdings.
CONCLUSION
In this study, a target adjustment model has been developed to investigate the determinants of corporate inventory holdings. A sample of 28 non-financial firms listed on the Nairobi Securities Exchange for the period 1996-2008 was used. The results show that firms maintain a target inventory investment level to which they attempt to converge. However, the results show that firms do not adjust to this target quickly which may be explained by the stochastic nature of inventory management. The results also indicate that firms with more capacity to generate internal resources, increased capital expenditure, strong growth opportunities, large firms and firms with longer cash conversion cycles tend to invest more in inventories. Firms with positive sales surprises, higher net profit margins hold fewer inventories than firms with negative sales surprises and lower net profit margins. The study provides limited evidence that debt, quick ratio, age and macroeconomic factors are determinants of inventory investment. This means that, more work needs to be done to find out more determinants of inventory investment. Collectively, the study finds that the determinants of corporate inventory holdings are influenced by the firm’s efficiency, performance and sustainability position. The findings from the study are useful to finance managers in determining what factors to consider when making inventory decisions.
REFERENCES
- Arrelano, M. and B. Stephen, 1991. Some test of specification for panel data: Monte Carlo evidence and an application to employment equations. Rev. Econ. Stud., 58: 277-297.
Direct Link - Bagliano, F.C. and A. Sembenelli, 2004. The cyclical behaviour of inventories: European cross-country evidence from the early 1990s recession. Applied Eco., 36: 2031-2044.
Direct Link - Banos-Caballero, S., P.J. Garcia-Teruel and P. Martinez-Solano, 2010. Working capital management in SMEs. Account. Finan., 50: 511-527.
CrossRef - Bart, C.K. and M.C. Baetz, 1998. The relationship between mission statements and firm performance: An exploratory study. J. Manage. Stud., 36: 823-853.
CrossRef - Benito, A., 2005. Financial pressure, monetary policy effects and inventories: Firm-level evidence from a market-based and a bank-based financial system. Economica, 72: 201-224.
CrossRef - Blazenko, G.W. and K. Vandezande, 2003. Corporate holding of finished goods inventories. J. Eco. Bus., 55: 255-266.
CrossRef - Blinder, A.S. and L.J. Maccini, 1991. The resurgence of inventory research: What have we learned?. J. Econ. Surv., 5: 291-328.
Direct Link - Boute, R., M. Lambrecht and O. Lambrechts, 2004. Did just-in-time management effectively decrease inventory ratios in Belgium? Econ. Manage., 49: 441-456.
Direct Link - Buzacott, J.A. and R.Q. Zhang, 2004. Inventory management with asset-based financing. Manage. Sci., 50: 1274-1292.
CrossRef - Capkun, V., A.P. Hameri and L.A. Weiss, 2009. On the relationship between inventory and financial performance in manufacturing firms. Int. J. Oper. Prod. Manage., 29: 789-806.
CrossRef - Carpenter, R.E., S.M. Fazzari and B.C. Petersen, 1994. Inventory investment, internal finance fluctuations and business cycle. Brook. Papers Eco. Activity, 25: 75-138.
Direct Link - Cushing, B.E. and M.J. LeClere, 1992. Evidence on the determinants of inventory accounting policy choice. Account. Rev., 67: 355-366.
Direct Link - Deloof, M., 2003. Does working capital management affect profitability of Belgian firms. J. Bus. Finance Accounting, 30: 573-588.
CrossRefDirect Link - Dudley, L. and P. Lasserre, 1989. Information as a substitute for inventories. Eur. Eco. Rev., 33: 67-88.
CrossRef - Emery, G.W., 1984. A pure financial explanation for trade credit. J. Finan. Quant. Anal., 19: 271-285.
Direct Link - Eroglu, C. and C. Hofer, 2011. Inventory types and firm performance: Vector autoregressive and vector error correction models. J. Bus. Logist., 32: 227-239.
Direct Link - Falope, O.I. and O.T. Ajilore, 2009. Working capital management and corporate profitability: Evidence from panel data analysis of selected quoted companies in Nigeria. Res. J. Bus. Manage., 3: 73-84.
CrossRefDirect Link - Fazzari, S.M. and B. Petersen, 1993. Working capital and fixed investment: New evidence on financing constraints. RAND J. Econ., 24: 328-342.
Direct Link - Garcia-Teruel, P.J. and P. Martinez-Solano, 2007. Effects of working capital management on SME profitability. Int. J. Manage. Finance, 3: 164-177.
CrossRefDirect Link - Gaur, V. and S. Kesavan, 2009. The effects of firm size and sales growth rate on inventory turnover performance in the U.Sretail sector. Int. Ser. Oper. Res. Manage. Sci., 122: 25-52.
CrossRef - Gaur, V., M.L. Fisher and A. Raman, 2005. An econometric analysis of inventory turnover performance in retail services. Manage. Sci., 51: 181-194.
CrossRef - Gertler, M. and S. Gilchrist, 1994. Monetary policy, business cycles and the behaviour of small manufacturing firms. Q. J. Econ., 109: 309-340.
Direct Link - Gill, A., N. Biger and N. Mathur, 2010. The relationship between working capital management and profitability: Evidence from the United States. Bus. Econ. J., 10: 1-9.
Direct Link - Grawoig, D.E., 1967. Discussion of inventories and sales: A cross section study. J. Accounting Res., 5: 157-159.
Direct Link - Guariglia, A. and S. Mateut, 2010. Inventory investment, global engagement and financial constraints in the UK: Evidence from microdata. J. Macroeconomics, 32: 239-250.
Direct Link - Hall, B.H., 1993. The stock market valuation of R and D investment during the 1980's. Am. Econ. Rev., 83: 259-264.
Direct Link - Holt, C.C., 2004. Forecasting trends and seasonal by exponentially weighted averages. Int. J. Forecasting, 20: 5-10.
CrossRef - Howorth, C. and P. Westhead, 2003. The focus of working capital management in UK small firms. Manage. Account. Res., 14: 94-111.
Direct Link - Huang, Z., 2003. Evidence of a bank lending channel in the UK. J. Bank. Finance, 27: 491-510.
Direct Link - Huson, M. and D. Nanda, 1995. The impact of just-in-time manufacturing on firm performance in the US. J. Operat. Manag., 12: 297-310.
CrossRef - Kashyap, A.K., O.A. Lamontand and J.C. Stein, 1994. Credit conditions and the behavior of inventories. Q. J. Econ., 109: 565-592.
CrossRef - Kolias, G.D., S.P. Dimelis and V.P. Filios, 2011. An empirical analysis of inventory turnover behaviour in Greek retail sector: 2000-2005. Int. J. Prod. Econ., 133: 143-153.
CrossRef - Koumanakos, D.P., 2008. The effect of inventory management on firm performance. Int. J. Productivity Perform. Manage., 57: 355-369.
CrossRef - Lazaridis, J. and D. Tryfonidis, 2006. Relationship between working capital management and profitability of listed companies in the athens stock exchange. J. Financial Manage. Anal., 19: 26-35.
Direct Link - Mathuva, D.M., 2010. The influence of working capital management components on corporate profitability: A survey on kenyan listed firms. Res. J. Bus. Manage., 4: 1-11.
CrossRefDirect Link - Mian, S.L. and C.W. J. Smith, 1992. Accounts receivable management policy: Theory and evidence. J. Finance, 47: 169-200.
CrossRefDirect Link - Myers, S.C., 1977. Determinants of corporate borrowing. J. Financial Econ., 5: 147-175.
CrossRefDirect Link - Niskanen, J. and M. Niskanen, 2006. The determinants of corporate trade credit policies in a bank-dominated financial environment: The case of Finnish small firms. Eur. Financial Manage., 12: 81-102.
CrossRef - Opler, T., L. Pinkowitz, R. Stulz and R. Williamson, 1999. The determinants and implications of corporate cash holdings. J. Financial Eco., 52: 3-46.
CrossRefDirect Link - Padachi, K., 2006. Trends in working capital management and its impact on firms' performance: An analysis of mauritian small manufacturing firms. Int. Rev. Bus. Res. Papers, 2: 45-58.
Direct Link - Petersen, M.A. and R.G. Rajan, 1997. Trade credit: Theories and evidence. Rev. Financial Stud., 10: 661-691.
CrossRefDirect Link - Raheman, A. and M. Nasr, 2007. Working capital management and profitability-case of Pakistani firms. Int. Rev. Bus. Res. Papers, 3: 279-300.
Direct Link - Rajagopalan, S. and K.R. Kumar, 1994. Retail stocking decisions with order and stock sales. J. Oper. Manage., 11: 397-410.
CrossRef - Rotemberg, J.J. and G. Saloner, 1989. The cyclical behavior of strategic inventories. Q. J. Econ., 104: 73-97.
Direct Link - Samiloglu, F. and K. Demirgunes, 2008. The effect of working capital management on firm profitability: Evidence from Turkey. Int. J. Applied Econ. Finance, 2: 44-50.
CrossRefDirect Link - Scherr, F.C. and H.M. Hulburt, 2001. The debt maturity structure of small firms. Financial Manage., 30: 85-111.
Direct Link - Shin, H.H. and L. Soenen, 1998. Efficiency of working capital management and corporate profitability. Finance Pract. Educ., 8: 37-45.
Direct Link - Summers, B. and N. Wilson, 2000. Trade credit management and the decision to use factoring: An empirical study. J. Bus. Finance Accounting, 27: 37-68.
Direct Link - Tunc, E.A. and J.N.D. Gupta, 1993. Is time a competitive weapon among manufacturing firms?. Int. J. Oper. Prod. Manage., 13: 4-12.
CrossRefDirect Link - Vastag, G. and D.C. Whybark, 2005. Inventory management: Is there a knock-on effect?. Int. J. Prod. Econ., 93-94: 129-138.
CrossRef - Wernerfelt, B., 1984. A resource-based view of the firm. Strategic Manage. J., 5: 171-180.
CrossRefDirect Link