
Chun-Teck Lye
Faculty of Business and Law, Multimedia University, 75450 Melaka, Malaysia
The International Journal of Applied Economics and Finance
Year: 2012 | Volume: 6 | Issue: 1 | Page No.: 17-28


ABSTRACT
This study uses Sortino ratio optimization approach to examine the risk-adjusted performance, returns and downside risks of growth and value stocks in Asian countries. Best, worst and equally-weighted country-level portfolios are constructed from the indices of the selected developed and emerging Asian countries. This study also uses price delay measures incorporated with rolling window method to scrutinize the market efficiency of growth and value stocks. The overall findings from sample period of 2 July 1997 to 28 September 2011 disclosed that the value stocks consistently outperformed the growth stocks in terms risk-adjusted performance, returns and downside risks. The results from rolling price delay measures revealed that the value stocks are relatively inefficient in comparison to growth stocks. Hence, the findings provide additional evidence in supporting the existence of value premium is attributable to the market inefficiency.
PDF Abstract XML References Citation
Received: August 04, 2011;
Accepted: November 21, 2011;
Published: January 06, 2012
How to cite this article
Chun-Teck Lye, 2012. The Performance and Efficiency of Growth and Value Stocks: Evidence from Asia. The International Journal of Applied Economics and Finance, 6: 17-28.
DOI: 10.3923/ijaef.2012.17.28
URL: https://scialert.net/abstract/?doi=ijaef.2012.17.28
DOI: 10.3923/ijaef.2012.17.28
URL: https://scialert.net/abstract/?doi=ijaef.2012.17.28
INTRODUCTION
Style investing such as growth and value investment tactics integrates strategies that classify potential assets based on their prospects. The value style investorsare constantly seeking for assets such as stocks that seem to be relatively underpriced to their intrinsic value. Value investors believe that eventually, they will be rewarded with higher investment returns when the market discovers the true value of the stock. Common characteristics of value style stocks include low price-to-earnings (P/E) and price-to-book (P/B) ratios and/or high dividend yield. On the other hand, the growth style investors favor stocks that are growing and are expected to continue to grow rapidly. Growth style stocks often have high P/E and P/B ratios with low dividend yield. Many studies have provided fascinating evidence suggesting that the total returns and/or risk-adjusted returns of value stocks outperform growth stocks (Fama and French, 1992, 1996; Lakonishok et al., 1994; Bauman et al., 2001; Liu and Wang, 2010). These exceptional returns of value style investments are more commonly known as the value premium. Fama and French (1998) advocated that the value premium is simply a reward for bearing extra risk seeing that value stocks are fundamentally riskier. On the contrary, in a recent study using Value-at-Risk as the risk measures, Liu and Wang (2010) revealed that the downside risks of value stocks are consistently lower than those of growth stocks in European, Asian and Scandinavian markets. Additionally, the research done by Bauman et al. (1998) has demonstrated that value style investing is more profitable with internationally diversified portfolios than the country-specific portfolios. Their findings also suggest that value portfolios offer more promising returns in the non-U.S. developed markets.
In light of these literatures, this study uses a different approach with contemporary data to revisit the extant findings. This study enriches the extant literature by providing more evidence from Asian countries. Best, worst and equally-weighted country-level portfolios are constructed from selected developed and emerging Asian countries by using Sortino ratio optimization approach. The method has demonstrated its competency in disclosing the ex-post risk-adjusted performance and returns and also the downside risks (Lye and Ng, 2010; Lye and Yusof, 2011). This study focuses on downside risk instead of standard deviation seeing that investors are naturally more concerned about potential losses rather than the overall volatility. This study also investigates the evolutions of market efficiency of growth and value stocks in Asian markets using price delay measures integrated with rolling windows approach.
MATERIALS AND METHODS
Bauman et al. (1998) have emphasized that to compose the intended international portfolios, same selection criteria should be consistently apply to identify the value and growth stocks in all country markets under consideration. Following the remark, this study therefore decides on the Morgan Stanley Capital International (MSCI) style indices to be the data for the present research seeing that MSCI categorize growth and value stocks using rigorous methodological framework, as well as clear and consistent sets of attributes. The present data comprise of MSCI All Country Asia index (MSCI AC Asia) and the MSCI growth and value indices of the 10 selected Asian countries. These style indices function as proxies of portfolios of growth and value stocks in China (CHN), Hong Kong (HKG), Indonesia (IND), Japan (JPN), KOREA (KOR), Malaysia (MAL), Philippines (PHI), Singapore (SGP), Taiwan (TWN) and Thailand (THL). All the weekly adjusted MSCI growth and value indices from 2 July 1997 to 28 September 2011 are sourced from Datastream. The preference of weekly (every Wednesday) data is to avoid asynchronous and any weekend effect in the data. The data are then transformed into logarithmic form of return series using:
| (1) |
where, Pt and Pt-1 are the closing price of the index on week t and t-1, respectively.
The first part of the empirical study involves the country-level portfolio construction via Sortino ratio optimization approach. Sortino ratio is a portfolio performance measure that measures the risk-adjusted returns of an investment portfolio (Sortino and Van der Meer, 1991; Sortino and Price, 1994). Sortino ratio is a variation of Sharpe ratio where it only penalizes downside deviations or returns that fall below a specified target. If we defined the difference between the return of asset i and the specified target T as:
| (2) |
Hence, the Sortino ratio can be defined as:
 | (3) |
where, E(r) is the expected returns and N is the total assets under consideration over the assessment period.
The portfolio’s weights are incorporated into Eq. 3 before the portfolio optimization process. Hence, for N assets under consideration, the optimal portfolio’s weights wm can be obtained by:
 | (4) |
where, wa = [wm -1] is a vector, Σ is the covariance matrix of the downside deviation and:
is the downside risk. The optimization of Eq. 4 is subjected to the weight of asset i is in the range of [0, 1] and the sum of all weights is equal to one. To ensure that optimal values are attained, this study uses the similar hybrid genetic algorithm and sequential quadratic programming employed by Lye (2011). The hybrid model has demonstrated its superiority in enhancing the performance and efficiency of Stutzer Index optimization.
This study constructs best, worst and equally-weighted portfolios from each set of Asian growth and value indices respectively. Similarly, the risk-adjusted returns and downside risks of growth and value indices from developed and emerging Asian countries are also carefully examined. The portfolios are rebalanced periodically at every 6-, 9- and 12-month period. In all cases, the MSCI AC Asia is used as the specified target in the Sortino ratio optimization throughout the experiment. Subsequently, the risk-adjusted performance and downside risks of each portfolio are obtained, whereas the risk-adjusted returns can be determined by multiplying the attained portfolio weights to the mean return of each asset for the same period. Finally, two-sample t-tests are used to evaluate the statistical differences between the means of risk-adjusted performance, returns and downside risks.
The second part of the empirical study analyzes the dynamics of market efficiency of growth and value stocks in Asian markets over time using price delay measures incorporated with rolling windows approach. The price delay measures can be applied to quantify informational efficiency at firm- and/or country-level (Mech, 1993; Hou and Moskowitz, 2005; Lim and Hooy, 2010). If ri,t is the return on stock i at time t, the measure can be established using the following regression equation:
| (5) |
where, Rt and Rt-k is the market excess return at time t and t-k, respectively. Following that, the price delay measures for n lagged returns at time t can be defined as one minus the ratio of the R2 computed from the least square regression of Eq. 5 by restricting δi, k = 0, to the R2 obtained from the same equation with no restrictions:
| (6) |
The price delay measure is an inverse measure of informational efficiency. In other words, a larger price delay measure would indicate lower degree of market efficiency.
Many studies have used rolling window approach to investigate the dynamics of market efficiency (Cajueiro et al., 2009; Lim, 2008; Cajueiro and Tabak, 2004). This study considers price delay measures for four (n = 4) lagged weekly returns and uses rolling window length of 1-, 2-, 3- and 4-year with five window steps to scrutinize comprehensively the performance and evolutions of market efficiency of growth and value stocks using MSCI AC Asia growth and value indices.
RESULTS AND DISCUSSION
The descriptive statistics of the data used in this study are presented in Table 1. The preliminary results disclosed that nearly all the value stocks average returns outperform the growth stocks, except for Hong Kong. On the other hand, the observations on the standard deviations or risks of the growth and value stocks are at mixed. Such preliminary findings might be misleading and it is still too early to conclude that the value stocks are more superior. The results deserve a closer examination. Further inspection on the skewness and kurtosis of the data revealed that these data are negatively skewed with fat-tail distribution seeing that most skewnesses have negative value and all the kurtosis values are greater than 3. The same findings are evident from the Jarque-Bera normality test where itrejectsthe null hypothesis that the data are normally distributed. Hence, the median maybe a better measure of central tendency than the mean in this situation. The returns found in terms of median showed that only the value stocks in Singapore, China, Indonesia, Korea and Thailand outperform the growth stocks. Since the preliminary results are inconsistent, therefore, a more rational and comprehensive study is needed.
| Table 1: | Descriptive statistics of data |
 | |
| Table 2: | Portfolio risk-adjusted performance, returns and downside risks |
 | |
| *indicates significant at 10% significance level | |
This study considers three different sets of portfolios to thoroughly scrutinize the performance of the style stocks in Asia. The first set of portfolios which consists of best, equally-weighted and worst portfolio are constructed from all the ten selected growth and value indices respectively using Sortino ratio optimization. These portfolios are reviewed periodically at every 6-, 9- and 12-month. Hence, a total of 18 portfolios are built at this stage.The results obtained from these portfolios are presented in the panel A of Table 2. Similarly, another two sets of portfolios or a total of 36 portfolios are composed via the same method, by utilizing the style indices from the corresponding developed and emerging Asian countries. The results from these portfolios are shown in the panel B and panel C of Table 2, respectively. Surprizingly, the results disclosed in Table 2 are nearly 100% consistent in presenting the out performance of value stocks over the growth stocks in terms of risk-adjusted performance and returns and also in term of downside risks.
| Table 3: | Cumulative portfolio risk-adjusted performance, returns and downside risks |
 | |
It is worth noting that even in the worst portfolio, the risk-adjusted performance and returns of the value stocks are also higher than the growth stocks. Only the 6- and 12-month downside risks of the worst portfolios constructed from the three developed Asian countries and the 6-month returns given by the best portfolio built from the seven emerging Asian countries are inconsistent with the rest of the results. The unswerving evidence of higher returns observed in developed Asian countries in comparison to the emerging Asian countries are in line with the findings of Bauman et al. (1998) where the value stocks offer better returns than growth stocks in non-U.S. developed markets. The relatively lower downside risks of value stocks found in this study are also consistent with the downside risks found by Liu and Wang (2010) via the Value-at-Risk. The overall findings provide further evidence in supporting the existence of value premium, i.e., the access returns of value stocks over the growth stocks. However, the results from one-tailed two sample t-test disclosed that such premiums are not statistically significant in Asian markets. The p-values given in Table 2 also suggest that the superior risk-adjusted performance and lower downside risk of value stocks over the growth stocks are also statistically insignificant.
The cumulative portfolio risk-adjusted performance, returns and downside risks over the study period are summarized in Table 3. The cumulated values are comparable to the findings shown in Table 2. The results consistently demonstrated the out performance of value stocks over the growth stocks in terms of cumulated risk-adjusted performance, returns, as well as the cumulated downside risks.
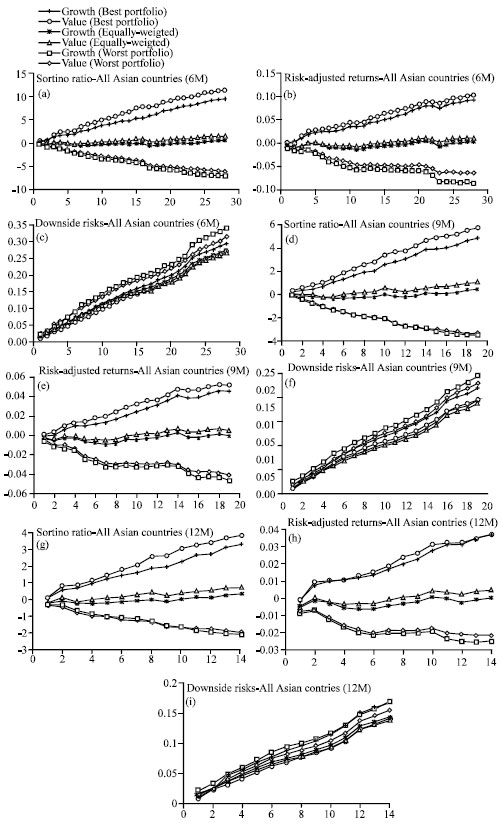 | |
| Fig. 1: | Cumulative plots for all selected Asian countries portfolio |
Cumulative plots for the risk-adjusted performance, returns and downside risks are also brought into action in order to carry out an in-depth study on the performance of value and growth stocks over the long-term period. Figure 1 shows the cumulative plots for portfolios composed from all the selected Asian countries in the study.
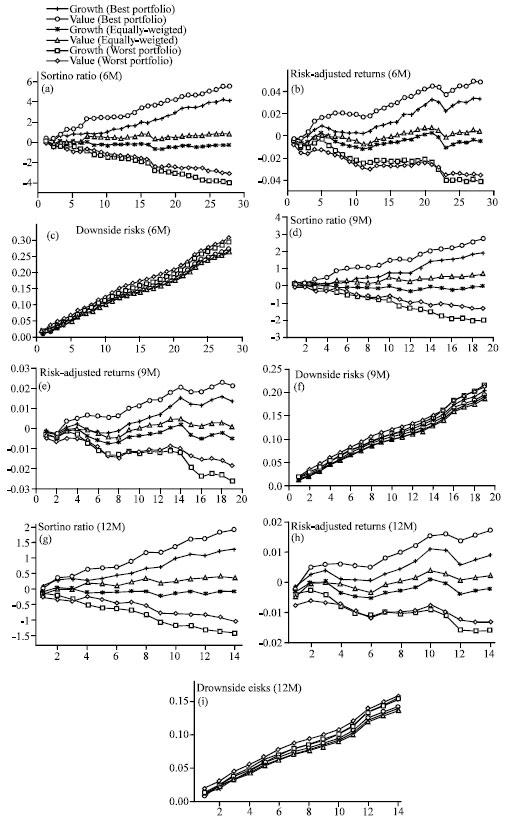 | |
| Fig. 2: | Cumulative plots for developed Asian countries portfolio |
The 6- and 9- month reviewed risk-adjusted performance and returns of value stocks consistently outperform the growth stocks throughout the entire study period. However, negative value premium is detected in the 12-month rebalancing best portfolio. This may possibly be an indication that over the long-term, growth stocks might outperform the value stocks, as advocated by Beneda (2002). The cumulative outcomes of the portfolios constructed from the developed Asian countries are displayed in Fig. 2.
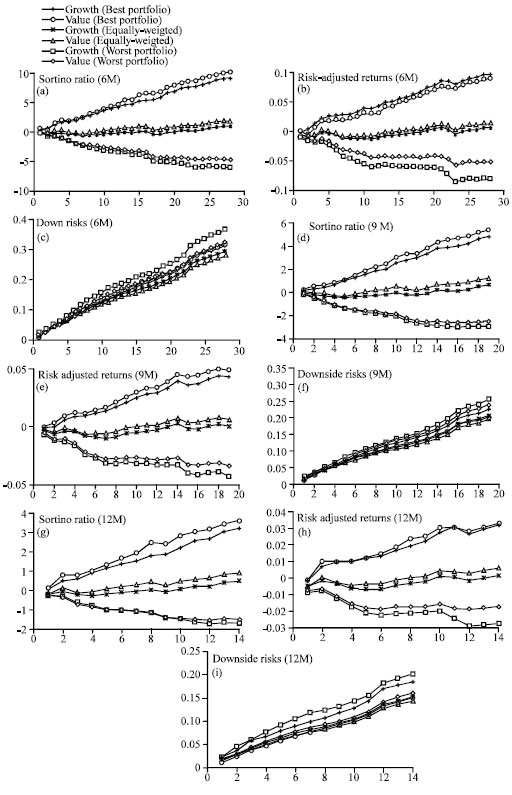 | |
| Fig. 3: | Cumulative plots for emerging Asian countries portfolio |
The results seem to favor the growth stocks in these developed countries at the beginning periods but the out performance and gain over the value stocks soon disappear. Such behavior is not noticeable in the emerging Asian countries portfolio, as shown in Fig. 3. This observation is reasonable seeing that few years prior to the dot-com bubble burst on 10 March 2000, the high-technology stocks, which are also the growth stocks, have beaten the value stocks. Hong Kong, Japan and Singapore are developed countries that are closely involved in high-technology sector. Furthermore, the time is also in accordance with the initial period of the data under study (2 July 1997 to 28 September 2011). Patel and Swensen (2007) also observed similar results in their study when they examine the performance of value and growth stocks over the sub-period from July 1995 to December 1999.
The second part of the empirical analysis focuses on the market efficiency of growth and value stocks. By using price delay measures and rolling window approaches, a series of measures are acquired. The summary of the price delay measures are exhibited in Table 4. Since the results of the Jarque-Bera normality tests suggest that measures are not normally distributed, hence this study uses median as the measure of central tendency of the outputs. The medians of value stocks are consistently higher than the medians of growth stocks and this implies that the value stocks are relative inefficient. These fascinating findings can be additional evidence in the debate on the existence of value premium. The results enlighten and support the market inefficiency proponents who strongly believe that the presence of value premium is due to the overreaction related mispricing (De Bondt and Thaler, 1987; Chopra et al., 1992; La Porta, 1996). Further statistical analysis is carried out to examine the significance of the difference between the medians. The p-values obtained from the one-tailed Mann-Whitney nonparametric tests suggest that there are statistically significant differences between the medians of growth and value stocks. The dynamics of market efficiency for 1-, 2-, 3- and 4-year rolling window length of value and growth stocks are exhibited in Fig. 4.
| Table 4: | The price delay measures for different window length (in year) |
 | |
| ** and *** indicate significant at 5% and 1% significance level respectively | |
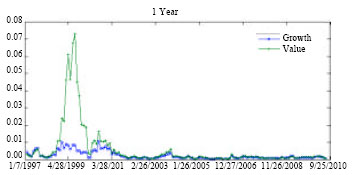 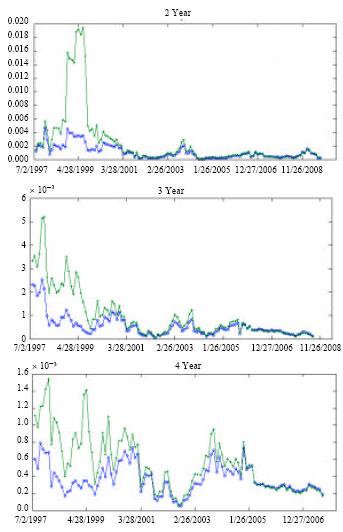 | |
| Fig. 4: | The dynamics of market efficiency |
The plots revealed that the gap between the market efficiency of value and growth stocks is the greatest during the period just before the dot-com bubble crisis. The gap decreases as the window length increases. Generally, the plots showed that the market efficiency of both value and growth stocks improve and the gap becomes smaller over time.
CONCLUSION
The results suggested by the portfolios constructed via the Sortino ratio optimization have revealed that the risk-adjusted performance, returns and downside risks of value stocks are superior over the growth stocks. The analysis of the market efficiency of the value and growth stocks using rolling price delay measures has demonstrated that the value stocks are relatively inefficient. The findings enlighten and support the proponents who strongly believe that the presence of value premium is due to the market inefficiency. The empirical findings of the present study can be guideline for finance practitioner and are also valuable to style investors.
REFERENCES
- Bauman, W.S., C.M. Conover and R.E. Miller, 1998. Growth versus value and large-cap versus small-cap stocks in international markets. Financ. Anal. J., 54: 75-89.
Direct Link - Bauman, W.S., C.M. Conover and R.E. Miller, 2001. The performance of growth stocks and value stocks in the Pacific Basin. Rev. Pacific Basin Financ. Markets Policies, 4: 95-108.
CrossRef - Beneda, N., 2002. Growth stocks outperform value stocks over the long term. J. Asset Manage., 3: 112-123.
CrossRef - Cajueiro, D.O. and B.M. Tabak, 2004. The hurst exponent over time: Testing the assertion that emerging markets are becoming more efficient. Phys. A Stat. Mech. Appl., 336: 521-537.
CrossRef - Chopra, N., J. Lakonishok and J.R. Ritter, 1992. Measuring abnormal performance: Do stocks overreact. J. Financial Econ., 31: 235-268.
Direct Link - De Bondt, W.F.M. and R.H. Thaler, 1987. Further evidence on investor overreaction and stock market seasonality. J. Finance, 42: 557-581.
CrossRefDirect Link - Fama, E.F. and K.R. French, 1992. The cross-section of expected stock returns. J. Finance, 47: 427-465.
CrossRefDirect Link - Fama, E.F. and K.R. French, 1996. Multifactor explanations of asset pricing anomalies. J. Finance, 51: 55-84.
Direct Link - Fama, E.F. and K.R. French, 1998. Value versus growth: The international evidence. J. Finance, 53: 1975-1999.
CrossRef - Hou, K. and T.J. Moskowitz, 2005. Market frictions, price delay and the cross-section of expected returns. Rev. Financ. Stud., 18: 981-1020.
CrossRef - La Porta, R., 1996. Expectations and the cross-section of stock returns. J. Finance, 51: 1715-1742.
Direct Link - Lim, K.P., 2008. Sectoral efficiency of the Malaysian stock market and the impact of the Asian financial crisis. Stud. Econ. Finance, 25: 196-208.
CrossRef - Lim, K.P. and C.Y. Hooy, 2010. The delay of stock price adjustment to information: A country-level analysis. Econ. Bull., 30: 1609-1616.
Direct Link - Liu, Z. and J. Wang, 2010. Long term performance of value vs. growth stocks: Evidence from international markets. J. Int. Financ. Econ., 10: 133-139.
Direct Link - Lye, C.T., 2011. Enhanced stutzer index optimization using hybrid genetic algorithm and sequential quadratic programming. J. Applied Sci., 11: 855-860.
CrossRef - Lye, C.T. and N.A.M. Yusof, 2011. Performance of listed state-owned enterprises using sortino ratio optimization. J. Applied Sci., 11: 3436-3441.
CrossRef - Patel, J.B. and R.B. Swensen, 2007. Comparative performance of value and growth stock indexes. J. Wealth Manage., 9: 51-61.
CrossRef - Sortino, F.A. and L.N. Price, 1994. Performance measurement in a downside risk framework. J. Investing, 3: 59-64.
CrossRef - Cajueiro, D.O., P. Gogas and B.M. Tabak, 2009. Does financial market liberalization increase the degree of market efficiency? The case of the Athens stock exchange. Int. Rev. Finan. Anal., 18: 50-57.
CrossRef