
Nermeen A. El-Sersy
Microbiology Laboratory, Alexandria, Egypt


ABSTRACT
In this study Bacillus thuringiensis 4G1 was used to decolorize Methylene Blue (MB). The decolorization process was optimized by using two sequential experimental designs. Eleven fermentation factors were screened using Plackett-Burman design. Among these factors, the most significant variables influencing MB decolorization were statistically elucidated for optimization and included MgSO4.7 H2O, glucose and (NH4)2 SO4. The optimum concentrations of these variables were predicted by using a second order polynomial model fitted to the results obtained by applying the Box-Behnken design. A verification experiment performed under optimal conditions yielded 98.23% of the predicted decolorization% (100%) with an increase by a factor of 1.3 compared with the results obtained under basal conditions.
PDF Abstract XML References
How to cite this article
Nermeen A. El-Sersy, 2007. Bioremediation of Methylene Blue by Bacillus thuringiensis 4 G1: Application of Statistical Designs and Surface Plots for Optimization. Biotechnology, 6: 34-39.
DOI: 10.3923/biotech.2007.34.39
URL: https://scialert.net/abstract/?doi=biotech.2007.34.39
DOI: 10.3923/biotech.2007.34.39
URL: https://scialert.net/abstract/?doi=biotech.2007.34.39
INTRODUCTION
The presence of dyes in effluents is a major concern due to their adverse effect to many forms of life. Colored waters is one of the most important hazard in industrial effluents, which needs to be treated (Garg et al., 2004; Forgacs et al., 2004; Pearce et al., 2003; Pala and Tokat, 2002; Guarantini and Zanoni, 2000; Chun and Yizhong, 1999) because the presence of dyes in water reduces light penetration, precluding the photosynthesis of aqueous flora (Robinson et al., 2002). Besides that, some dyes may cause allergy, dermatitis, skin irritation and cancer to humans (Bhatnagar et al., 2005) in addition to being mutagenic (Gong et al., 2005). Synthetic dyes are extensively employed in textile, paper, photo electrochemical cells, printing, leather, food, cosmetics, etc. industries, which employ these substances to color their final products. The treatment of aqueous water containing soluble dyes thus requires complete removal followed by secure disposal (Webe and Morris, 1964). The most commonly used techniques for color removal include chemical precipitation, ion exchange, reverse osmosis, ozonation and solvent extraction etc. However, these techniques have certain disadvantages such as high capital cost and operational costs or secondary sludge disposal problem (Khattri and Singh, 1998). Microbial decolorization processes offer a complete cleanup of pollutants in a natural way and appear to be an attractive alternative (Radha et al., 2005; EL- Sharouny and El- Sersy, 2005; Boer et al., 2004; El-Sersy, 2001).
Medium optimization using statistical designs was recently used for the decolorization of dyes (Pavan et al., 2005; Ravikumar et al., 2005).
In this present study for developing maximum Methylene Blue (MB) decolorization, two experimental designs were sequentially applied as a tool for optimizing bacterial decolorization process. In the first optimization step, Plackett- Burman experimental design (Plackett and Burman, 1946) was applied to test the relative importance of various environmental factors on MB decolorization. In the following step, Box-Behnken design (Box and Behnken, 1960) was applied for further optimization to the most significant variables. This design is a response surface methodology (Montgomery, 2001) employed to find factor settings that produce the best response, find factor settings that satisfy operating or process specifications and model a relationship between the quantitative factors and the response.
MATERIALS AND METHODS
Chemicals: The heterocyclic Methylene blue (MB) dyes (C16H18Cl N3S. H2O) was of pure grade provided from BDH, Hseelze-Hanover, Germany. All reagents and medium components used, were obtained from Oxoid Ltd., Basingstoke, Hampshire, England.
Microorganisms and culture conditions: Bacillus subtilis 168, Bacillus lichemniformis 5A1, Bacillus thuringiensis 4G1 and Bacillus sphaericus which are from Bacillus genetic stock centre Ohio State University, UK, were screened for their ability to decolorize different MB concentrations. Screening test was performed on basal agar plates amended with different MB concentration and incubated at 37°C for two days. Colonies that showed decolorization clear zones were selected. The basal liquid medium used for decolorization contained in g L-1; glucose, 3; yeast extract, 1; (NH4)2SO4, 1; K2HPO4, 6; KH2PO4, 1; MgSO4. 7 H2O, 0.1; NaCl, 5; Fe SO4, 0.001 and MB, 0.3. Laury Broth (LB) medium contained in g L-1: peptone, 10; yeast extract 5 and NaCl, 5.
Decolorization assay: Seed cultures were prepared by inoculating LB liquid medium from single colony and shaken until reached an absorbance (A550) of 1.0. Decolorization cultures were prepared by inoculating 50 mL basal medium containing MB (0.3 g L-1) in 250 mL Erlenmeyer flasks with 0.5 mL of seed cultures.
Cells of 1 mL culture aliquots were pelleted by centrifugation for 10 min at 10,000 rpm. MB concentration was determined by measuring absorbance of clear supernatants at 665 nm (Boer et al., 2004). The medium formula lacking MB was used as a control.
Experimental designs
Plackett-Burman design: The Plackett-Burman experimental design, a fractional factorial design, (Plackett and Burman, 1946) was used to reflect the relative importance of various environmental factors on MB decolorization in liquid cultures. Eleven independent variables were screened in twelve combinations organized according to the Plackett-Burman design matrix (Table 2) for each variable; a high (+) as well as low (-) level was tested. All trials were performed in duplicates and the averages of decolorization observation results were treated as the responses. The main effect of each variable (Table 1) was determined with the following equation:
Exi = (ΣMi+-Σ Mi-)N-1 |
Where Exi is the variable main effect, Mi+ and Mi- are the decolorization percentage in trials where the independent variable (xi) was present in high and low concentrations, respectively and N is the number of trials divided by 2. A main effect figure with a positive sign indicates that the high concentration of this variable is near to the optimum and a negative sign indicates that the low concentration of this variable is near to the optimum. Using Microsoft Excel, statistical t-values for equal unpaired samples (Table 1) were calculated for determination of variable significance.
Box-Behnken design: Experimental design, which is a central composite design (Box and Behnken, 1960), was applied. In this model, the most significant independent variables, designated (X1), (X2) and (X3) were included and each of them was examined at three different levels, low (-), high (+) and central or basal (0).
| Table 1: | Factors examined as independent variables affecting methylene blue decolorization and their levels in the Plackett-Burman experiment |
 | |
| 1Significant t-values at the 1, 5 and 10% levels are 2.764, 1.812 and 1.372, respectively (Chatfield, 1975) | |
| Table 2: | Plackett-Burman experimental design for 11 factors |
 | |
| 1See Table 1 for clarification of factor symbols, 2Results were taken after 24 h, + = High, - = Low | |
According to the applied design described in the Results section, thirteen dye treatment combinations were tried. For predicting the optimal point, the following second order polynomial model was fitted to correlate relationship between independent variables and response:
Y =b0+b1X1+b2X2+b3X3+b12X1X2+b13X1X3+b23X2X3+b11X12+b22X22+b33X32 |
Where, Y is the dependent variable (MB decolorization %); X1, X2 and X3 are the levels of independent variables; b0 is the regression coefficient at center point; b1, b2 and b3 are linear coefficients; b12, b13 and b23 are second-order interaction coefficients and b11, b22 and b33 are quadratic coefficients. The values of the coefficients were calculated using Micrococal Origin 4.1 software and the optimum concentrations were predicted using Microsoft Excel 2000. The quality of the fit of the polynomial model equation was expressed by the coefficient of determination, R2. The optimal value of MB decolorization was estimated using the solver function of Microsoft Excel tool.
Statistica 6.1 software was used to illustrate the quadratic responses plots.
RESULTS
Screening for MB decolorization ability: From the four tested bacillus strains (Bacillus subtilis 168, Bacillus lichemniformis 5A1, Bacillus thuringiensis 4G1 and Bacillus sphaericus) on basal agar plates amended with 0.2, 0.3, 0.4 and 0.5 g L-1, the largest decolorization zone (5.6 mm) was detected around Bacillus thuringiensis 4G1 amended with 0.3 g L-1 MB. According to this result, this strain was chosen to complete the work with on a concentration of 0.3 g L-1 MB.
Factors affecting MB decolorization (Plackett Burman design): For elucidation of medium components affecting MB decolorization, the independent variables examined in the Plackett Burman experiment and their settings are shown in Table 1. The main effect of each variable was calculated according to MB decolorization % results (Table 2). The data indicated that, the presence of high levels of Inoculum size, Peptone, glucose, K2HPO4 and Fe SO4, in the growth medium affects MB decolorization positively. On the other hand, the presence of KH2PO4, MgSO4. 7 H2O, NaCl, (NH4)2SO4 and MB at their lowest levels would result in high decolorization %. According to this results it can be predicted that the near optimum medium for MB decolorization by Bacillus thuringiensis 4G1 is (g L-1): Peptone, 1.5; glucose, 5; yeast extract, 0.5; (NH4)2SO4, 0.5; K2HPO4, 8; MgSO4. 7 H2O, 0.05; NaCl, 2.5; Fe SO4, 0.002 and MB, 0.25; inoculum size, 1.5 mL (50 mL)-1 medium.
In order to evaluate the accuracy of the applied Plackett Burman screening test, a verification experiment was carried out in triplicate. The predicted near optimum levels of independent variables were examined and compared to the basal condition setting except for MB concentration was fixed to be at the basal setting (0.3 g L-1). The average of MB decolorization % was recorded. MB decolorization reached about 89% which is approximately 1.2 times higher than that obtained from basal medium (76.1%). On the basis of the calculated t-values (Table 1), MgSO4.7 H2O; Glucose and (NH4)2 SO4 were chosen for further optimization, since these factors had the most significant effects on the MB decolorization process.
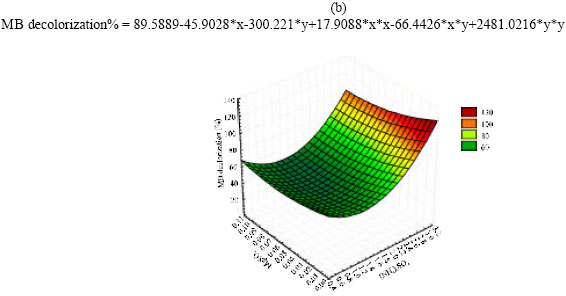
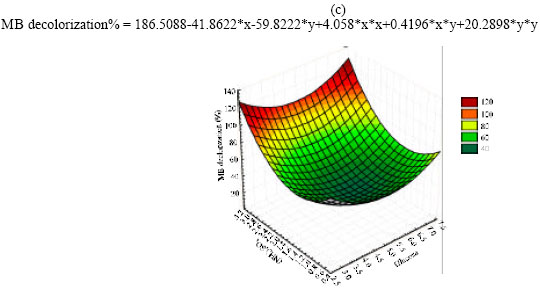
Optimization of MB decolorization by Box-Behnken design: In this second optimization step the levels of the three significant independent variables MgSO4.7 H2O (X1); Glucose (X2); and (NH4)2 SO4 (X3) were further investigated each at three different levels (Table 3). Near optimum levels of the other factors, suggested by the Plackett-Burman experimental results were used in all trials. All cultures were performed in duplicate and the averages of the observations (MB decolorization %) were used. Presenting experimental results in the form of surface plots (Fig. 1a-c) showed that high MgSO4.7H2O concentration together with high level of glucose (Fig. 1a) slightly inhibit MB decolorization, while high MgSO4.7 H2O concentration together with high level of (NH4)2 SO4 appeared to be positive with respect to decolorization process (Fig. 1b). On the other hand the interaction between (NH4)2SO4 and glucose concentration (Fig. 1c) illustrated that low Glucose concentration together with high (NH4)2SO4 level greatly supports MB decolorization. For predicting the optimal point, a second-order polynomial function was fitted to the experimental results of MB decolorization (Y):
Y =176.28 + 414.36X1 - 43.32X2 - 69.7X3 - 247.8X1X2 - 64.01X1X3 + 0.322 X2X3 + 7213X12 + 5.5X22 + 24X32 |
The fit of the model is expressed by coefficient of determination, R2, which was calculated to be 0.938. The closer the R2 value to 1.00 the stronger the model is and the better it predicts response. Accordingly, our calculated R2 value indicates that the model could explain 93.8% of the variability in the response. The predicted optimal concentrations of the three components as obtained from the solver function of Microsoft Excel tool were calculated to be (g L-1): MgSO4.7 H2O (0.096), glucose (3) and (NH4)2 SO4 (0.5) with a predicted MB decolorization % of 100.
| Table 3: | Examined concentrations of the key variables and results of the Box-Behnken experiment |
 | |
| *All variables were in g L-1, **Results were taken after 24 h | |
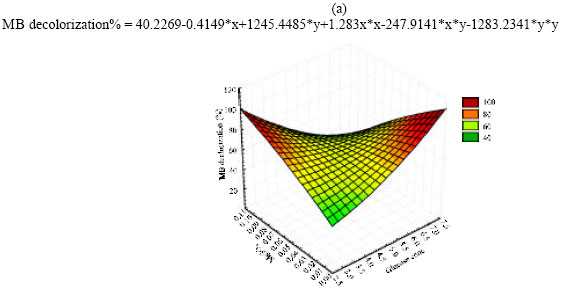 | |
| Fig. 1: | The response of MB decolorization as function of MgSO4.7 H2O and glucose (a), MgSO4.7 H2O and (NH4)2 SO4 (b), (NH4)2 SO4 and glucose (c) |
Verification of the model: In order to determine the accuracy of the of the model and to verify the optimization results, an experiment was performed under basal and predicted optimal conditions where MB decolorization was monitored after 24 h. MB concentration were fixed at a concentration of 0.3 g L-1 in both cultures. Under the optimized condition, a 98.23% decolorization was reached after 18 h, while the basal control medium reached 76.2% after 24 h. These results indicate that the optimized condition accelerated the reaction rate with decolorization % of 1.3 fold increase.
Matching the predicted degradation (100%) and the observed degradation (98.23%) under optimal condition also proves the accuracy and validity of the model. According to this results it can be predicted that the optimum medium for MB decolorization by Bacillus thuringiensis 4G1 is (g L-1): Peptone, 1.5; glucose, 3; yeast extract, 0.5; (NH4)2SO4, 0.5; K2HPO4, 8; MgSO4. 7 H2O, 0.096; NaCl, 2.5; FeSO4, 0.002 and MB, 0.25; inoculum size, 1.5 mL (50 mL)-1 medium.
DISCUSSION
Several studies have demonstrated the ability of fungi to decolorize synthetic dyes (Radha et al., 2005; Ravikumar et al., 2005; Pavan et al., 2005; Boer et al., 2004) while other studies reveled bacterial dye decolorization (El-Sersy, 2001; Hu, 1994, 1996). In the present study, four Bacillus strains were screened for their ability to decolorize MB dye. Bacillus thuringiensis 4G1, had a relatively high ability to decolorize MB.
Synthetic dye removal in a batch system usually depends on several factors. The optimization of all those variables using the univariate procedure is very tedious, because any variable (factor) is optimized, by varying just one factor by the time and fixing the others. Then, the best value achieved by this procedure is fixed and other factors will be varied by the time. The disadvantage of this univariant procedure is that the best condition could not be attained, because the interactions among all the factors are disregarded and also it is not known if the set of other fixed variables was fixed at other levels, the results would lead to the same optimization. In order to overcome these disadvantages, statistical design of experiments can be carried out to achieve the best optimization of any possible system (Brasil et al., 2005). Environmental studies were carried out in this work by applying a Plackett-Burman multifactorial experiment which reflected the influence of various fermentation factors on MB decolorization. The results showed that the presence of inoculum size, peptone, glucose, K2HPO4 and FeSO4 in their high level appear to promote MB decolorization process, while the presence of yeast extract, (NH4)2SO4, KH2PO4, MgSO4.7H2O and NaCl in their low level enhance the process as well. However, glucose, (NH4)2SO4 and MgSO4.7H2O were significantly effective factors. This agree with Radha (2005) who stated that dye decolorization process is mainly an extracellular enzymatic process which is promoted by the presence of glucose and (NH4)2SO4 as a simple carbon and nitrogen sources respectively, while MgSO4.7H2O is a growth promoter factor.
The optimal response region of these significant factors was predicted by using a second-order polynomial model fitted to the results obtained by applying Box-Behnken statistical design.
Substantial differences in MB decolorization appeared as a result of reducing glucose concentration to 3 g L-1 and increasing MgSO4.7 H2O levels to 0.096 g L-1. Although these results were deduced by Plackett-Burman experiment, this unexpected result could be due to the new combination among the medium components in the optimized condition. This is one of the advantages of applying multifactorial experiments that consider the interaction of independent variables and provide a basis for model to search for the non linear nature of the response in short-term experiment (Ravikumar et al., 2005; Pavan et al., 2005). The great similarity observed between the predicted and experimental results reflects the high accuracy and applicability of the model.
ACKNOWLEDGMENT
The author is grateful to Prof. Dr. E.R. El-Helow, Faculty of Science, Microbiology department Alexandria, Egypt, for his valuable advices. Also the author wishes to express her appreciation to Assistant Prof. Dr. A.M. El-Nemr National Institute of Oceanography and Fisheries, Environmental division, Alexandria, Egypt, for his kind help.
REFERENCES
- Bhatnagar, A., A.K. Jain and M.K. Mukul, 2005. Removal of Congo red dye from water using carbon slurry waste. Environ. Chem. Lett., 2: 199-202.
CrossRefDirect Link - Boer, C.G., L. Obici, C.G.M. de Souza and R.M. Peralta, 2004. Decolorization of synthetic dyes by solid state cultures of Lentinula (Lentinus) edodes producing manganese peroxidase as the main ligninolytic enzyme. Bioresour. Technology, 94: 107-112.
CrossRefDirect Link - Box, G.E.P. and D.W. Behnken, 1960. Some new three level designs for the study of quantitative variables. Technometrics, 2: 455-475.
CrossRefDirect Link - Brasil, J.L., L.C. Martins, R.R. Ev, J. Dupont, S.L.P. Dias and J.A.A. Sales, 2005. Factorial design for optimization of flow-injection preconcentration procedure for copper(II) determination in natural waters, using 2-aminomethylpyridine grafted silica gel as adsorbent and spectrophotometric detection. Int. J. Environ. Anal. Chem., 15: 4754-4791.
Direct Link - Chun, H. and W. Yizhong, 1999. Decolorization and biodegradability of photocatalytic treated azo dyes and wool textile wastewater. Chemosphere, 39: 2107-2115.
CrossRefDirect Link - El-Sharouny, E.E. and N.A. ElSersy, 2005. Biosorption of textile dyes by Brewer's yeast biomass. Fresenius Environ. Bull., 14: 928-933.
Direct Link - Forgacs, E., T. Cserhati and G. Oros, 2004. Removal of synthetic dyes from wastewaters: A review. Environ. Int., 30: 953-971.
CrossRefDirect Link - Garg, V.K., M. Amita, R. Kumar and R. Gupta, 2004. Basic dye (methylene blue) removal from simulated wastewater by adsorption using Indian Rosewood sawdust: A timber industry waste. Dyes Pigments, 63: 243-250.
CrossRefDirect Link - Gong, R., Y. Ding, M. Li, C. Yang, H. Liu and Y. Sun, 2005. Utilization of powdered peanut hull as biosorbent for removal of anionic dyes from aqueous solution. Dyes Pigments, 64: 187-192.
CrossRefDirect Link - Khattri, S.D. and M.K. Singh, 1998. Colour removal from aqueous solutions by adsorption. Ind. J. Chem. Technol., 5: 230-234.
Direct Link - Pala, A. and E. Tokat, 2002. Color removal from cotton textile industry wastewater in an activated sludge system with various additives. Water Res., 36: 2920-2925.
CrossRefDirect Link - Plackett, R.L. and J.P. Burman, 1946. The design of optimum multifactorial experiments. Biometrika, 33: 305-325.
CrossRefDirect Link - Radha, K.V., I. Regupathi, A. Arunagiri and T. Murugesan, 2005. Decolorization studies of synthetic dyes using Phanerochaete chrysosporium and their kinetics. Process Biotechnol., 40: 3337-3345.
CrossRefDirect Link - Robinson, T., B. Chandran and P. Nigam, 2002. Removal of dyes from a synthetic textile dye effluent by biosorption on apple pomace and wheat straw. Water Res., 36: 2824-2830.
CrossRefDirect Link - Pearce, C.I., J.R. Lloyd and J.T. Guthrie, 2003. The removal of colour from textile wastewater using whole bacterial cells: A review. Dyes Pigments, 58: 179-196.
CrossRef