
Bambara Telado Luc
Institute of Sciences and Technology, Ouagadougou, Burkina Faso
LiveDNA: 226.38252
Doumounia Ali
Institute of Sciences and Technology, Ouagadougou, Burkina Faso
Kohio Nièssan
Institute of Sciences and Technology, Ouagadougou, Burkina Faso
Ouédraogo Soumaila
Institute of Sciences and Technology, Ouagadougou, Burkina Faso
François Zougmoré
Department of Physics, University Joseph Ki-Zerbo, Ouagadougou, Burkina Faso
Asian Journal of Scientific Research
Year: 2022 | Volume: 15 | Issue: 1 | Page No.: 31-38


ABSTRACT
Background and Objective: Indoor radon is the second leading cause of lung cancer after cigarette smoking, according to the US National Academy of Sciences (NAS) study. The soil under the house or the building is the main source of indoor radon in the homes, buildings and other residential objects. Other sources are construction materials, groundwater and natural gas. The present work aimed to assess the radon concentration in student residence buildings and their impact on health. Materials and Methods: In this study, the indoor radon concentration in the student residence was measured using the digital radon detector air things of Corentium in fourteen buildings. Results: The long-term concentration of radon in university residences varies from 2-9 Bq m–3 at Patte d’Oie, from 4-15 Bq m–3 at KOSSODO, from 10-19 Bq m–3 at IDS, from 14-191 Bq m–3 at UTS and 4-11 Bq m–3 at BOBO. The results show a higher concentration of radon in the buildings of the university residences were measured at UTS with average values of 65.86 Bq m–3 for the long term and 53.90 Bq m–3 for the short term. The radon effective dose equivalent in building 2 at UTS student residence (8.249 mSv/year) was slightly larger than the limit of the recommended action level (3-10 mSv/year) as reported by the ICRP-1993. The RRLC range was from 1.003-1.126 with an average of 1.02 is almost negligible. Conclusion: Results concluded that the relative risk of lung cancer in the student residence building varied from 1.003 to 1.126 with an average of 1.02.
PDF Abstract XML References Citation
Copyright: © 2022. This is an open access article distributed under the terms of the creative commons attribution License, which permits unrestricted use, distribution and reproduction in any medium, provided the original author and source are credited.
How to cite this article
Bambara Telado Luc, Doumounia Ali, Kohio Nièssan, Ouédraogo Soumaila and François Zougmoré, 2022. Radon Level in Burkina Faso Student Residence and Estimation of the Annual Effective Dose. Asian Journal of Scientific Research, 15: 31-38.
DOI: 10.3923/ajsr.2022.31.38
URL: https://scialert.net/abstract/?doi=ajsr.2022.31.38
DOI: 10.3923/ajsr.2022.31.38
URL: https://scialert.net/abstract/?doi=ajsr.2022.31.38
INTRODUCTION
Radon-222 is a naturally occurring radioactive element, the importance of which stems from the fact that it is the main source of radioactivity to which humans are exposed. It is released during the decay of thorium and uranium, which are natural elements found in rocks and soils in different proportions. The decay of radon-222 gas yields radioactive elements, two of which emit alpha particles, the inhalation of which very effectively damages lung tissue. In the United States and the United Kingdom, studies have shown that natural exposure to radon causes death from lung cancer every year1.
Radon gas inside homes and buildings poses a much greater risk than outside because it is diluted in the outside air, making its concentration low. In the indoor air of homes and buildings, radon can accumulate and have very high concentrations. High indoor radon gas concentration values are mainly related to the construction of the building and the amount of radon gas in the underlying ground. The concentration of radon inside a house depends on the composition of the soil on which it was built. The migration of radon to a house also depends on the nature of the surrounding soil.
However, inhalation of radon in buildings and ingestion of radon dissolved in water are the main routes of human exposure to radon. The presence of radon in groundwater is a source of human exposure by inhalation and ingestion. On the other hand, the radon present in the materials used for construction and in the soil of buildings are sources of human exposure by inhalation. In the lungs, radon can easily be exhaled through pulmonary circulation and it can also interact with the biological tissues of the lungs. Once in the lungs, radon causes DNA damage, which can lead to cancer2.
In the USA, studies have shown that radon in homes causes 21,100 lung cancer deaths per year which makes it the second leading cause of lung cancer deaths2. The average radon concentration in homes in the UK is 21 becquerels per cubic meter (Bq m–3). Each year around 1,100 lung cancer deaths have been linked to radon in the home3. Studies in Canada have shown that the radon concentration in residential homes is higher than in school buildings, 4.7 times higher than in public buildings and indoor workplaces and 12 times higher than in the open air. Exposure to radon in residential homes contributes to 90% of the risk of developing radon-induced lung cancer4.
Several studies on radon in residential buildings around the world have been carried out. The radon concentration in the dwellings was found to vary from 41±9-57±8 Bq m–3 in dwellings of some cities of Gezira state in Sudan, with an average of 49±10 Bq m–3. The annual effective dose rate from radon in dwellings of some cities of Gezira state in Sudan ranges from 1.05-1.43 mSv/year. The relative lung cancer risk for radon exposure in dwellings of some cities of Gezira state in Sudan was 1.044%5. According to Labidi et al.6, the measured concentration of radon in elementary schools in Tunisia varies between 06 and 169 Bq m–3 with an average value of 26.9 Bq m–3 and the annual effective dose were between 0.025 and 0.715 mSv/year, with the average of 0.114 mSv/year. The radon concentration in residential buildings in Okrika, Rivers State, Nigeria was between 19.36±2.26 and 09.35±0.78 Bq m–3 with an average value of 11.70±3.28 Bq m–3 and the average annual effective dose was 0.71±0.20 mSv/year7.
The radon concentrations in Egyptian houses varied from 0.4-220.3±11.5 Bq m–3 for Mit Rehan house, 0.4-33.7±3.6 Bq m–3 for Westown house and 2.6±0.37-70.0±4.9 Bq m–3 for Abo Sir house8.
The concentration of radon in dwellings of the province of Naples was vary from 21-722 Bq m–3, with an average value of 107±75 Bq m–3 and the average gamma dose rate was 327±102 nGy h–1 9.
Hassanvand et al.10 show that the indoor radon concentration was between 1.01-206.53 Bq m–3 with an average value of 55.19 Bq m–3 and the average annual effective dose to the population in Aleshtar was 1.39 mSv/year.
Yalım et al.11 showed that the measured values of radon gas at Workplaces of Afyonkarahisar Province varied from 13-1,932 Bq m–3 and the average concentration was in the range of 21.75 and 1,032.50 Bq m–3.
The present study of radon in student residence buildings constitutes an important public health issue which requires more information on concentrations. This study aims to contribute to the assessment of the radon concentration in student residence buildings and their impact on the health of residents.
MATERIALS AND METHODS
Study area: Burkina Faso is a landlocked West African country, with an area of 274,000 square kilometres. It is surrounded by six countries: Mali to the Northwest, Niger to the Northeast, Benin to the Southeast, Togo to the Southeast, Ghana to the South and Côte d'Ivoire to the Southwest. The capital Ouagadougou is located in the centre of the country (1°28-1°36 west longitude and 12°20-12°26 north latitude). Bobo-Dioulasso is the economic capital of Burkina Faso and the second city in population after Ouagadougou.
This study was conducted at the university sites of Ouagadougou and that of Bobo-Dioulasso. Radon concentration measurements in the student residence of Bobo Dioulasso and Ouagadougou were carried out over the period from July to December, 2021, with the financial support of the Institute of Sciences and the technical support of Joseph Ki-Zerbo University, Laboratory of the Materials and Environment.
Technical means of measurement: For the measurement of radon in residential buildings, our choice fell on the digital radon detector air things of Corentium for its very high precision. For concentration measurements, the digital radon detector air things of Corentium was placed in each residential building for a minimum period of 1 week. The concentration values were read every 24 hrs for 1 week. The values recorded were the short-term average and the long-term average.
The digital radon detector air things of Corentium gives two values on each reading, which are: The short-term average and the long-term average.
The long-term average displayed by the radon meter represents the average radon concentration for the current measurement, for a maximum period of 1 year. The long-term average is updated once every day. The long-term average is used to identify the potential health risks of radon.
The short-term average displayed by the radon meter represents the average radon concentration for a maximum duration of 1 day and is updated every hour. For the last 7 days of measurement, the short-term average is updated once a day. The short-term average is used to indicate the radon concentration to suggest solutions such as increased ventilation to reduce radon levels. It can provide relevant information when a long-term measurement is not possible.
The annual average indoor radon concentration must be less than 2.7 pCi/L or 100 Bq m–3, as recommended by the World Health Organization (WHO).
Radon concentration measurements in buildings must be carried out in all living areas for at least 1 week.
The RESET function was used to calibrate the device before a new measurement when changing the measurement location. This operation deletes all stored radon data. Previous measurements should be noted before using the RESET button. It is recommended to keep the instrument switched on at all times.
Annual effective dose: The annual effective dose from indoor radon exposure was calculated from measured radon concentrations using Eq. 112-15:
D(mSv) = CRn.F.O.T.D | (1) |
The parameters of the formula used to calculate the annual effective dose are defined as follows: CRn is radon activity concentration (Bq m–3), F is an equilibrium factor (which is taken to be 0.4), O is occupancy factor taking a value of 0.8 (which is estimated that people spends 80% of their time indoors), T is the number of hours in a year (24 hrs×365 days = 8760 hrs/year) and D is the dose conversion factor which converts radon concentration into effective dose, 9 mSv (Bq/m3/hr)11,16-19.
Effective dose equivalent: The equivalent dose of radon is a measure of the dose received by the tissues and organs of the occupants of a building, taking into account the different relative biological effects of different types of ionizing radiation. The decay of radon leads to the emission of alpha particles in lung tissue. Alpha particle weighting factors for lung tissue were given by ICRP. The equivalent dose of radon was calculated using the Eq. 220:
E(mSv/year) = D×WR×WT | (2) |
where, D is an annual exposure dose (mSv), WR is a weighting factor for alpha particles taking a value of 20 and WT is a weighting factor for lung tissue with the value of 0.1211,16,21.
Relative risk of lung cancer: The relative risk of lung cancer (RRLC) due to indoor radon exposure was calculated from the measured radon concentration in buildings using the Eq. 35,20:
RRLC = exp(0.00087352CRn) | (3) |
Statistical analysis: In the study, Microsoft Excel was used to analyse the sheets of concentration measurement and process the data. Microsoft Excel was also used to design the spreadsheets that were used to calculate the various parameters.
RESULTS AND DISCUSSION
This study was carried out in the buildings of university residences in Burkina Faso. It concerned the university residences of Patte d'Oie, KOSSODO, the former Institute of Sciences (IDS), Thomas Sankara University (UTS) and Bobo Dioulasso. This study was carried out in fourteen buildings where the students were housed.
| Table 1: | Short term average concentration of radon in student residence (Bq m–3) | |||
| Student residence | Average | Maximum | Minimum | Standard deviation |
| Patte d'Oie | ||||
| Building 1 | 3.14 | 7.00 | 0.00 | 2.27 |
| Building 2 | 7.43 | 11.00 | 4.00 | 2.64 |
| KOSSODO | ||||
| Building 1 | 10.43 | 20.00 | 1.00 | 6.73 |
| Building 2 | 12.29 | 16.00 | 7.00 | 2.93 |
| Building 3 | 11.57 | 19.00 | 1.00 | 6.73 |
| Building 4 | 11.57 | 20.00 | 7.00 | 5.86 |
| IDS | ||||
| Building 1 | 19.86 | 42.00 | 7.00 | 11.23 |
| Building 2 | 14.14 | 22.00 | 5.00 | 6.62 |
| Building 3 | 17.57 | 30.00 | 12.00 | 6.53 |
| UTS | ||||
| Building 1 | 34.00 | 72.00 | 1.00 | 22.05 |
| Building 2 | 112.43 | 206.00 | 60.00 | 64.40 |
| Building 3 | 15.29 | 21.00 | 1.00 | 6.58 |
| BOBO | ||||
| Building 1 | 8.86 | 18.00 | 1.00 | 5.55 |
| Building 2 | 4.00 | 6.00 | 1.00 | 1.83 |
| Table 2: | Long-term average concentration of radon in student residence (Bq m–3) | |||
| Student residence | Average | Maximum | Minimum | Standard deviation |
| Patte d'Oie | ||||
| Building 1 | 3.86 | 7.00 | 3.00 | 1.57 |
| Building 2 | 6.57 | 9.00 | 2.00 | 2.23 |
| KOSSODO | ||||
| Building 1 | 10.43 | 15.00 | 7.00 | 2.51 |
| Building 2 | 10.43 | 14.00 | 7.00 | 2.70 |
| Building 3 | 9.29 | 14.00 | 6.00 | 3.45 |
| Building 4 | 9.86 | 14.00 | 4.00 | 3.76 |
| IDS | ||||
| Building 1 | 15.86 | 19.00 | 10.00 | 2.79 |
| Building 2 | 17.57 | 19.00 | 11.00 | 2.99 |
| Building 3 | 16.57 | 18.00 | 14.00 | 1.27 |
| UTS | ||||
| Building 1 | 44.86 | 91.00 | 26.00 | 21.71 |
| Building 2 | 136.14 | 191.00 | 100.00 | 34.55 |
| Building 3 | 16.57 | 20.00 | 14.00 | 2.23 |
| BOBO | ||||
| Building 1 | 9.86 | 11.00 | 9.00 | 0.90 |
| Building 2 | 5.71 | 7.00 | 4.00 | 0.95 |
Radon concentration in a campus building: The reference level of 100 Bq m–3 was proposed by WHO to minimize health hazards due to indoor radon exposure. The International Commission on Radiation Protection has shown from recent calculations that the indoor reference level of radon must not exceed 300 Bq m–3, which corresponds to an annual dose of 10 mSv12,13.
Table 1 and 2 showed the short-term average concentration and long-term average concentration in student residence buildings, respectively.
Patte d’Oie student residence: The short term average concentration of radon were 3.14±2.27 and 7.43±2.64 Bq m–3 in building 1 and 2, respectively. The concentration in building 2 was higher than the concentration in building 1, this can lead to the construction materials. The radon concentration in the building at Patte d’Oie student residence was less than the reference level proposed by WHO.
Kossodo student residence: The Short Term Average Concentration of radon varies from 1-20.00 Bq m–3 in building 1, from 7-16.00 Bq m–3 in building 2, from 1-19.00 Bq m–3 in building 3 and from 7-20.00 Bq m–3 in building 4. The higher average concentration in Kossodo student residence was determined in building 2 with the value of 12.29 Bq m–3. The radon concentration in the building at the Kossodo student residence was less than the reference level proposed by WHO.
IDS student residence: The short term average concentration of radon varies from 7-42.00 Bq m–3 in building 1, from 5-22.00 Bq m–3 in building 2 and from 12-30.00 Bq m–3 in building 3. The higher average concentration in IDS student residence was determined in building 1 with the value of 19.86 Bq m–3. The radon concentration in the building at IDS student residence was less than the reference level proposed by WHO.
UTS student residence: The short term average concentration of radon in building 1, 2 and 3 were 34.00±22.7, 112.43±64.40 and 15.29±6.58 Bq m–3, respectively. The average concentration in building 2 was higher than the reference level proposes by WHO this can be linked to the construction materials (cut stone brick).
Bobo student residence: The short term average concentration of radon in building 1 and 2 was 8.86±5.55 and 4.00±1.83 Bq m–3, respectively. The average concentrations in building 1 and 2 were less than the reference level proposed by WHO.
In all studies buildings except building 3 at UTS student residence, the long-term average concentration (Table 2) was less than the reference level set by WHO (100 Bq m–3). In building 3 at UTS student residence, the long-term average concentration varied from 100-191 Bq m–3 during the seven days of measurement. The long-term average concentration of each day was high than 100 Bq m–3. In this building, ventilation must be increased.
Table 3 gives the average long term concentration and short-term concentration of radon in the studies universities residences in Burkina Faso.
The long-term concentration of radon in university residences varies from 2-9 Bq m–3 at Patte d'Oie, from 4-15 Bq m–3 at KOSSODO, from 10-19 Bq m–3 at IDS, from 14-191 Bq m–3 at UTS and 4-11 Bq m–3 at BOBO.
| Table 3: | Concentration of radon in student residence (Bq m–3) | |||||
| Long-term concentration of radon (Bq m–3) | Short-term concentration of radon (Bq m–3) | |||||
| Student residence | Average | Maximum | Minimum | Average | Maximum | Minimum |
| Patte d'Oie | 5.21 | 9.00 | 2.00 | 5.29 | 11.00 | 0.00 |
| KOSSODO | 10.00 | 15.00 | 4.00 | 11.46 | 20.00 | 1.00 |
| IDS | 16.67 | 19.00 | 10.00 | 17.19 | 42.00 | 5.00 |
| UTS | 65.86 | 191.00 | 14.00 | 53.90 | 206.00 | 1.00 |
| BOBO | 7.79 | 11.00 | 4.00 | 6.43 | 18.00 | 1.00 |
| Table 4: | Effective dose rate indoors, effective dose equivalent and relative risk of lung cancer in studies building | |||
| Student residence | Average concentration | Effective dose rate indoors (mSv/year) | Effective dose equivalent | Relative risk of lung cancer (RRLC) |
| Patte d'Oie | ||||
| Building 1 | 3.857 | 0.097 | 0.234 | 1.003 |
| Building 2 | 6.571 | 0.166 | 0.398 | 1.006 |
| KOSSODO | ||||
| Building 1 | 10.429 | 0.263 | 0.632 | 1.009 |
| Building 2 | 10.429 | 0.263 | 0.632 | 1.009 |
| Building 3 | 9.286 | 0.234 | 0.563 | 1.008 |
| Building 4 | 9.857 | 0.249 | 0.597 | 1.009 |
| IDS | ||||
| Building 1 | 15.857 | 0.400 | 0.961 | 1.014 |
| Building 2 | 17.571 | 0.444 | 1.065 | 1.015 |
| Building 3 | 16.571 | 0.418 | 1.004 | 1.015 |
| UTS | ||||
| Building 1 | 44.857 | 1.132 | 2.718 | 1.040 |
| Building 2 | 136.143 | 3.437 | 8.249 | 1.126 |
| Building 3 | 16.571 | 0.418 | 1.004 | 1.015 |
| BOBO | ||||
| Building 1 | 9.857 | 0.249 | 0.597 | 1.009 |
| Building 2 | 5.714 | 0.144 | 0.346 | 1.005 |
The study showed that the buildings of the university residences of UTS have the highest radon concentration values with an average of 65.86 Bq m–3 for the long term and 53.90 Bq m–3 for the short term.
Variation of radon concentration on the different floor: In this part, radon concentrations were assessed in buildings 1 and 2 of the UTS student residence, to assess the variation in concentration depending on the floor of the building. The variations of the concentrates according to the floor of buildings 1 and 2 of the UTS student residence were shown in Fig. 1 and 2.
In building 1 of UTS student residence, the radon concentration varies from one day to another and the variation is not uniform from one floor to another (Fig. 1). On the 1st, 2nd, 4th and 5th days, high concentrations were observed on the third floor. On the second floor, high concentrations were observed on the 6th day. During the 1 week of measurement, large concentrations were observed on the third floor, this may be due to the nature of the bricks used for the construction of the building.
The radon concentration varies from 1 day to another and the variation was not uniform from one floor to another (Fig. 2) in building 2 in the student residence of UTS. From the 2nd-7th day, the radon concentrations measured on the third floor were higher than those observed on the first and second floors. These high concentrations observed on the second and third floors can be linked to the nature of the bricks used for the construction of the building. To reduce the concentration of radon on the third floor, ventilation and aeration of the rooms were necessary.
This study showed that the radon concentration in the upper levels of the university campus of UTS was higher than that measured in the lower levels of the building. This showed the involvement of building materials in the concentration of radon.
Effective dose rate indoors, effective dose equivalent and relative risk of lung cancer: The calculated values of effective dose rate indoors, effective dose equivalent and relative risk of lung cancer in a campus building in Burkina Faso were shown in Table 4.
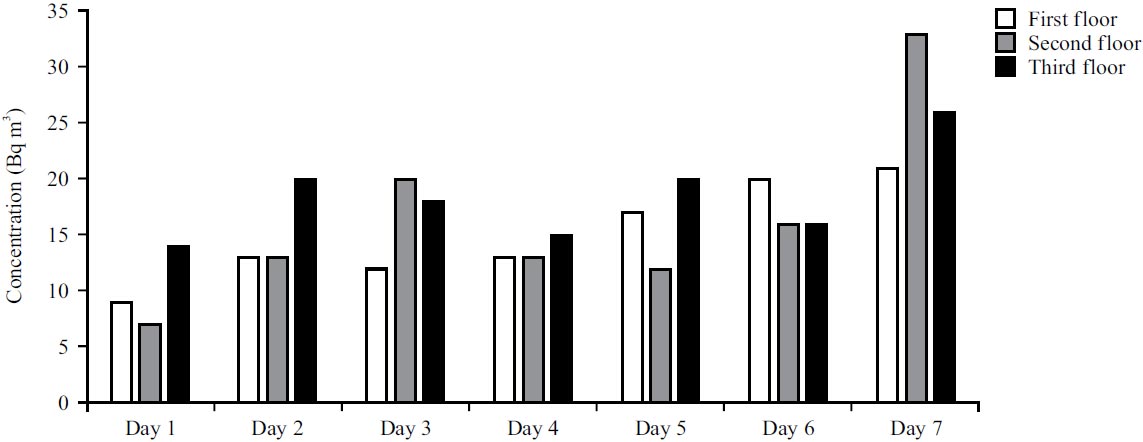 |
| Fig. 1: | Variation of radon concentration in building 1 at UTS campus |
|
| Fig. 2: | Variation of radon concentration in building 2 at UTS campus |
The radon effective dose rate at Patte d’Oie student residence in building 1 and 2 were 0.097 and 0.166 mSv/year, respectively. In Kossodo student residence building, the radon effective dose rate varied from 0.234-0.263 mSv/year. At IDS student residence, the radon effective dose rate was 0.400 in building 1, 0.444 in building 2 and 0.418 in building 3. The radon effective dose rate at Bobo student residences in building 1 and 2 was 0.249 and 0.144 mSv/year, respectively. The effective dose rate in Patte d’Oie, Kossodo, IDS and Bobo student residences building was slightly lower than the “normal” background level of 1.1 mSv/year, as quoted by UNSCEAR-20006,12-15. At UTS student residence, the radon effective dose rates in building 1 and 2 (Table 4) were slightly larger than the “normal” background level of 1.1 mSv/year, as quoted by UNSCEAR-2000. The radon effective dose rates in UTS student residence building 2 (Table 4) were slightly larger than the lower limit of the recommended action level (3-10 mSv/year) as reported by the ICRP-2311,13-15.
The range of the radon effective dose equivalent in the studies building varied from 0.234-8.249 mSv/year. In building 2 and 3 at an IDS student residence, the radon effective dose equivalent was high than the global average dose from inhalation of radon from all sources (1 mSv/year). Also, the radon effective dose equivalent was high than the global average dose from inhalation of radon from all sources (1 mSv/year) in all buildings at UTS student residence.
The radon effective dose equivalent in building 2 at UTS student residence (8.249 mSv/year) was slightly larger than the limit of the recommended action level (3-10 mSv/year) as reported by the ICRP-23.
The RRLC range was from 1.003-1.126 with an average of 1.02 is almost negligible.
CONCLUSION
The main objective of this study was to estimate the radon concentration in student residence buildings and their impact on health. This study showed that the radon concentrations in the student residence building at Patte d’Oie, KOSSODO, IDS and BOBO were less than the reference level proposed by WHO. But the average concentration in building 2 at UTS student residence was 112.43±64.40 Bq m–3, which was higher than the reference level proposed by WHO. Also, this study showed that the radon concentration in the upper levels of the student residence building was higher than that measured in the lower levels. The effective dose equivalent of radon in UTS Student Residence Building 2 was 8.249 mSv/year, which is above the lower limit (3 mSv/year) and close to the upper limit (10 mSv/year).
SIGNIFICANCE STATEMENT
This study showed the presence of radon gas in the rooms of the student residences of Ouagadougou and Bobo Dioulasso. It revealed that radon concentrations are above the reference level proposed by WHO in some student residence buildings with a highly effective dose equivalent. This study will help researchers to direct research work on the evolution of radon concentrations according to construction materials and according to the origin of the materials. It also allows research to be conducted on the health effects of radon gas, which will allow the regulatory authority to set up a national standard.
ACKNOWLEDGMENT
The authors gratefully acknowledge financial support from the Institute of Sciences. In addition, the authors of this study would like to thank all the student representatives in the student residence for their support during data collection.
REFERENCES
- Afolabi, O.T., D.T. Esan, B. Banjoko, B.A. Fajewonyomi, J.E. Tobih and B.B. Olubodun, 2015. Radon level in a Nigerian University Campus. BMC Res. Notes, Vol. 8.
CrossRefDirect Link - Al Zabadi, H., S. Musmar, S. Issa, N. Dwaikat and G. Saffarini, 2012. Exposure assessment of radon in the drinking water supplies: A descriptive study in Palestine. BMC Res. Notes, Vol. 5.
CrossRefDirect Link - Gray, A., S. Read, P. McGale and S. Darby, 2009. Lung cancer deaths from indoor radon and the cost effectiveness and potential of policies to reduce them. BMJ, Vol. 338.
CrossRefDirect Link - Chen, J., 2019. Risk assessment for radon exposure in various indoor environments. Radiat. Prot. Dosim., 185: 143-150.
CrossRefDirect Link - Ahmed, E.A.E., 2014. A study of indoor radon levels and radon effective dose in dwellings of some cities of Gezira State in Sudan. Nucl. Technol. Radiat. Prot., 29: 307-312.
CrossRefDirect Link - Labidi, S., D. Al-Azmi, H. Mahjoubi and R.B. Salah, 2010. Radon in elementary schools in Tunisia. Radioprotection, 45: 209-217.
CrossRefDirect Link - Sokari, S.A., 2018. Estimation of radiation risks associated with radon within residential buildings in Okrika, Rivers State, Nigeria. Asian J. Phys. Chem. Sci., Vol. 6.
CrossRefDirect Link - Arafat, A.A., M.S. El-Tahway and H. Samra, 2018. Comparison of radon concentrations in three types of Egyptian houses. J. Nucl. Radiat. Phys., 13: 147-156.
Direct Link - Quarto, M., M. Pugliese, F. Loffredo and V. Roca, 2016. Indoor radon concentration and gamma dose rate in dwellings of the province of Naples, South Italy, and estimation of the effective dose to the inhabitants. Radioprotection, 51: 31-36.
CrossRefDirect Link - Hassanvand, H., M. Birjandi, A. Amiri, M.S. Hassanvand and B. Kamarehie, 2019. Investigation of indoor radon concentration in dwellings of Aleshtar (western part of Iran) and estimation of the annual effective dose from exposure to radon. Int. J. Radiat. Res., 17: 659-666.
CrossRefDirect Link - Yalım, H.A., A. Gümüş and R. Ünal, 2018. Determination of indoor radon concentration and effective dose equivalent at workplaces of Afyonkarahisar Province. J. Sci., 13: 29-35.
CrossRefDirect Link - López-Pérez, M., F. Hernández, J.P. Díaz and P.A. Salazar-Carballo, 2022. Determination of the indoor radon concentration in schools of Tenerife (Canary Islands): A comparative study. Air Qual. Atmos. Health, 15: 825-835.
CrossRefDirect Link - Luc, B.T., K. Karim, D. Moumouni, B. Cedric, O.I. Cisse and F. Zougmore, 2021. Assessment of indoor radon concentration in residential buildings at Ouagadougou and estimation of the annual effective dose. Radiat. Sci. Technol., 7: 41-46.
CrossRefDirect Link - Al Zabadi, H., K. Mallah and G. Saffarini, 2015. Indoor exposure assessment of radon in the elementary schools, Palestine. Int. J. Radiat. Res., 13: 221-228.
CrossRefDirect Link - Nasir, T. and M. Shah, 2012. Measurement of annual effective doses of radon from drinking water and dwellings by CR-39 track detectors in Kulachi City of Pakistan. J. Basic Appl. Sci., 8: 528-536.
CrossRefDirect Link - Hashim, A.K., E.I. Awad and H.A. Mezher, 2017. Measurement of annual effective dose for Radon in Kerbala University Campus, Freiha, Iraq. Iraqi J. Public Health, 1: 20-25.
Direct Link - Al-Kazwini, A.T., M.M. Al-Arnaout and T.R. Abdulkareem, 2020. Radon-222 exposure and dose concentration levels in Jordanian dwellings. J. Environ. Public Health, Vol. 2020.
CrossRefDirect Link - Yarahmadi, M., A. Shahsavani, M.H. Mahmoudian, N. Shamsedini, N. Rastkari and M. Kermani, 2016. Estimation of the residential radon levels and the annual effective dose in dwellings of Shiraz, Iran, in 2015. Electron. Physician, 8: 2497-2505.
CrossRefDirect Link - Silva, A.S. and M.L. Dinis, 2017. Indoor radon levels and total gamma dose rates measurements in Portuguese thermal spas. Int. J. Occup. Environ. Saf., 1: 79-87.
CrossRefDirect Link - Jaradat, A.M., W.M. Khalilia and K.M. Thabayneh, 2019. Measurements of indoor radon concentrations in selected educational institutions and homes in Jericho City-Palestine. Hebron Univ. Res. J., 8: 40-56.
Direct Link - Amin, S.A., S.D. Alalgawi and H.M. Hashim, 2015. Indoor radon concentrations and effective dose estimation in Al-Karkh side of Baghdad dwellings. Iran. J. Sci. Technol., 39: 491-495.
CrossRefDirect Link