

Viknesh Kumar
Faculty of Engineering and Technology, Multimedia University, Melaka, Malaysia
Boon-Chin Yeo
Faculty of Engineering and Technology, Multimedia University, Melaka, Malaysia
LiveDNA: 60.20931
Way-Soong Lim
Faculty of Engineering and Technology, Multimedia University, Melaka, Malaysia
Joseph Emerson Raja
Faculty of Engineering and Technology, Multimedia University, Melaka, Malaysia
Kim-Boon Koh
Acculex Sdn. Bhd., Melaka, Malaysia
Asian Journal of Scientific Research
Year: 2018 | Volume: 11 | Issue: 3 | Page No.: 344-356





ABSTRACT
Background and Objective: The risk of falls increases for elderly people who are aged 65 and above. Approximately one-third to one-half of the elderly people experience falls on a yearly basis. Falling can be a serious life-threatening event and there is a need to alert their nurses or family members instantly. The developed motion and fall detection is important to response immediate call for medical caregivers and consequently reducing the mortality rate. The objective for this project is to build a cost effective and user-friendly surveillance device. The primary objective of making such system is to track the motion or movement of elderly people in the house. Materials and Methods: Every motion on the mat will reflect to pressure data and collected via a special hardware designed with conductive grids that act like a switch, which is triggered upon pressure exerted over certain area. The pressure value is extracted from a pressure conductive material called velostat. The values are read by microcontroller. Results: The innovative mat will study user’s behaviour daily. Once the fall is detected, an alert message will be sent in the form of SMS and email. Apart from fall detection, surveillance system has been incorporated to support vision-based activation for the fall detection system and user access logging. Conclusion: This designed mat is a non-invasive device essential for detection of fall and monitoring. The developed system gives an accuracy of 80% in detecting a fall event for phase 1 detection and 90% in detecting a fall event for phase 2 detection.
PDF Abstract XML References Citation
Article History
Received: October 02, 2017;
Accepted: December 14, 2017;
Published: June 15, 2018
Copyright: © 2018. This is an open access article distributed under the terms of the Creative Commons Attribution License , which permits unrestricted use, distribution and reproduction in any medium, provided the original author and source are credited.
How to cite this article
Viknesh Kumar, Boon-Chin Yeo, Way-Soong Lim, Joseph Emerson Raja and Kim-Boon Koh, 2018. Development of Electronic Floor Mat for Fall Detection and Elderly Care. Asian Journal of Scientific Research, 11: 344-356.
DOI: 10.3923/ajsr.2018.344.356
URL: https://scialert.net/abstract/?doi=ajsr.2018.344.356
DOI: 10.3923/ajsr.2018.344.356
URL: https://scialert.net/abstract/?doi=ajsr.2018.344.356
INTRODUCTION
Falls are regarded as a serious issue among all age groups, especially elderly. Falling can be considered as a lead from geriatric syndrome which contributes to high morbidity and mortality among elderly1. Elderly are prone to fall due to poor physical and cognitive status. In Malaysia, home accidents resulting in deaths come second to deaths by road accidents. A survey done by Ministry of Health, Malaysia has concluded accidents that occur at homes are 2.5%2.
Elderly people are not an exception. A study done shows falls occurred at home involving elderly people ranges between 19 and 80%2. Most accident-prone area is said to be the bathroom area, an area that is considered private section of a house which lacks monitoring. Hence, this results in a blind spot and increases risks of injuries and death.
Fall prevention and safety devices are vastly available in market. It is important to include these devices as a household utility due to high concerns in injuries that commonly happen at homes. Present tracking devices rely heavily on vision system to monitor people at home for safety. Though vision systems are considered to be a reliable way of monitoring3, the coverage cannot include private areas. This is because surveillance cameras raise an issue of privacy intrusion. A lot of information transmitted from surveillance cameras need not be available to human operators4. Hence, an alternative for vision system was devised.
Thus, in this project the electronic mat was constructed to observe the movement of resident within the household. This tracking method allows to observe and alert users in cases of emergency. This tracking device will be useful in monitoring the movement of old folks without invading their personal space. This non-invasive device could camouflage with daily households and alert the concerned party upon fall detected.
Electronic mats are widely being researched for industrial and household uses. The electronic mats that are developed share some similar hardware or software properties with the current project. Analysis on the hardware and software construction of these mats have been done to observe the possible pros and cons of the current systems. The possible drawbacks of the systems were evicted from mat constructed5-7.
Among the research findings, a sensor mat used in detecting pressure distribution use modules of transduction module5. It is interlinked with sub-modules that branch to form a 32×24 array pressure sensors. The electronic module on the other hand, is composed of slave and master boards. Each sub modules have a dedicated slave board attached to them. The boards aid in acquiring signals from the sensors. The signals are diverted to a microcontroller called STM32F4 which are on the board. The data from the slave boards are transferred to a master board to be acquired by GUI. Data transfer is done through USB com port. The software construction for this mat system uses Matlab platform. The reason for opting for Matlab was to optimize the usage of median filters and graphing system of the platform. The GUI can identify the shape of the object on the mat and the weight distribution of the object placed.
A different pressure mapping mat device used in tele-homecare was constructed from scratch by building custom sensors from pressure-resistive elements6. A piece of fabric was treated using polymer solutions at all cross points. At top and bottom part of the fabric, conductive threads were inserted to form an upon pressure conductive platform. The conductive threads were initially treated with an aqueous solution called the PEDOT: PSS with a little mixture of ethylene glycol. This helped enhance the conductive thread’s resistivity up to 10 k sq–1. The fabrication process includes stitching the conductive threads in a method called lockstitch. To avoid short circuit, measures should be taken while stitching by arranging the stitch pattern in such a way top and bottom conductive paths never meet. Data acquisition is done using Arduino Yun. With 8-bit resolution, the matrix size detected is up to 32×32 array. The GUI version for this mat is done in Javascript for multiple accesses in various devices. This allows flexibility of user in using it anywhere and anytime for monitoring.
Next mat construction that was observed is of a mat being used as a user identification sensor for smart home events7. The mat is constructed using piezo-resistive fabric and conductive threads. Rows and columns are created by sewing silver plated threads. The piezo-resistive fabric is meshed in between to allow conduction only on pressure. A zig-bee module is used for processing the data. A GUI at PC receives the data and translates the pressure values to image. In this system, the GUI collects data from one mat to another over the internet for processing. A primary decision-making server is required to analyse the environment based on outputs from the mat sensors. All processes are done using IoT devices for a wider coverage.
Common issues that were accounted in the design practices were avoided entirely in the implementation of the current project. Among issues noticed, the primary mat5 analysed showed a hardware construction practice that allows expansion of mat size only by modular method. In other words, a single mat itself has reached maximum number of conductive array and cannot be expanded further without having the user to purchase or build a similar mat and attach in series. Hence, a sizable mat design is to be devised to suit various environment at low cost.
The secondary mat6 and tertiary mat7 systems that were analysed relied heavily on stitching. The secondary mat6 was constructed using conductive threads coupled with resistive at pressure conducting solution dripped and left to dry at junctions of the conductive grid formed by the threads. The tertiary mat7 was simply built by stitching together piezo-resistive fabrics. Both the methods were time-consuming when it came to construct a large scale mat. Slight mistakes in hardware construction could alter the data accuracy. Hence, it was essential to come up with a mat design that required minimal time for set up and the process of construction should be less straining than the current method.
The tertiary and secondary mat systems shared a common drawback in GUI design as well. Through analysis it was discovered that both the GUIs constructed relied heavily on server. Internet based GUIs are important for tele-observations. Users can monitor homes at farther distance without having to physically be present at home. The drawback however is when the internet connectivity of the system fails. It is to be noted that internet connection disruptions are common in every household. It is important that the GUI is non-server dependent system to avoid missing out on alert and detection at crucial moments. Hence, the GUI to be constructed should be able to work in both online and offline modes.
MATERIALS AND METHODS
Hardware implementation
Component selection: The components used in this project are velostat, aluminium tape, analog multiplexers and arduino. Velostat is a form of piezo-resistive material. This means the material has electrical resistance decreases with pressure. This is because the packaging material of the product consists of a polymeric foil meshed with carbon black which makes it electrically conductive. Velostat is commonly used for the protection of items that are prone to damages from electrostatic discharge. The electrical conductivity characteristics is not affected by humidity of surrounding8. Combined with conductive foils, the Velostat makes a great bend sensor.
The 16-Channel Analog Multiplexers are being used to obtain the signals from the mat and channel them into the limited I/O ports of Arduino Uno9. The multiplexers work chip like a rotary switch. It routes the common pins to a selected pin among the 16 channel pins. The multiplexer works with both digital and analog signals. The connection on the multiplexer can function in either direction. To control the multiplexer, 4 digital or analog outputs are connected from Arduino to S0-S3 of multiplexer10. In this project, 4 ports from Arduino are used to select and activate a column channel. Four ports from Arduino are used to select and sense a row channel.
The aluminium tape was chosen as the material to form conductive grid in the mat due to its conductivity strength, adhesive nature, flexibility, lower thickness and reliability11. This tape is widely used in industries such as electronics, military and aerospace due to its quality. The tape has an adhesion strength of 33 N/100 mm. It’s incredibly strong adhesive nature allowed it to stick any form of fibre surface without peeling off on rough handling. A single tape is 32.91 m long which suffices in building a grid of 15×15 on a 2×1 m mat. The thickness of the mat is 0.05 mm, hence, making its presence on the mat untraceable. The width of the tape is 50 mm. The tape comes with a conductive acrylic adhesive and is commonly used in EMI shielding and static discharge application11. This allowed the material to have an increased conductivity nature which helped realize the project design.
Hardware construction: The hardware was constructed based on the design in Fig. 1-3. Figure 1 and 2 shows the layout of the fabric, velostat and aluminium grid that drives the mat. Figure 3 represents the circuit connection. Figure 1 shows the alignment of 15 rows of aluminium and 15 columns of aluminium on the fabric. The aluminium serves as 225 switches that conduct upon contact between row and column. To separate the grids from conducting, a velostat is placed in between which is triggered upon pressure.
The size of mat allocated for the whole design is 1×2 m for both row and column. The velostats are placed at 0.84 m×1.68 m area. Individual velostats that are available to purchase comes in size of 0.28 m×0.28 m. Hence, a total of 18 sheets are required for this project.
Figure 3 shows the hardware interaction between microcontroller and the electronic mat. Signal is sent from mat to microcontroller then computer (PC) through serial cable and the data is then processed by the PC. If fall is detected, the notification is transmitted to cloud to be accessed through mobile phones by remote observer.
Software implementation
Platform and libraries: The overall GUI design works by first activating webcam to monitor the number of people entering. The program then displays the activity on the mat. Data collection begins after the activity display has begun. There are 2 phases in fall detection, first, shape detection is done to see if any suspicious motion has occurred on the mat.
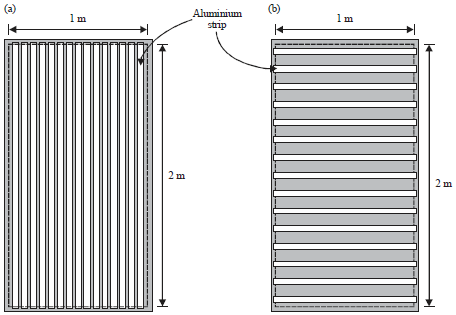 | |
| Fig. 1(a-b): | Conductor layers of pressure sensor mat, (a) Conductor layer with vertical aluminium strips and (b) Conductor layer with horizontal aluminium strips |
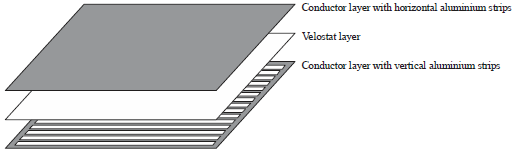 | |
| Fig. 2: | Fabric and velostat layout |
 | |
| Fig. 3: | Block diagram on hardware integration |
Next, if any abnormalities are detected, data matching is done with images in database to conclude falling event. If falling event has occurred, an alert message is displayed. The message prompts the user if the fall is severe. If the user accepts it is a severe case, a mapping system is triggered to show nearby possible hospitals. Visual Studio 2015 was selected as a programming tool for this project. Windows form application was developed using the tool. Several libraries were used in developing the program which includes EmguCV and OpenGL.
GUI flowchart: Figure 4 shows the flow of the program that was constructed for monitoring elderly and detecting falls.
Face detection and recognition: The EmguCV was used for face detection and recognition12. The library conducts detection using a method known as HaarCascade (HCC). The HCC is a machine learning approach that uses multiple negative and positive images for training13. From the images captured, features are extracted. Haar features extracted, based on Kasinski and Schmidt14, follow the following equation:
 |
| • | RecSum (x, y, w, h, β) denotes the summation of intensity and the symbols (x, y, w, h, β) denote rotation coordinates and dimensions across the rectangle enclosed in detection window |
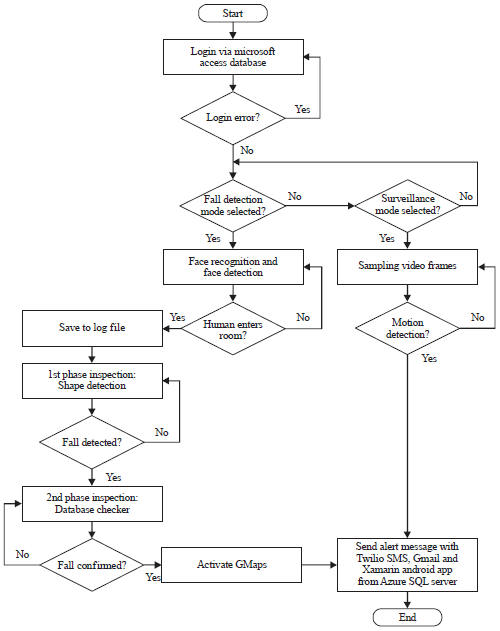 | |
| Fig. 4: | Flowchart for fall detection and alert messaging processes |
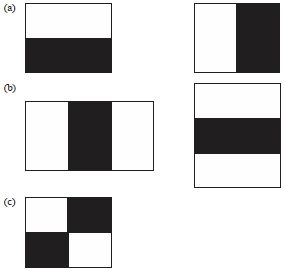 | |
| Fig. 5: | Haar-like features |
| • | Weighted pixel summation of two rectangles are considered |
| • | Weights applied compensate the differences in area of two rectangles. The weights applied have opposite signs. Thus, giving us ω0• Area(r0) = -ω1• Area(r1), substituting ω1 = 1 one gets ω0 = -Area(r0)/Area(r1) |
The constraints leave us with features that are denoted by Fig. 5. The black and white blocks denote pixels. Sum of pixels under white and black rectangles denote a single feature. These features are applied on all training images and the best threshold that classifies the faces to positive and negative is chosen. The program can choose the minimum error rate while the classification is done and increases the weight of the error classification. This is done continuously till the error rates are reduced before the actual recognition is done. For the image process, the image is turned into grayscale. Based on the identifiers, the face classification is done and the number of faces detected is filtered. These values are summed to detect the number of people that have entered the mat placed room.
Image construction: The OpenGL was used to construct images in 2D and 3D formats1. This library is needed in this project to enable construction of 15×15 grids programmatically and track motion. The library draws red 3D terrains to show motion on the programmatically constructed grid. The terrain height is constructed based on the pressure values recorded.
Pseudo-colours are used to allow user to observe body posture and balance while performing gait analysis. The pressure changes are ranged from the lowest to highest using colours from blue to red. This allows user to correct his Posture stance and prevent falling risk. The image can be viewed in both 3D and 2D for better analysis.
Shape detection (phase 1): The first phase of fall detection, posture detection using shapes is done. Shape detection is done through canny edge detection15 and Hough line detection16. Canny edge detection is done by, first, noise filtering. A Gaussian filter is set to image to reduce noise while conducting edge detection as the process can cause noise to appear on the image. The next step will be to identify the intensity of the image gradient. The image is filtered using sobel kernel for smoothing and the edge gradient is obtained. The following step is to scan the image and remove unnecessary pixels that may not contribute to edge detection. The final step is in adjusting the threshold value for optimal recognition. Hough line detection follows the canny edge detection. It is a method used to detect presence of straight lines in the image. The entire process to identify shapes on an image was kept under 15 msec for optimal user experience. The process was clocked using a stopwatch code available in C#. The process timing is then displayed on the picture box. The shapes detection is highlight by enclosing the shapes with polygons. The number of shape changes detected are considered, the values are ranged in accordance with the type of data. Using this ranges, a feedback system is constructed with if-else statement to notify the user on the differences in shape and what possible activity it could be on the mat. The data input from the folder is stored in array and feed into the picturebox using timer.
Database checker (phase 2): Database checker is the second phase in fall detection. It was implemented using a method called fuzzy colour and texture based histogram analysis (FCTH)17. It is a fuzzy system that is used in content based image retrieval for image matching by classifying the colour and texture information18. A colour histogram, through a set of bins, represents the colour in a quantized colour space. Based on Girgis and Reda19, the equation below represents a colour histogram derived from a given image:
H = (H [0], H [1]..., H [i],..., H [n])
where, i is the colour bin, H[i] is quantity of pixels within colour i and n is the total number of bins in the histogram.
For texture analysis, a haar wavelet transform (HWT)19 is used. The orthogonal matrix for HWT is shown below:
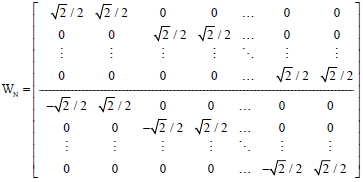
The process is as such where an image is classified into a matrix; assuming the matrix is represented by letter Q with a dimension of X×Y. The computation now is WxQ. The matrix now is seen as multiplication of Wx applied to each column of
Q so the output yield will be an X×Y matrix where each column is X/2 weighted averages followed by X/2 weighted differences. The rows should be processed as well. This is done by multiplying WxQ by  Transposing the HWT matrix puts the filter coefficients in the columns while multiplication on the right by means that we will be dotting the rows of WxQ with the columns of Hence, the equation of HWT is now defined as:
 |
The FCTH, as overall, is a combination of 3 fuzzy units. In the first unit, extraction of histogram based on fuzzy-Linking is done. This histogram branches from a colour space known as HSV. A 10-bin histogram is generated from this process. The second unit expands the histogram to 24-bin.
 | |
| Fig. 6: | Block diagram of content flow |
These imports related information to corresponding hue colours. The third unit turns image blocks that was divided at start of the process to be transformed with HWT. This process collects the texture elements of the image.
These elements help converting the 24-bin histogram to a 192-bin histogram. The quantized value limits the length of descriptor to 576 bits/image. At the completion of these processes, the Tanimoto coefficient is inserted. This coefficient accounts the distance of FCTH measurement between the compared images for matching. The process is triggered by pulling the concerned image from shape detection process. The images from a sample data folder is collected and looped to find the most identical image to the concerned image. The matched picture from sample data is displayed on picture box.
Maps: The GMap.Net is an open source mapping library. It is widely used in windows forms application to build a powerful mapping system that can show locations in server, cache and server and cache modes. The map is constructed in form of tile sources. Tile sources are method of overlaying multiple layers of image to form a definite map. The method overlays a series of data such as foreground, roads, area, map background and elements in mapping before displaying the map on screen. The GUI can read address saved by user in the notepad and display them in the map. Up to 100 addresses saved in the text file can be read and displayed on the GUI. This was achieved using a string reader method. The text file is accessed from the PC and the individual lines are captured into an array and placed into the GMap geo reader to be displayed on the map. The process is repeated for 100 cycles using looping function. A pin feature was added to the locations that are displayed for the user’s ease in locating places on the map. The user can set start and end points, as well as, mark areas of interest using the pins.
Surveillance: Security surveillance feature was added by implementing motion detection from image processing. The GUI continuously inspects changes on mat when surveillance mode is selected by user. If motion is observed, the GUI alerts the user of a security breach.
IoT remote access and control: For IoT based computing and monitoring activities of elderly remotely Microsoft Azure platform was used20. Azure platform is a cloud computing system that was created by Microsoft as a platform to build, test and monitor applications through a global network governed by Microsoft data centres. A SQL Azure database21 was deployed in the Azure platform to transfer images and commands to and from PC. The SQL Azure is among many cloud database service available on Azure platform. The SQL Azure was chosen as it allows user to store relational data in the cloud quickly and can be scaled in size based on needs Xamarin platform was used to build the android application required for the project. Mobile application was created as means of increasing user flexibility in accessing data from multiple devices. Figure 6 block diagram depicts the flow of content to and from devices connected to Azure.
Experimentation: Three test subjects were chosen for this experimentation. The individuals were of height range between 160 and 170 cm and had an average weight of 60-70 kg. The criteria for weight and height were made to mimic stature of an average elderly adult of ages between 65 and above22-24. The reason for the assumption of height range is because as adults grow older, they are biologically subjected to become shorter because the cartilage between their joints gets worn out and osteoporosis causes the spinal column to become shorter23. Decrease in height is prevalent for both aged men and women. The assumption reason for the assumption of the range of weight was because weight loss varies for men and woman24. Men often gain weight until about age 55 and then begin to lose weight later in life. This may be related to a drop in the male sex hormone testosterone. Women usually gain weight until age 65 and then begin to lose weight. Weight loss later in life occurs partly because fat replaces lean muscle tissue and fat weighs less than muscle22. This experiment was carried on in a lab mimicking an environment of a room. The subjects were asked to sit, stand and lie down or fall on the mat to obtain frames of different posture. The frames were then analysed by the processing GUI and the output of the GUI was recorded. This was process was repeated 10 times for each posture to analyse precision.
RESULTS
Data collection from mat and computation: The data collection happens from the mat through multiplexers. The multiplexers gather the upon pressure conduction values through grid system on the mat and sends to Arduino for processing. This data is interpreted by the OpenGL library to be constructed into image. The render heights of the image terrain are set by the serial values obtained from Arduino. Figure 8-10 show the differences in terrain heights and image construction when different activities are conducted on the mat.
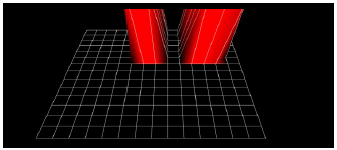
Figure 7 was grabbed in a standing posture. The image shows rendering of terrain when both legs are on the mat. The weight distribution of the user can be observed on his legs. It can be noted that more pressure is being translated to the right leg than the left while standing. The image rendered mimics the Posture adjustment of the user at real time.
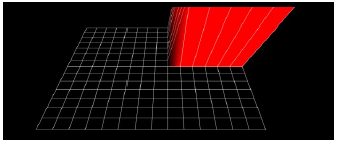
Figure 8 shows the image of the user in a sitting posture. As in sitting position the weights are equally distributed, the image shows large spike at the area of the mat the user sat on. The serial data however shows varying pressure in a small significant scale as slight swaying is observed in the user’s body.
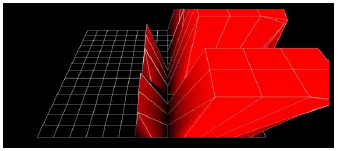
Figure 9 shows observation at lying position. The user has laid down on the mat covering a significant portion of the mat. This causes the terrain to be drawn at the location and based on the size of the user coverage on the mat. The varying pressure distribution on the body can also be observed on the mat.
Two phase fall inspection: Fall detection is assured to the observer using this system by two phase checks. The posture of the user that is on the mat is checked using a shape detection system. The first phase in fall detection allows distinguishing between different postures based on the shape of the terrain constructed on the GUI. A series of images are streamed into a picture box and the possible posture is notified using a label. Figure 10 shows the shape detection process. The labels in blue are included to indicate the processing time of individual image.
 | |
| Fig. 7: | Standing posture |
 | |
| Fig. 8: | Sitting posture |
 | |
| Fig. 9: | Fall or lying down posture |
| Table 1: | Total probability of detecting fall event for both phases |
 | |
The second phase is pattern matching. It provides a more accurate detection of fall event compared to the first phase. It matches the possible fallen event data collected with stored sample data of falls and projects the output in a picture box. Figure 11 shows the database image matching done.
Table 1 shows the accuracy differences within the 2-phase detection devised as means of detecting falls. The postures that were analysed were sitting, standing and lying down or fall. Ten samples were captured for each posture for each subject during the experimentation and the accuracy differences were tabulated and analysed to improve the system.
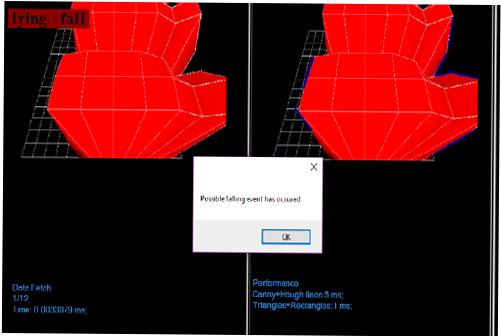 | |
| Fig. 10: | Shape detection |
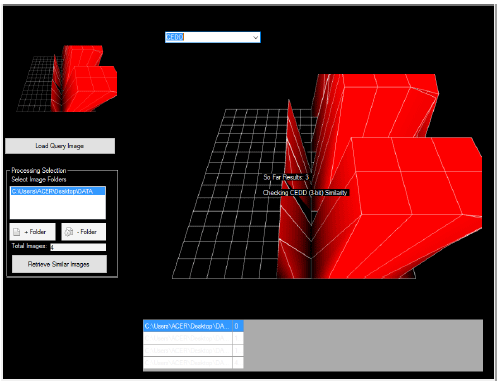 | |
| Fig. 11: | Matching data with samples in database |
Table 1 denotes probability of accuracy for phase 1 and phase 2. The P(fall | fall) denotes probability of detecting fall in fall samples. The P(fall | not fall) denotes probability of getting fall alert in a not fall event. The P(not fall| fall) is probability of detecting not fall postures in fall event.
Face detection and recognition: Face recognition is done to observe the person who has entered the house, as well as, keep count of the total individuals in the house. This feature is important in identifying the person who might have succumb to injury or for observation on the activities that is being done by the individual. The GUI is able to highlight the face of the user and since the system had been trained to recognize the user, it displays the individual’s name on screen. The trained images are stored in the application start-up folder. The higher the number of trained images stored of an individual, the more accurate the system is in recognizing the facial pattern.
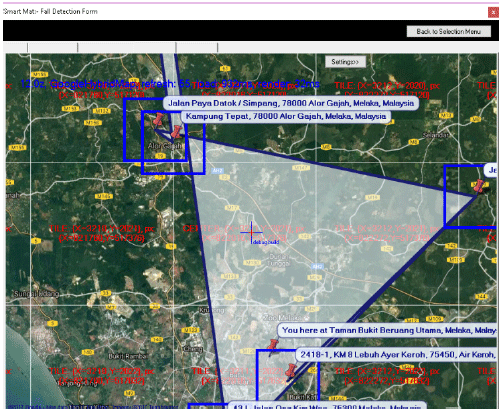 | |
| Fig. 12: | Location map |
The total number of people in the frame is also displayed. The count is important to recognize the number of individuals that are on the mat for accuracy of monitoring.
Maps: Mapping system used in this project is to aid user at times of emergency by notifying the nearest location of hospitals. The user can use this system in many ways. Firstly, the user must set the locations of the hospitals in a text file that is readable by the GUI. The reason for opting a manual address book system is to reduce dependence on Internet based system in case it may fail at crucial timing. The mapping system with options for server based access to map providers and the flexibility of saving cache files for offline access eases the user’s access to maps. The data downloaded for cache use are tile sources which are overlay on GUI start-up. Figure 12 shows the addresses saved in text file and the pins showing the location in accordance on the map.
Surveillance mode: Security mode enables the user to observe suspicious motion on the mat upon surveillance mode is selected. An alert message is sent to user upon suspecting breach of security. Figure 13 shows the motion captured by GUI.
IoT remote access and control: The transition of the GUI in PC synchronizes with Mobile App control. The SQL Database is updated with result of fall upon detection. The image is sent to the Mobile App for observer’s view. Figure 14 shows an emulated mobile app.
Pseudo-colour pressure level segregation: The colours in the images denote the differences in pressure exerted. The transition of colours from blue to red shows the transition from the lowest pressure change to highest pressure change identified as the user balances his or her posture. The changes in pressure can be observed in both 2D and 3D graphical representation as shown in Fig. 15 and 16, respectively.
DISCUSSION
The mat has been made in such a way it is easily scalable as a single unit. This is a leap from the modular based mat analysed primarily5. In other words, a single mat itself can have multiple conductive array and can be expanded further in size without limitation. This increases design option for the consumer in terms of customization by size at a lower cost.
Compared to secondary mat6 and tertiary mat7 systems which relied heavily on which is deemed time-consuming when applied in construction a large scale mat.
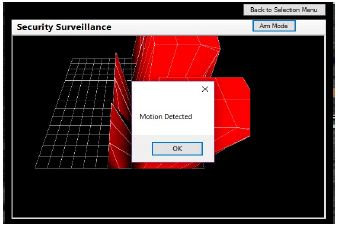 | |
| Fig. 13: | Surveillance system |
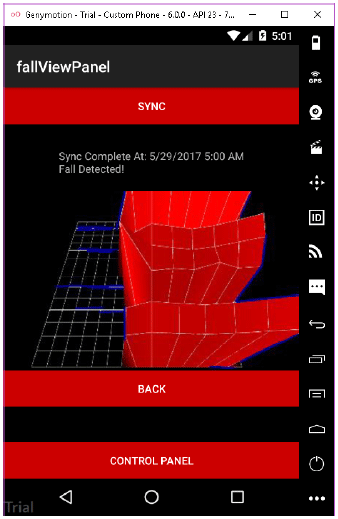 | |
| Fig. 14: | Mobile application to control GUI remotely |
Hence, thecurrent mat design uses aluminium tapes11 with highly adhesive characteristics allowing large mats to be constructed in a short span. The tape itself is flexible which allowed curling and folding without breaking.
The common drawback in the GUI design of the tertiary and secondary mat systems were averted. The GUI constructed for the current project works in both online and offline modes.
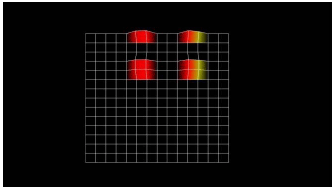 | |
| Fig. 15: | 2D pseudo-colour pressure analysis |
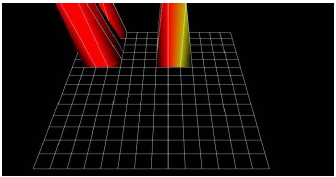 | |
| Fig. 16: | 3D pseudo-colour pressure analysis |
The current GUI is constructed in a way all the process is done in offline. On detection of fall two methods of alert are sent which is through SMS and email. This allows user to access alert signals with and without the need of internet connectivity. If user chooses to view the frame of a fall event identified by the GUI, the user can simply open his or her android application to fetch the data from SQL server. The application also allows remote monitoring. If the mishap happens while the user is at home and he or she is in a dire need of seeking route for nearby clinics or hospitals, the user could access the GMap mapping system which works both online and offline modes and guide the injury afflicted person to the nearest medical centre.
The accuracy of the GUI identifying different postures is, however, unique to the current project. Similar project that is able to analyse Posture differences based on data gathered from an electronic mat has not been identified. The accuracy analysis, as well as, the data reading mismatches and similarities were all done by observing the reading from the mat system and by visual confirmation of the test subject’s posture at the time of data collection. The image construction method, however, shares similarities with the primary, secondary and tertiary mats analysed. The method is to have a mesh of conductive grids with piezo-resistive material in between the network of grids; which upon pressure allows the grid to conduct. The gravity of conduction at each point of the grid is deciphered using a microcontroller and the image is constructed in accordance to the signal strength.
Since, visual cues captured by common camera systems to detect falls are absent in this project3, the privacy concern pertaining misuse of data captured by cameras fitted indoors is eliminated by this project4. The future enhancement on this project could break social stigma surrounding the limited choice of safety equipment to monitor elderly at home and push forward home security for a safer home.
CONCLUSION
Pressure-sensitive mats are essential as a safety unit in all household. This is due to the high accident rates that happen within homes that are perceived as a safe compound for both elders and children. Such safety kits should always be at accessible range at times of mishaps. This ensures a collective wellbeing of family members at home. This mat can meet that criteria by being able to be placed at strategic locations around the house where accidents are prone. Since the device can work in offline modes and via serial communication attribute, real time data collection is possible. The observer merely needs to monitor from his or her room or work environment within home without having to physically observe the residents within the home.
Mapping system included in the system to locate nearest hospitals is essential for the observer to decide to contact at cases of emergency. The two-phase data checkers ensure the observer is not triggered by false alarms. The reason for the two-different data inspection system is because of the level of accuracy they carry. If the initial phase fails to detect the posture of observed, pattern matching will be a superior option to check if the data corresponds to samples provided to the observer.
The system has been designed and tested with test data and from the results it is found to be performing well. Hence, it can be implemented in real situation.
SIGNIFICANCE STATEMENT
This study discovers the possibility of implementing the fall detection system through two-stage image processing that can be beneficial for boosting the detection accuracy. This study will help the researcher to uncover the critical area of efficiently utilizing the processing power for fall detection that many researchers were not able to explore. Thus, a new theory on this multi-stage fall detection system may be arrived at.
REFERENCES
- Dhargave, P. and R. Sendhilkumar, 2016. Prevalence of risk factors for falls among elderly people living in long-term care homes. J. Clin. Gerontol. Geriatr., 7: 99-103.
CrossRefDirect Link - Romli, M.H., L. Mackenzie, M. Lovarini and M.P. Tan, 2016. Pilot study to investigate the feasibility of the Home Falls and Accidents Screening Tool (HOME FAST) to identify older Malaysian people at risk of falls. BMJ Open, Vol. 6, No. 8.
CrossRefDirect Link - Hwang, S.H. and S.B. Pan, 2016. Fall detection system using the open source hardware and RGB camera. J. Korean Institute Inform. Technol., 14: 19-24.
CrossRefDirect Link - Kerr, M. and R. van Schyndel, 2014. Adapting law enforcement frameworks to address the ethical problems of CCTV product propagation. IEEE Secur. Privacy, 12: 14-21.
CrossRefDirect Link - Saenz-Cogollo, J.F., M. Pau, B. Fraboni and A. Bonfiglio, 2016. Pressure mapping mat for tele-home care applications. Sensors, Vol. 16.
CrossRefDirect Link - Kim, H., I. Kim and J. Kim, 2015. Designing the smart foot mat and its applications: As a user identification sensor for smart home scenarios. Adv. Sci. Technol. Lett., 87: 1-5.
Direct Link - Barba, R., A.P. de Madrid and J.G. Boticario, 2015. Development of an inexpensive sensor network for recognition of sitting posture. Int. J. Distributed Sensor Networks, Vol. 11, No. 8.
CrossRefDirect Link - Sudhan, R.H., M.G. Kumar, A.U. Prakash, S.A.R. Devi and P. Sathiya, 2015. Arduino atmega-328 microcontroller. Int. J. Innov. Res. Electr. Electron. Instrum. Control Eng., 3: 27-29.
CrossRefDirect Link - Culler, D. and J. Long, 2016. A prototype smart materials warehouse application implemented using custom mobile robots and open source vision technology developed using emgu CV. Procedia Manuf., 5: 1092-1106.
CrossRefDirect Link - Yildirim, M.E., J.S. Park, J. Song and B.W. Yoon, 2014. Gender classification based on binary haar cascade. Int. J. Comput. Commun. Eng., 3: 105-108.
Direct Link - Kasinski, A. and A. Schmidt, 2010. The architecture and performance of the face and eyes detection system based on the Haar cascade classifiers. Pattern Anal. Applic., 13: 197-211.
CrossRefDirect Link - Fuad, K.A.A. and S.M. Rizvi, 2015. Hardware software co-simulation of Canny edge detection algorithm. Int. J. Comput. Applic., 122: 7-12.
CrossRefDirect Link - Yang, W.X. and Z.C. Huang, 2014. Fast circular object detection using multiscale grayscale hough transform. Applied Mech. Mater., 490-491: 1542-1547.
CrossRefDirect Link - Verma, R. and V. Thakur, 2016. An adaptive histogram values & texture descriptor for data analysis. Int. J. Sci. Res., 5: 2318-2322.
Direct Link - Dey, M., B. Raman and M. Verma, 2016. A novel colour-and texture-based image retrieval technique using multi-resolution local extrema peak valley pattern and RGB colour histogram. Pattern Anal. Applic., 19: 1159-1179.
CrossRefDirect Link - Girgis, M.R. and M.S. Reda, 2014. Content-based image retrieval using image partitioning with color histogram and wavelet-based color histogram of the image. Int. J. Comput. Applic., 104: 17-24.
CrossRefDirect Link - Nikam, P.P. and R.S. Suryawanshi, 2015. Microsoft windows azure: Developing applications for highly available storage of cloud service. Int. J. Sci. Res., 4: 662-665.
Direct Link - Mulligan, R., M. Gilmer-Scott, D. Kouchel, D. Nickelson, A. Safavi, M. Drickamer and E. Roberts, 2017. Unintentional weight loss in older adults: A geriatric interprofessional simulation case series for health care providers. J. Teach. Learn. Resourc., Vol. 13.
CrossRefDirect Link - Zepa, D., A. Slokenberga, A. Balode, A. Villerusa and A. Stolarova, 2015. P-164: Weight and height prediction of Latvian senior hospitalized patients. Eur. Geriatr. Med., 6: S75-S75.
Direct Link - Chiu, H.C., H.Y. Chang, L.W. Mau, T.K. Lee and H.W. Liu, 2000. Height, weight and body mass index of elderly persons in Taiwan. J. Gerontol. Series A: Biol. Sci. Med. Sci., 55: M684-M690.
CrossRefDirect Link